However, the problem is that “traditional” competitive analysis is overkill for most businesses — it requires impractical data and takes too long to complete (and it’s very expensive if you choose to outsource).
A solution to that is a lean approach to the process — and that’s what this guide is about.
In other words, we’ll focus on the most important data you need to answer the question: “Why would people choose them over you?”. No boring theory, outtakes from marketing history, or spending hours digging up nice-to-have information.
In this guide, you will find:
- A real-life competitive analysis example.
- Templates: one for input data and one for a slide deck to present your analysis to others.
- Step-by-step instructions.
Our template consists of two documents: a slide deck and a spreadsheet.
The Slide deck is the output document. It will help you present the analysis to your boss or your teammates.
Click here to get an editable copy in Google Slides.
The spreadsheet is the input document. You will find tables that act as the data source for the charts from the slide deck, as well as a prompt to use in ChatGPT to help you with user review research.
We didn’t focus on aesthetics here; every marketer likes to do slide decks their own way, so feel free to edit everything you’ll find there.
With that out of the way, let’s talk about the process. The template consists of these six tasks:
- Identify your direct competitors.
- Compare share of voice.
- Compare pricing and features.
- Find strong and weak points based on reviews.
- Compare purchasing convenience.
- Present conclusions.
Going forward, we’ll explain why these steps matter and show how to complete them.
Direct competitors are businesses that offer a similar solution to the same audience.
They matter a lot more than indirect competitors (i.e. businesses with different products but targeting the same audience as you) because you’ll be compared with them often (e.g. in product reviews and rankings). Plus, your audience is more likely to gravitate towards them when considering different options.
You probably have a few direct competitors in mind already, but here are a few ways to find others based on organic search and paid search ads.
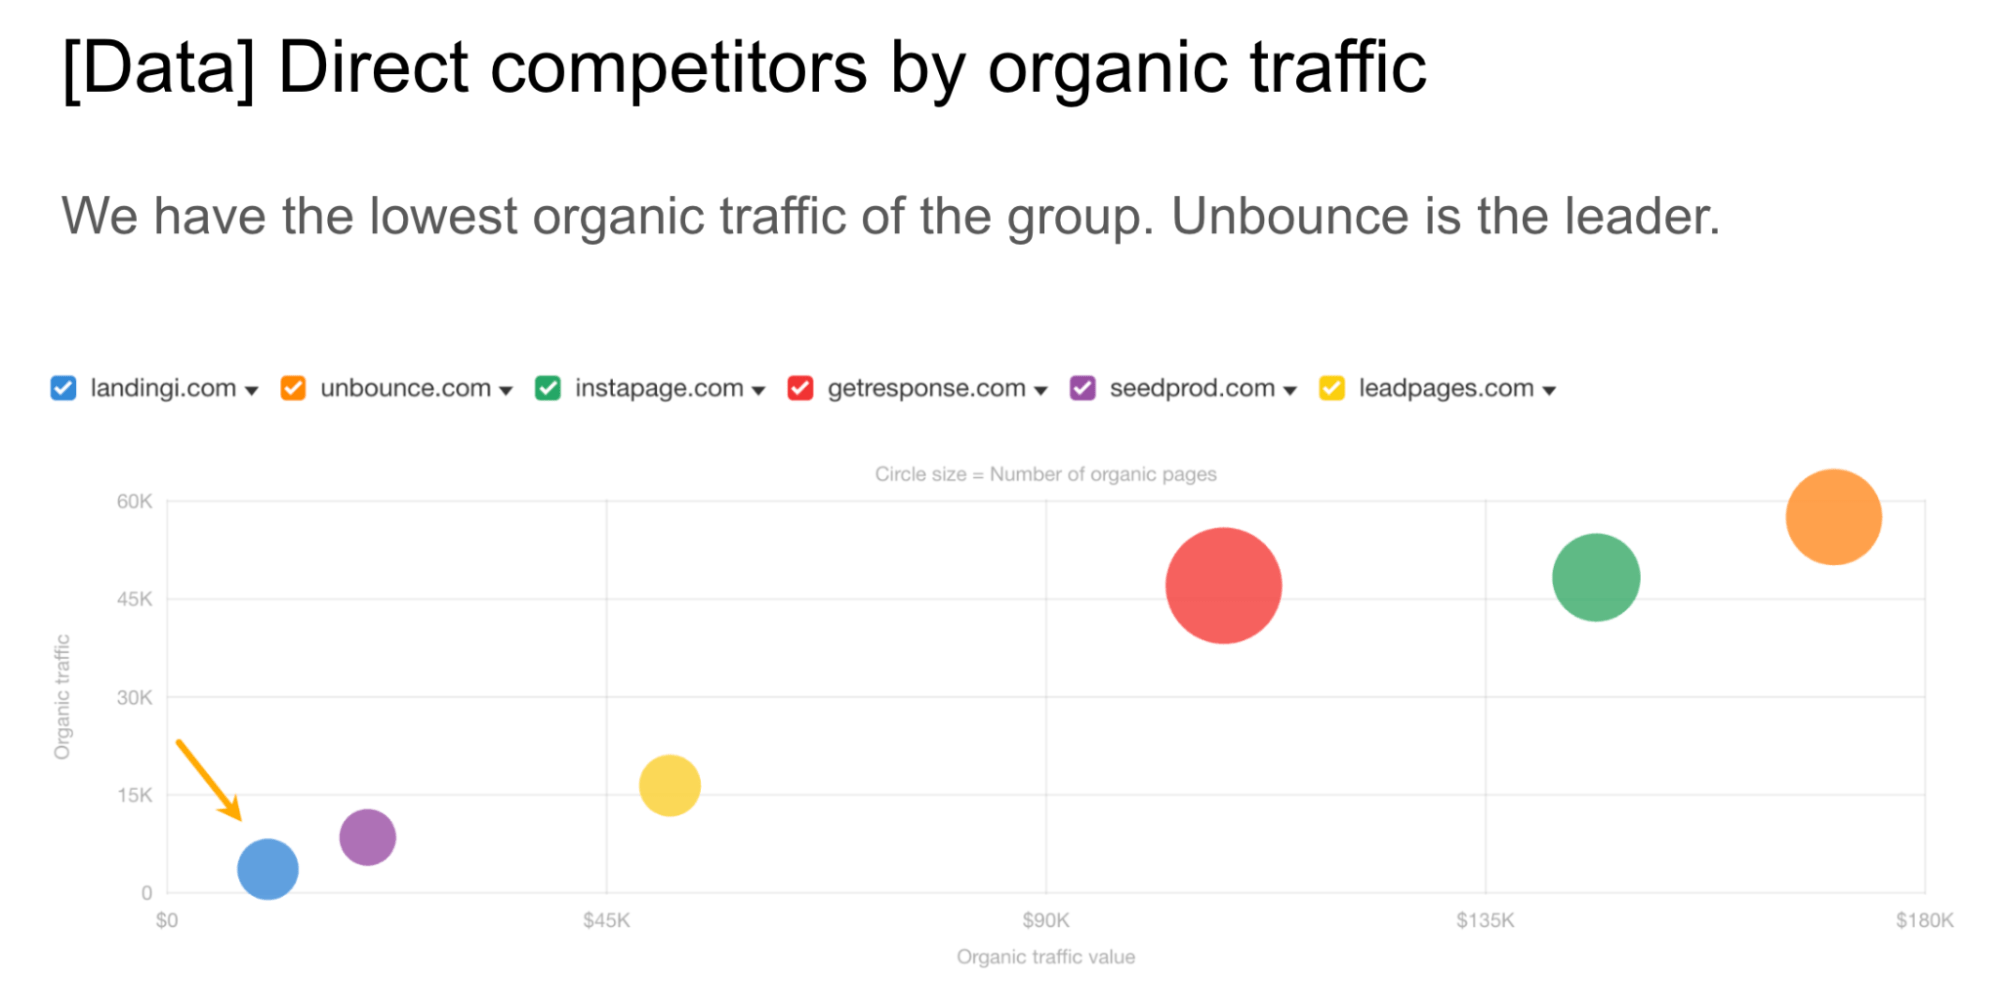
Our basis for the analysis was Landingi, a SaaS for building landing pages (we chose that company randomly). So in our case, we found these 3 direct competitors.
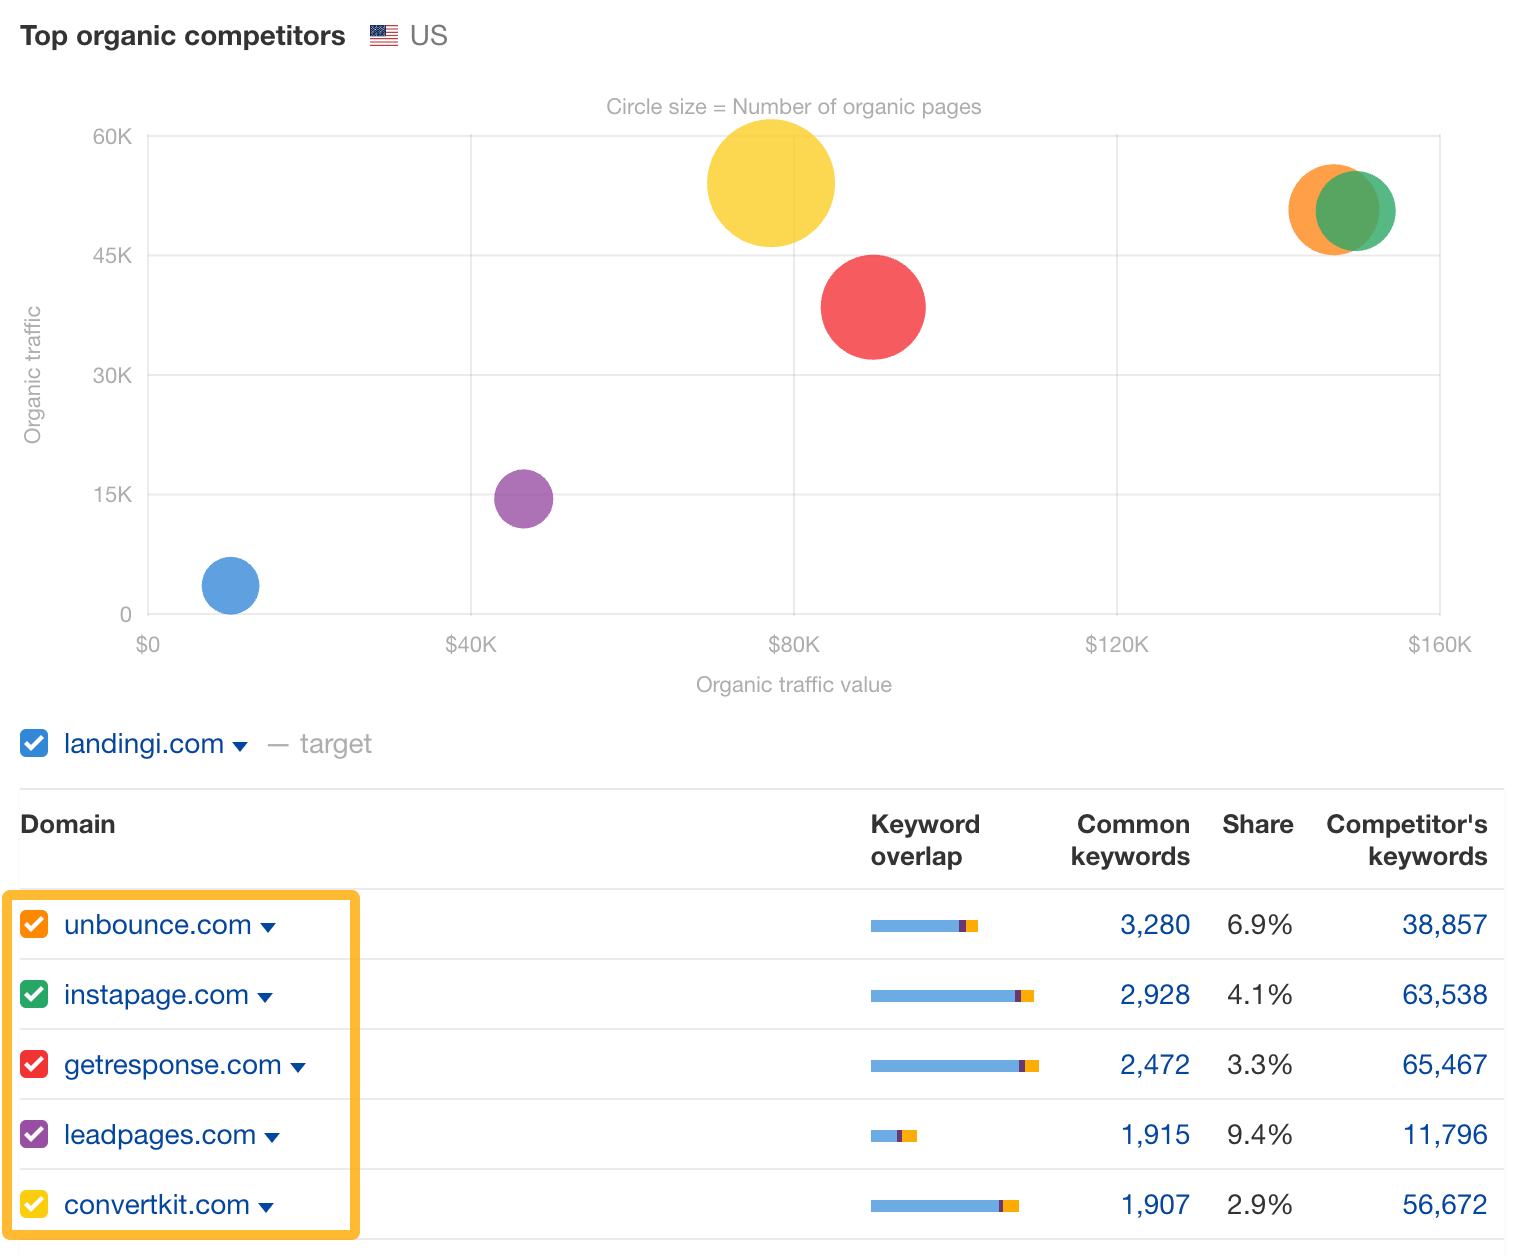
Look at keyword overlap
Keyword overlap uncovers sites that target the same organic keywords as you. Some sites will compete with you for traffic but not for customers (e.g. G2 may share some keywords with Landingi but they’re a different business). However, in many cases, you will find direct competitors just by looking at this marketing channel.
- Go to Ahrefs’ Site Explorer and enter your site’s address.
- Scroll down to Organic competitors.
- Visit the URLs to pick 3 – 5 direct competitors.
To double-check the choice of competitors, we also looked at who was bidding for search ads on Google.
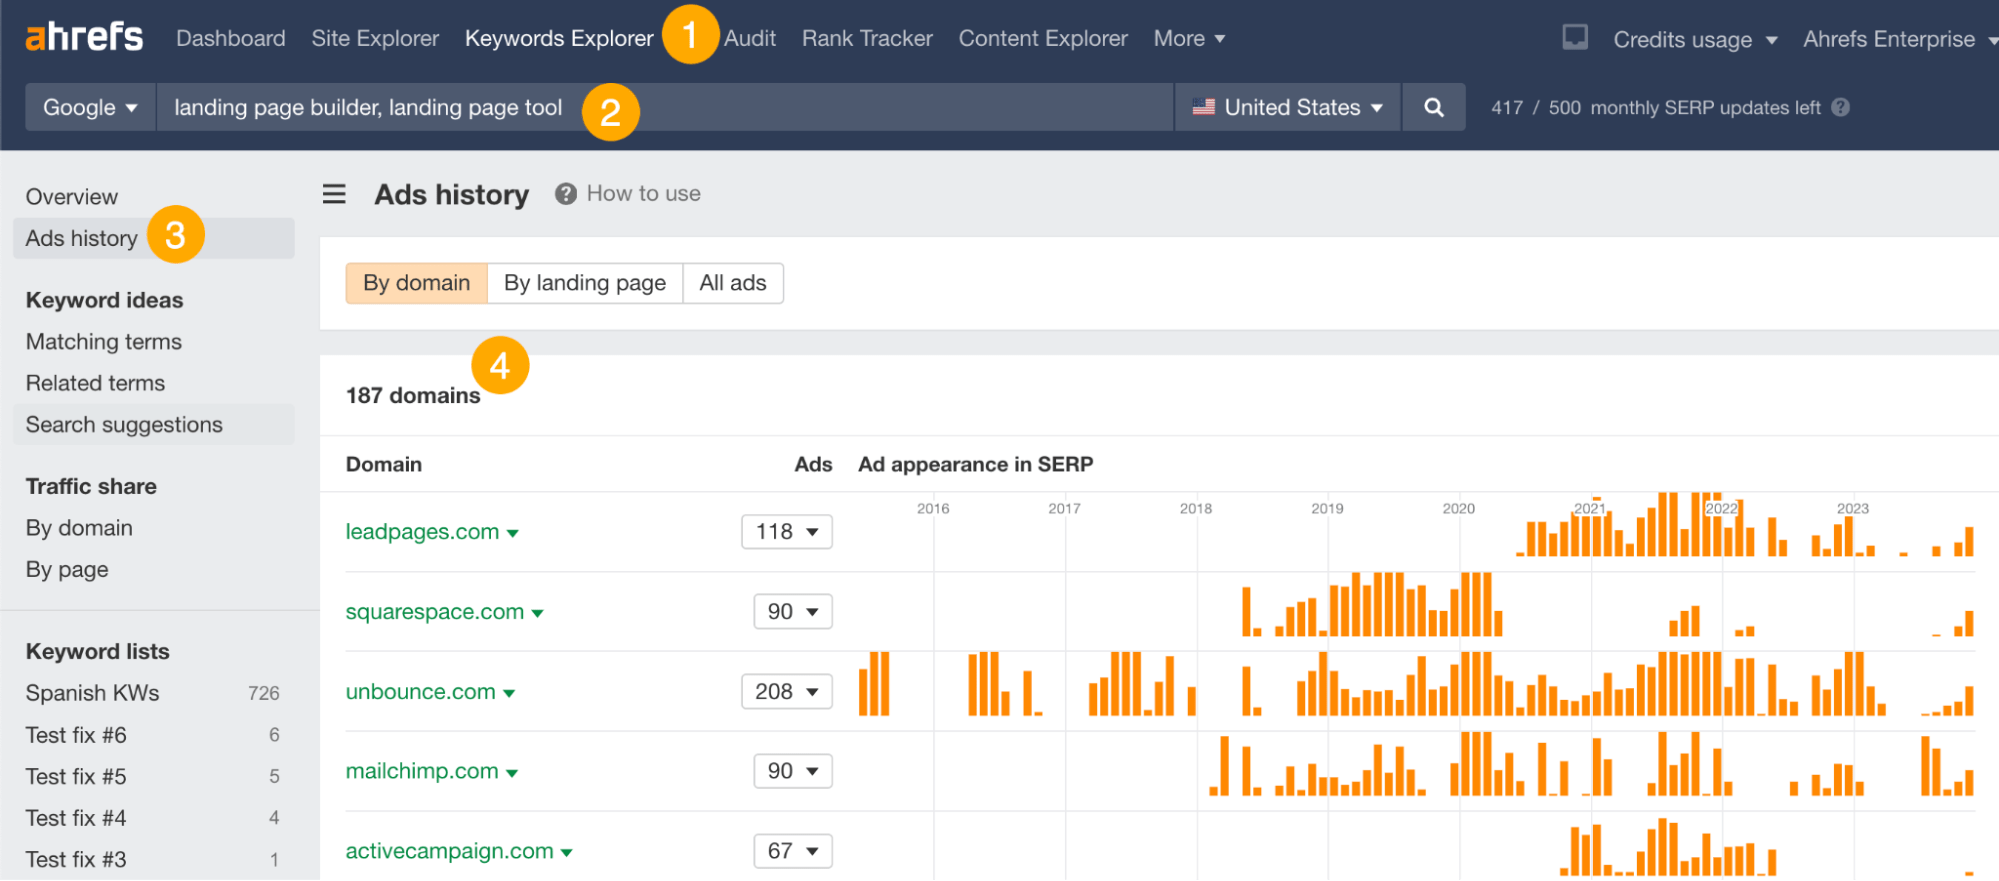
See who’s advertising
If someone is spending money to show ads for keywords related to what you do, that’s a strong indication they are a direct competitor.
- Go to Ahrefs’ Keywords Explorer.
- Type in a few broad keywords related to your niche, like “landing page builder” or “landing page tool”.
- Go to the Ads history report.
- Visit the sites that have a high presence of ads in the SERPs (Search Engine Result Pages).
Once you’re done checking both reports, write down competitors in the deck.
You can also take screenshots of the reports and add them to your deck to show the supporting data for your argument.
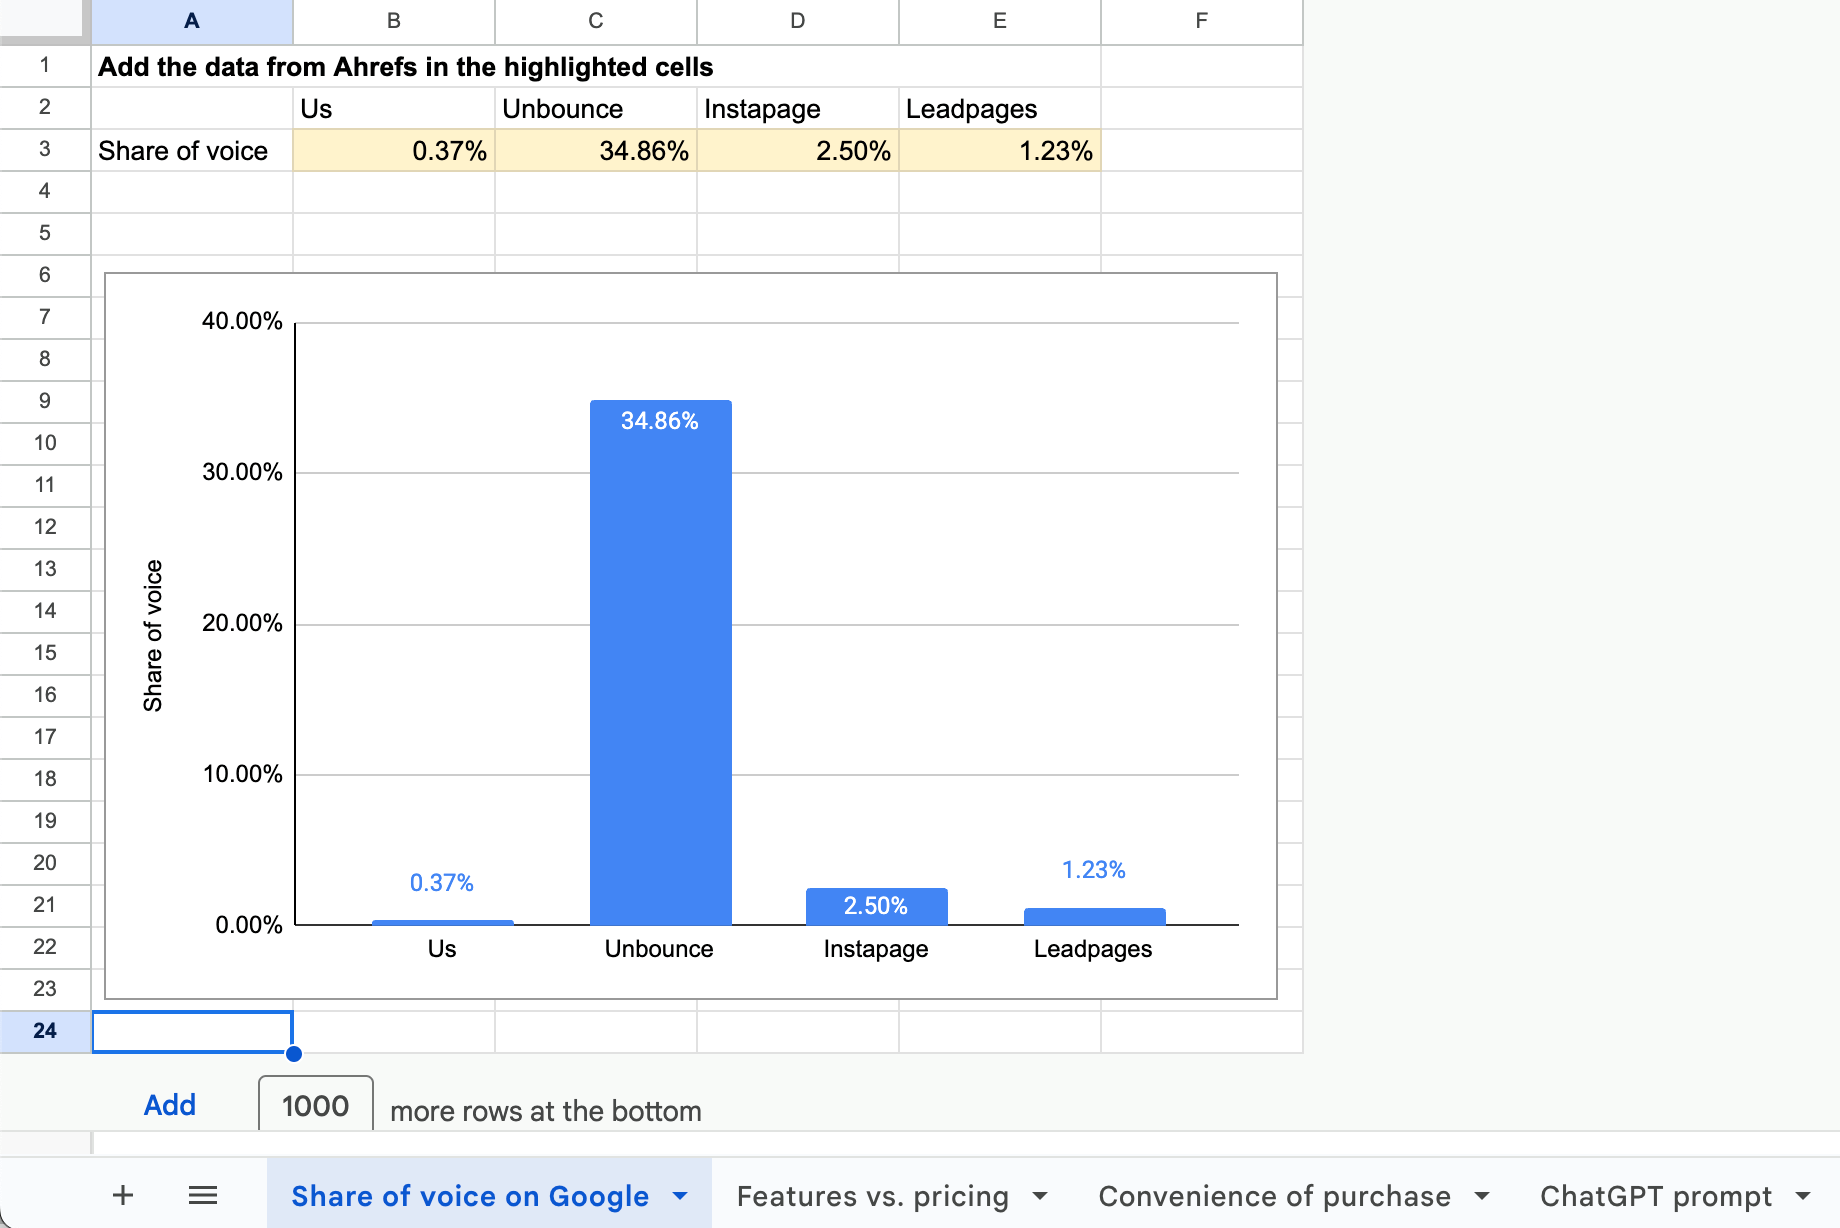
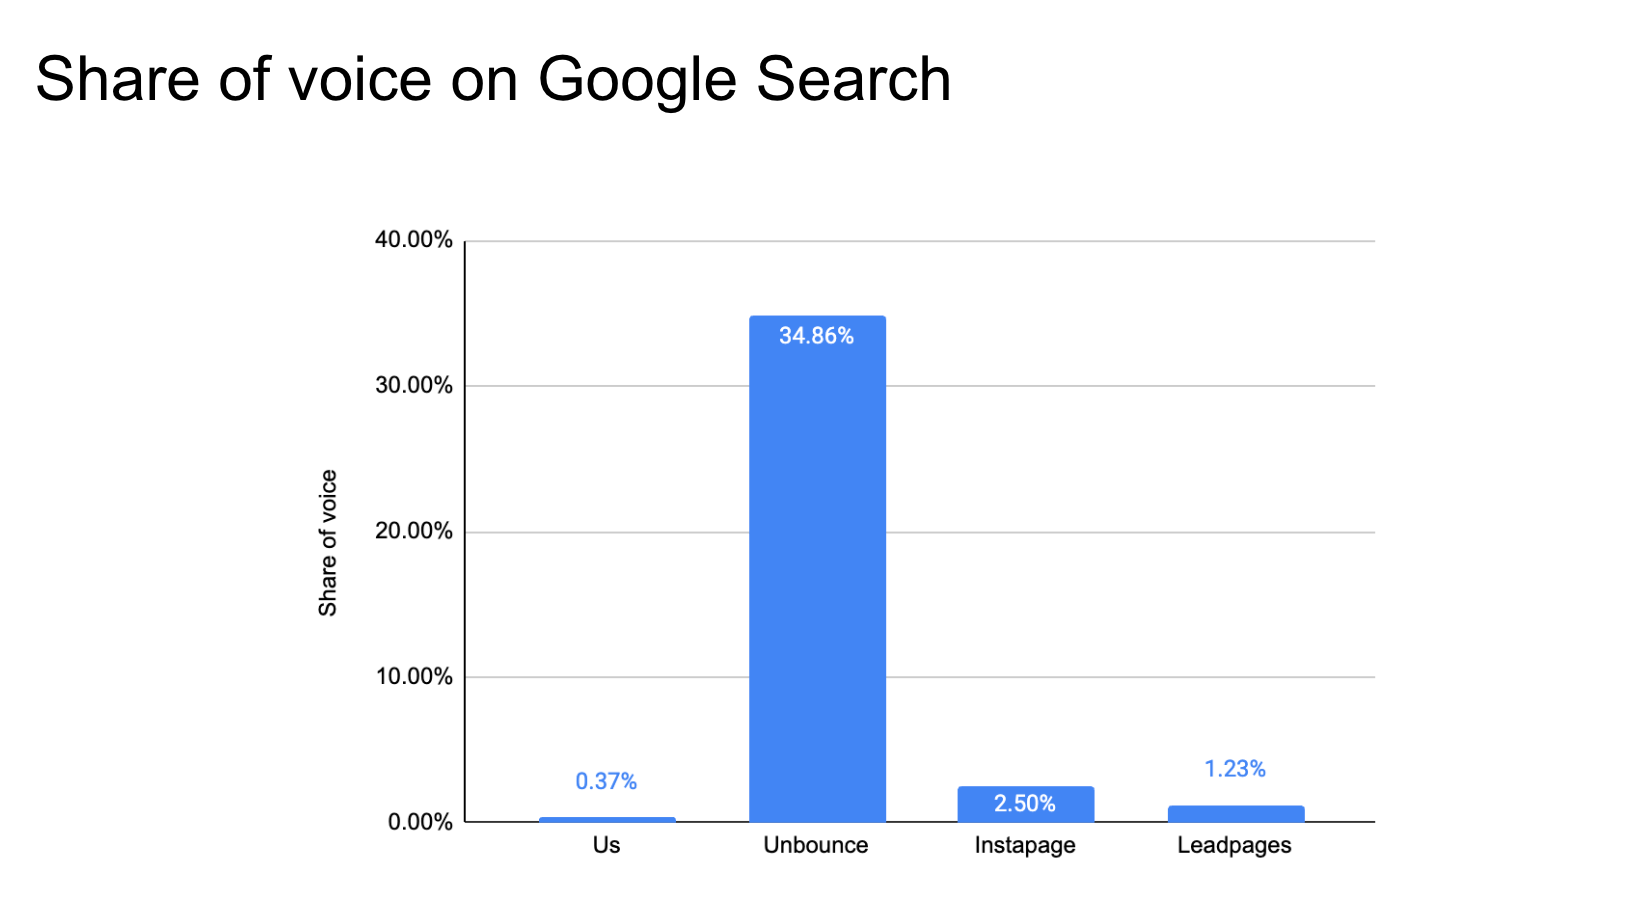
Share of voice is a measure of your reach in any given channel compared to competitors.
A bigger share of voice (SOV) means that your competitors are more likely to reach your audience. In other words, they may be promoting more effectively than you.
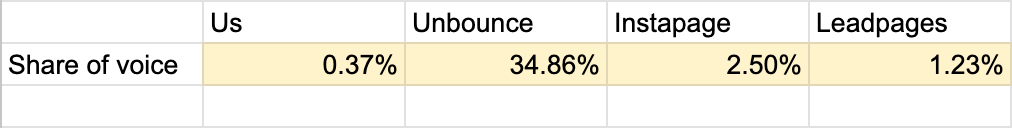
In our example, we found that Landingi’s SOV was the lowest in both of these channels.
Organic:
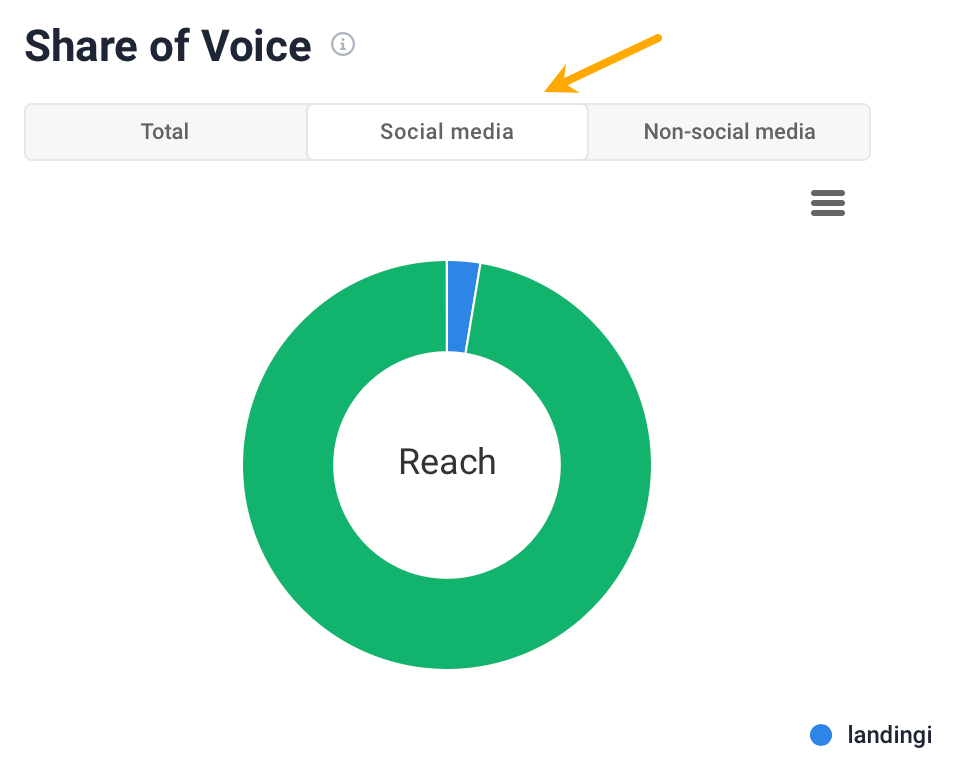
And social media:
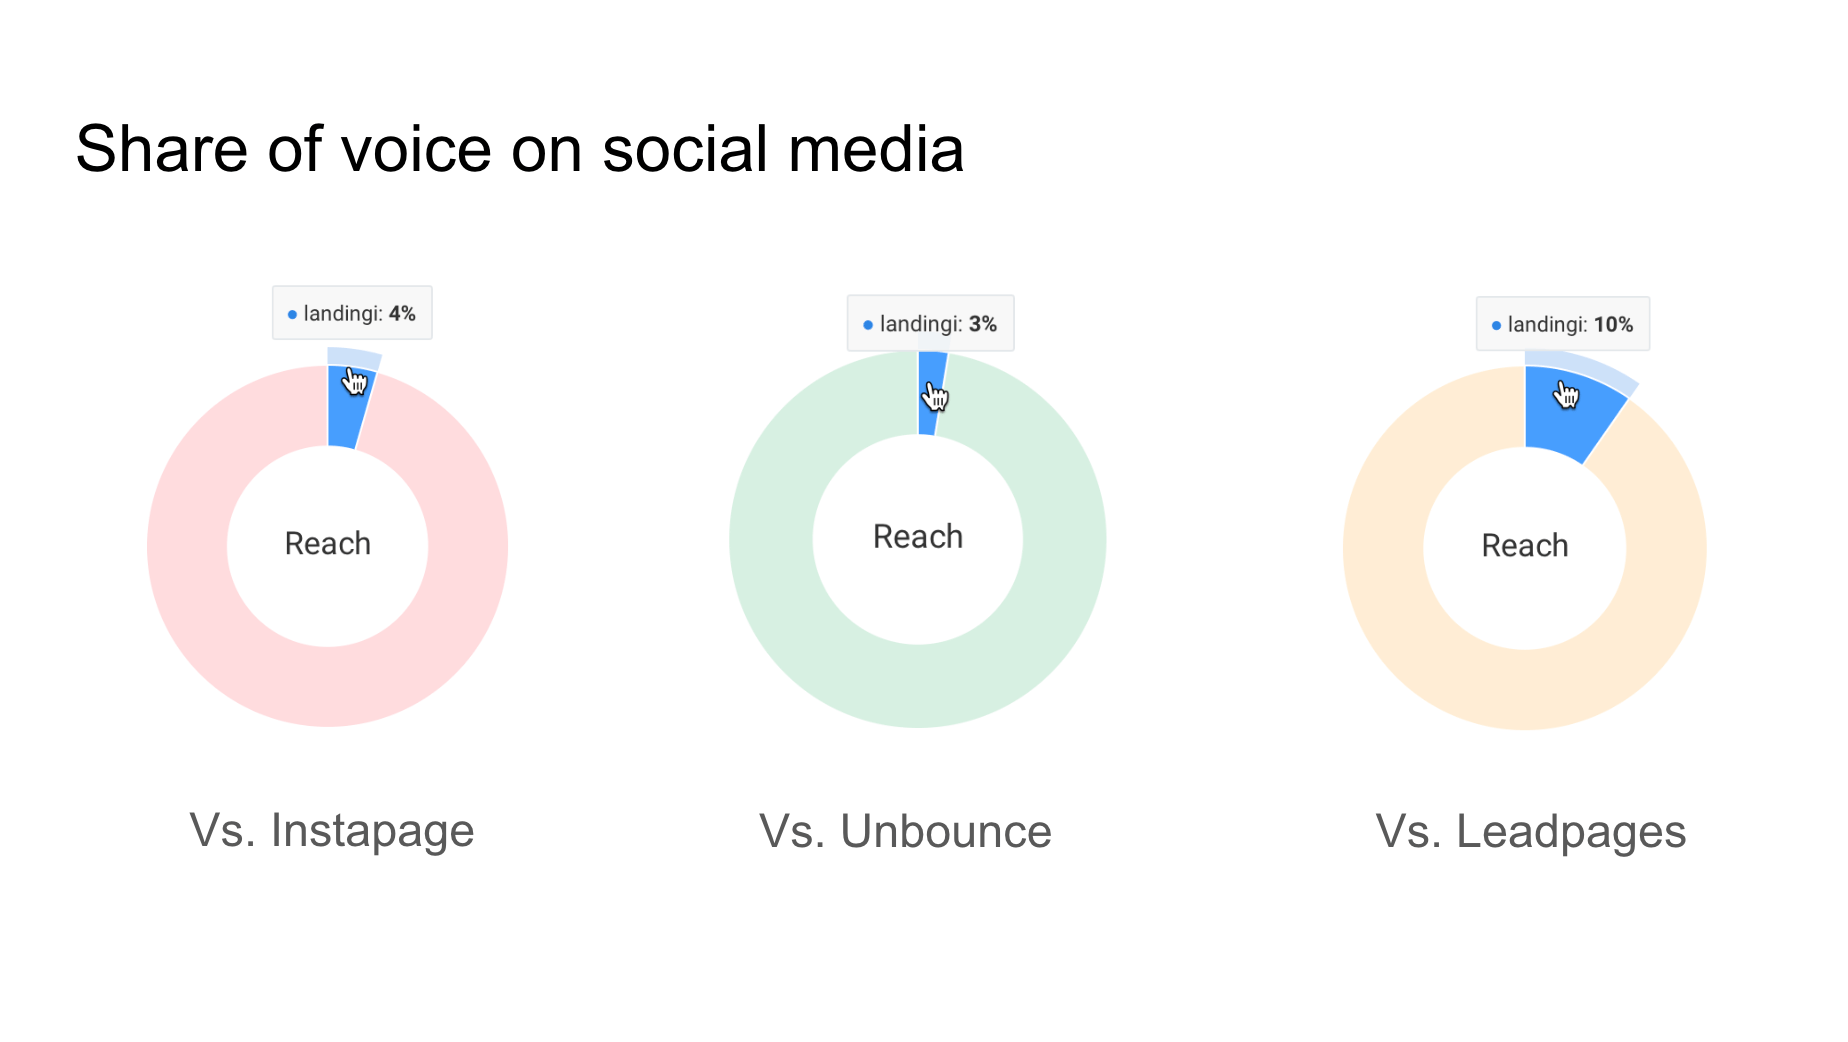
Here’s how we got that data using Ahrefs and Brand24.
Organic share of voice
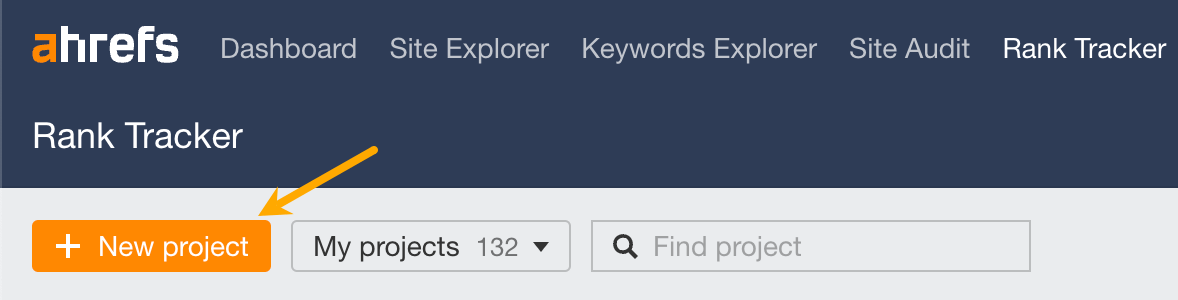
Before we start, make sure you have a project set up in Ahrefs’ Rank Tracker.
Now:
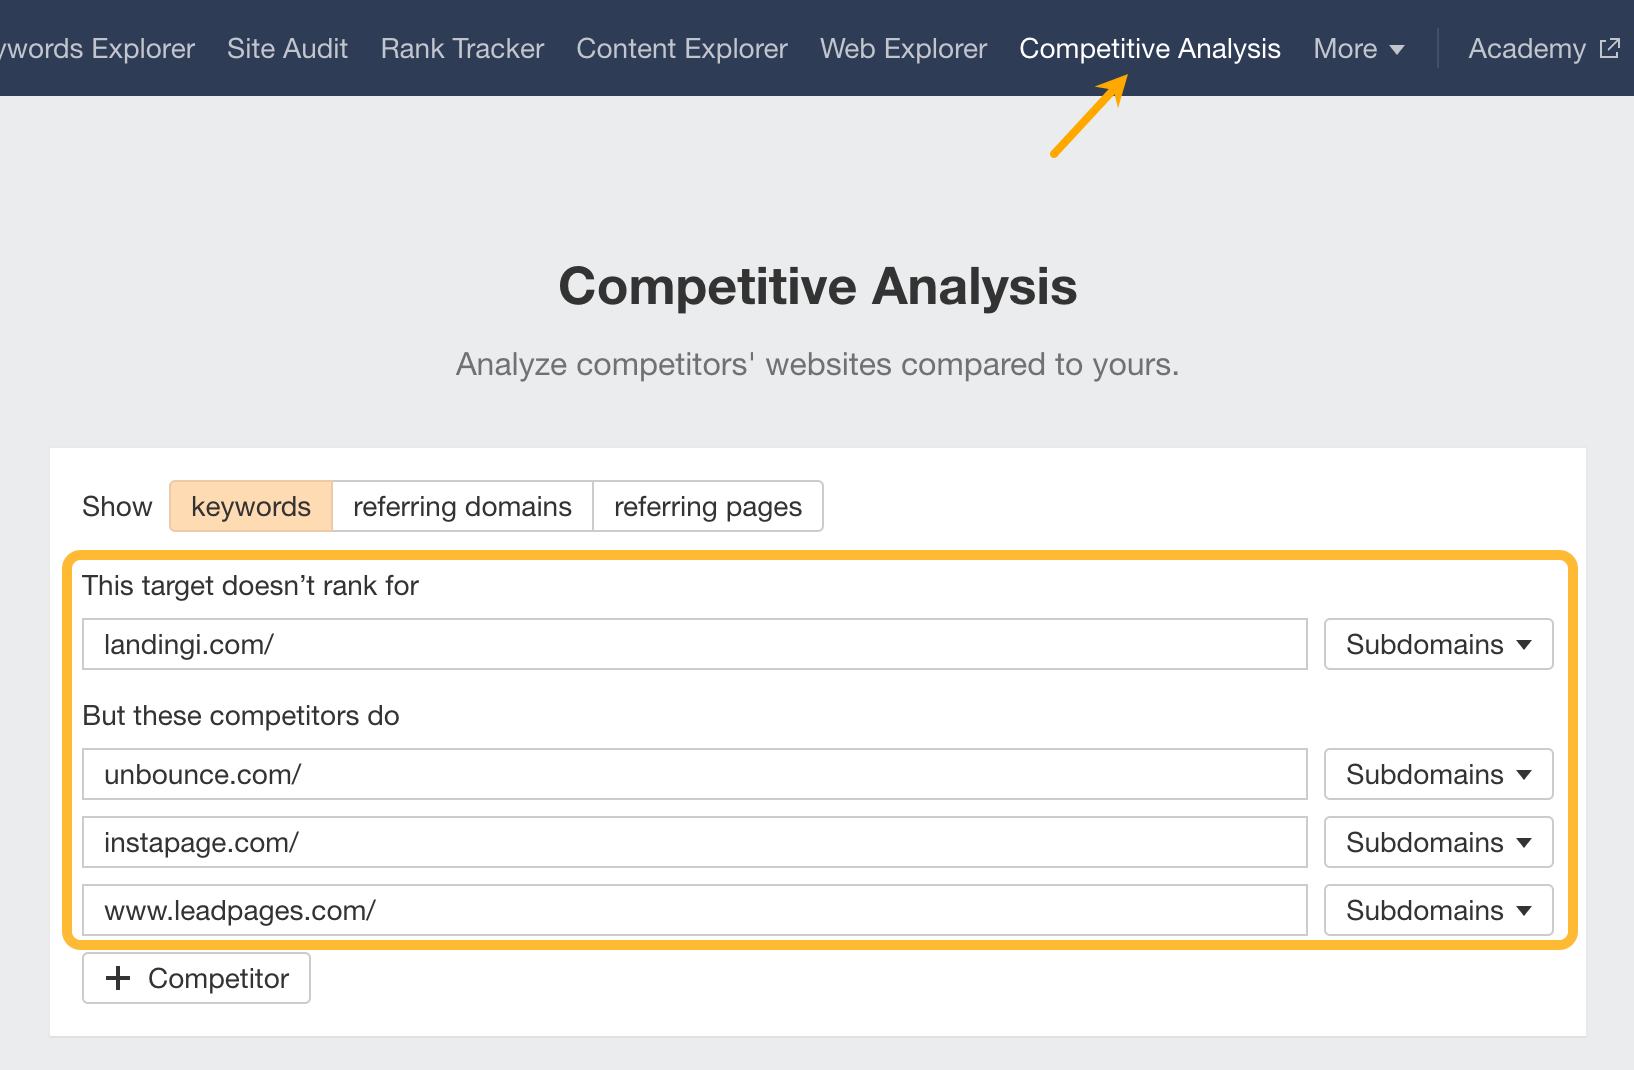
- Go to Ahrefs’ Competitive Analysis and enter your and your competitors’s sites as shown below.
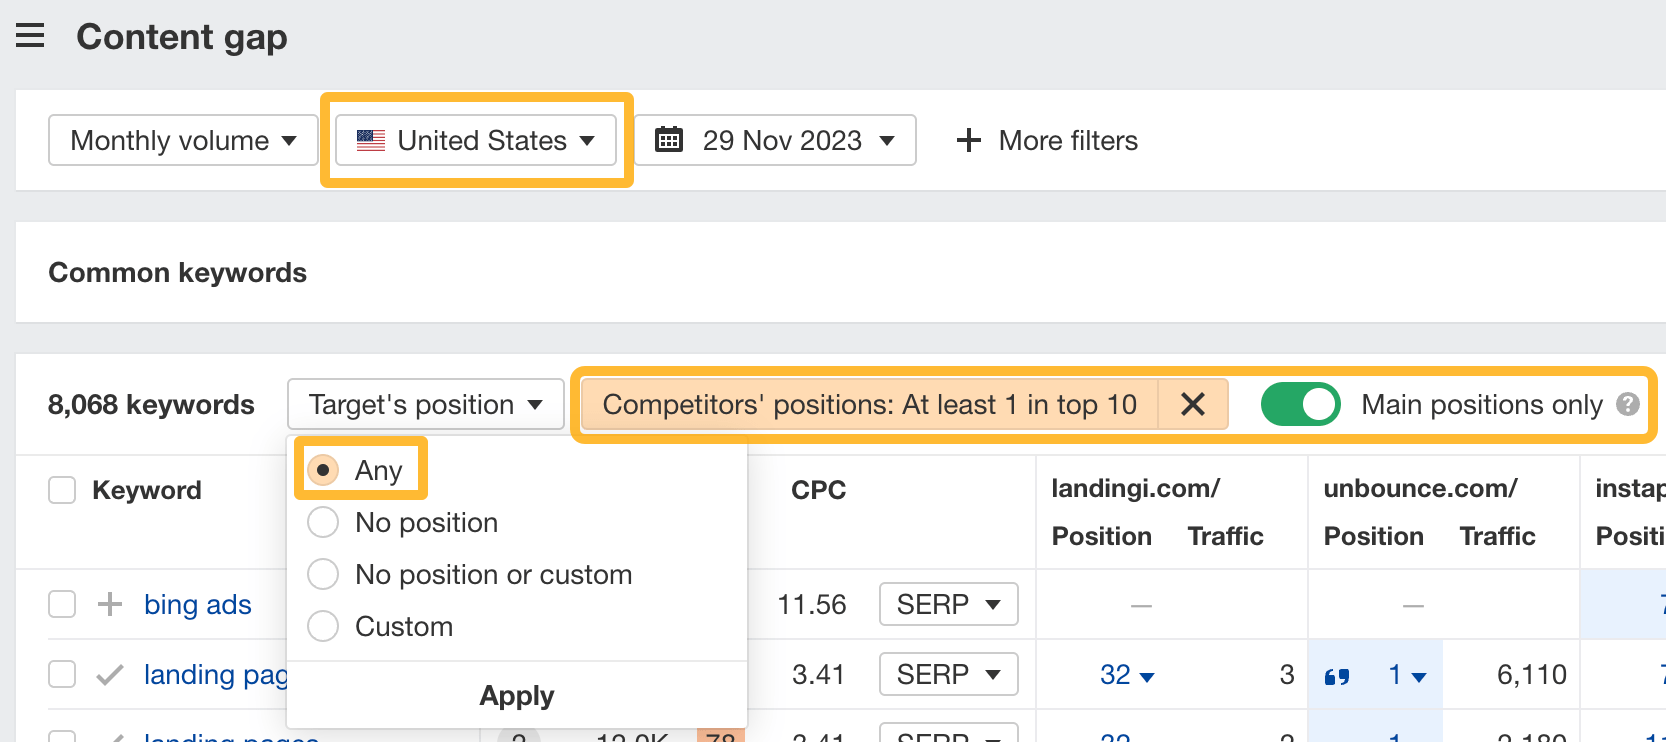
- On the next screen, set the country with the most important market for your business and set the filters like this:
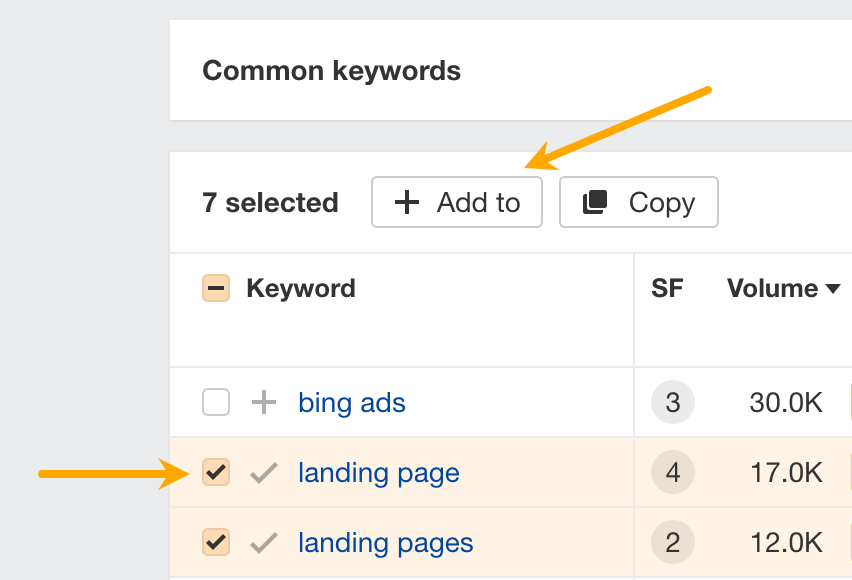
- Select keywords that sound most relevant to your business (even if you don’t rank for them yet) and Add them to Rank Tracker.
- Go to Rank Tracker, open your project, and look for Competitors/Overview. This report will uncover automatically calculated Share of Voice.
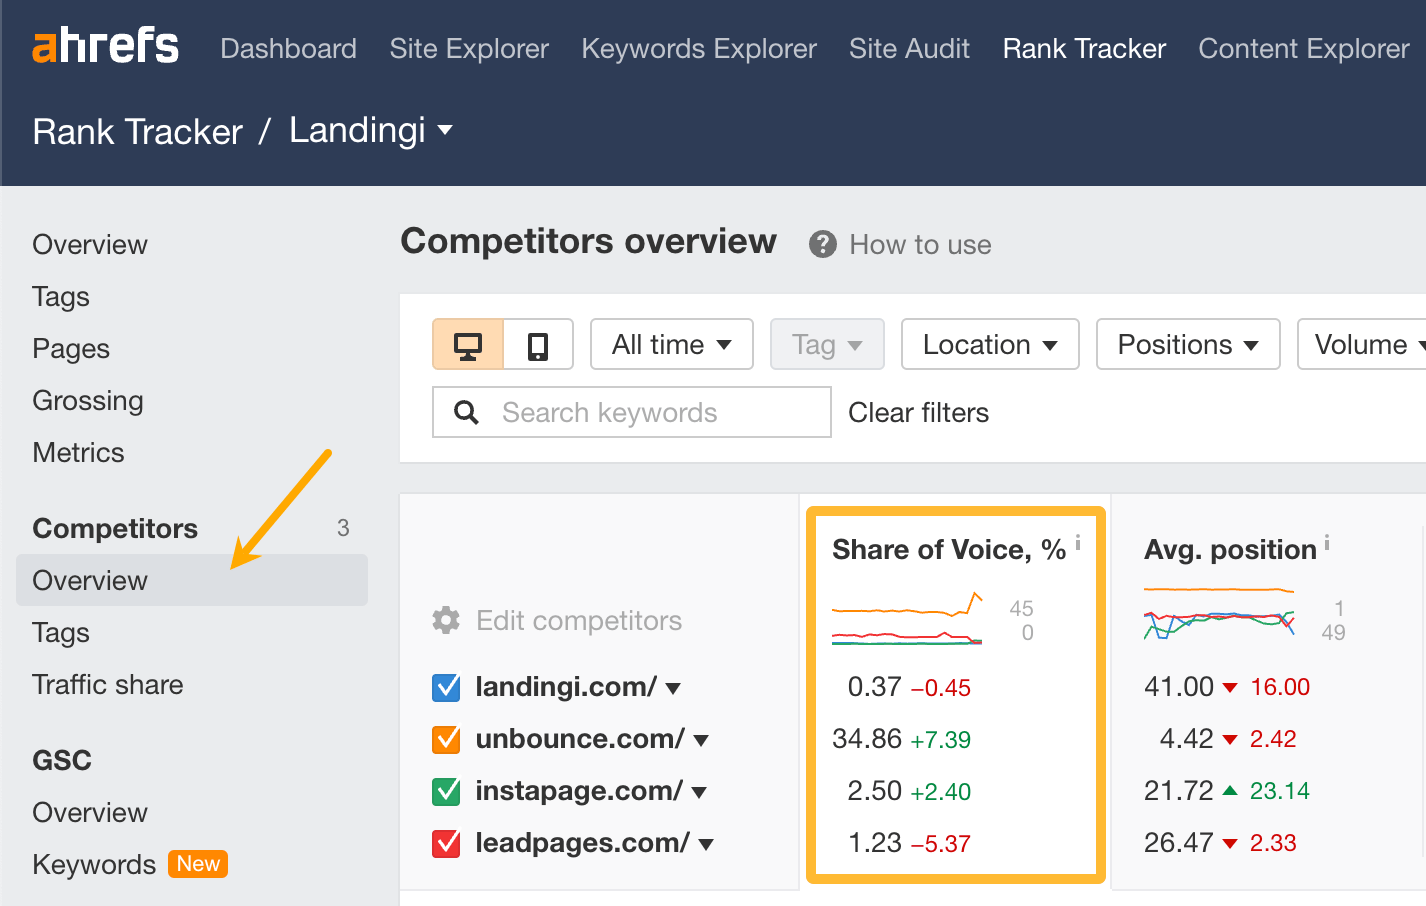
- Add the numbers in corresponding cells inside the sheet and paste the graph inside the slide deck.
It’s normal that the numbers don’t add up to 100%. SOV is calculated by including sites that compete with you in traffic but are not your direct competitors, e.g. blogs.
Social share of voice
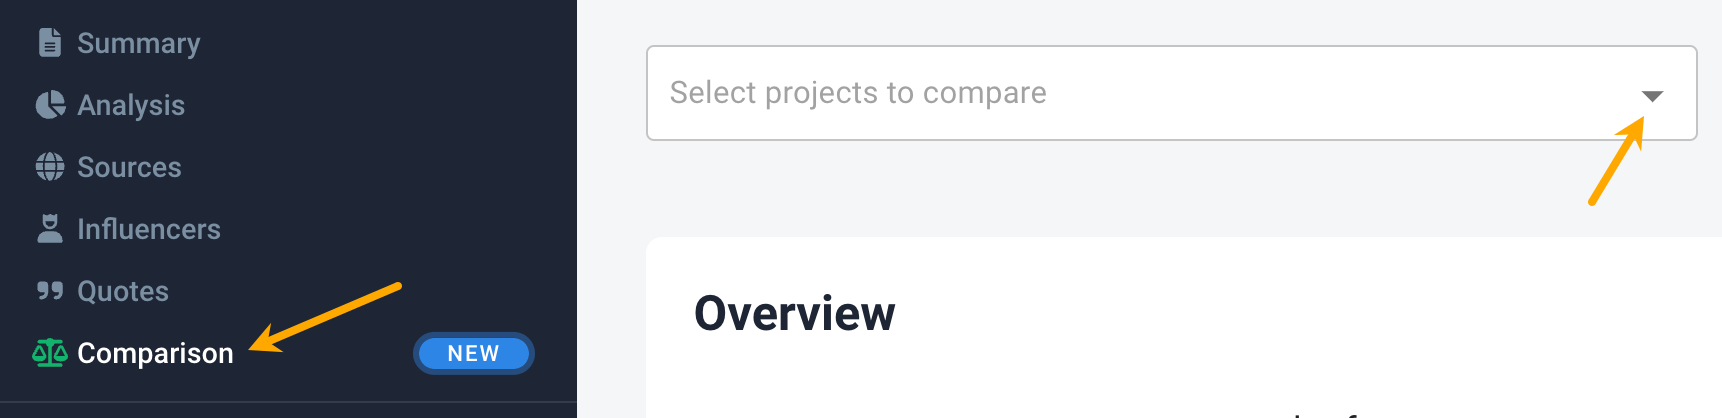
We can also measure our share of voice across social media channels using Brand24.
- Go to Brand24.
- Start a New project for your brand and each competitor. Use the competitors’ brand name as the keyword to monitor.
- Go to the Comparison report and compare your project with competitors.
- Take a screenshot of the SOV charts and paste them into the slide deck. Make sure the charts are set to “social media”.
Consumers often choose solutions that offer the best value for money — simple as that. And that typically comes down to two things:
- Whether you have the features they care about. We’ll use all features available across all plans to see how likely the product is to satisfy user needs.
- How much they will need to pay. Thing is, the topic of pricing is tricky: a) when assessing affordability, people often focus on the least expensive option available and use it as a benchmark, b) businesses in the SaaS niche offer custom plans. So to make things more practical, we’ll compare the cheapest plans, but feel free to run this analysis across all pricing tiers.
After comparing our example company to competitors, we found that it goes head-to-head with Unbounce as the most feature-rich solution on the market.
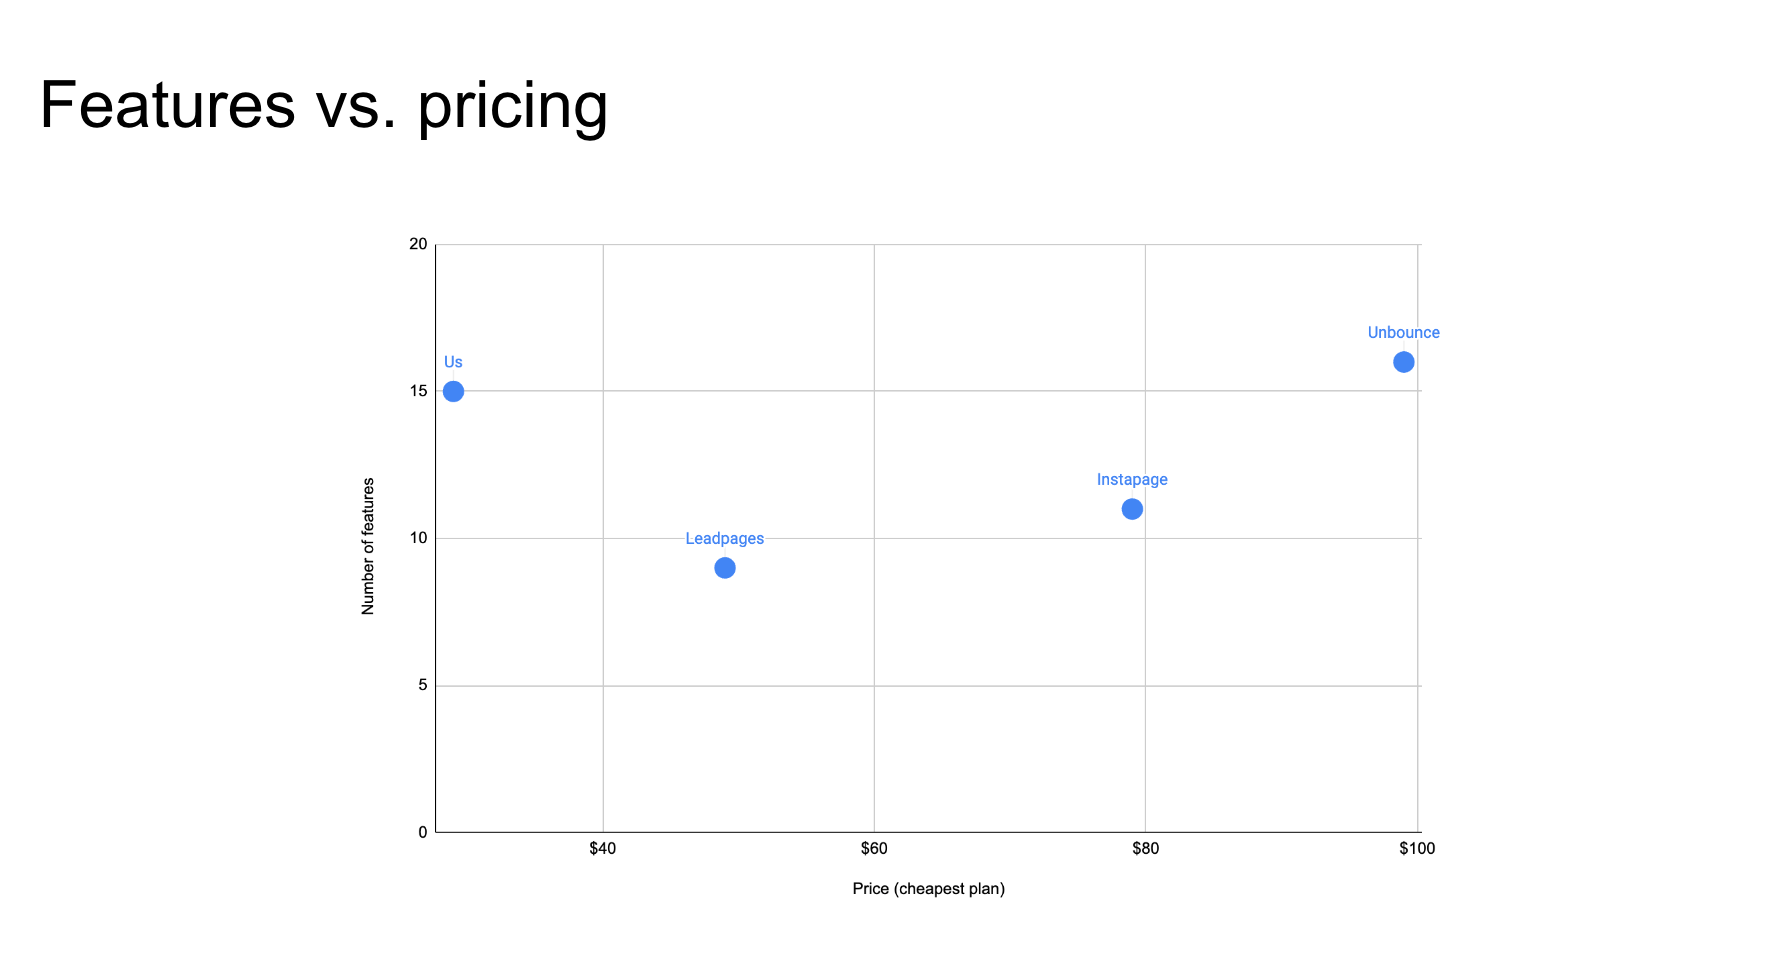
Here’s how we got that data.
- Note down your and your competitors’ product features. One of the best places to get this information is pricing pages. Some brands even publish their own competitor comparisons — you may find them helpful too.
- While making the list, place a “1” in the cell corresponding to the brand that offers the solution.
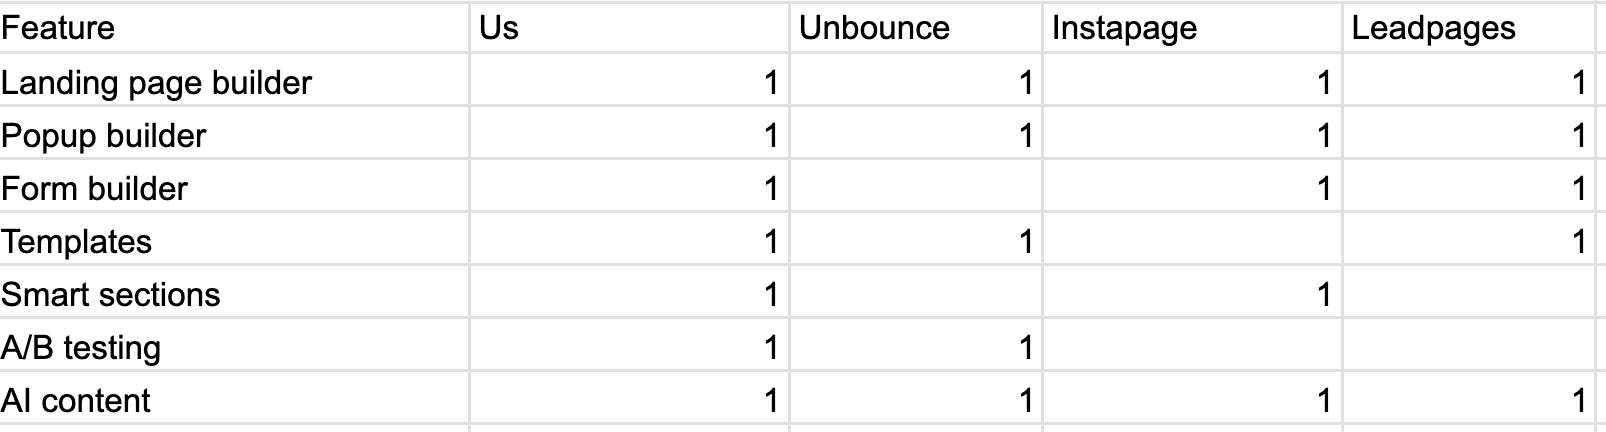
- Enter the price of the cheapest plan (excluding free plans).
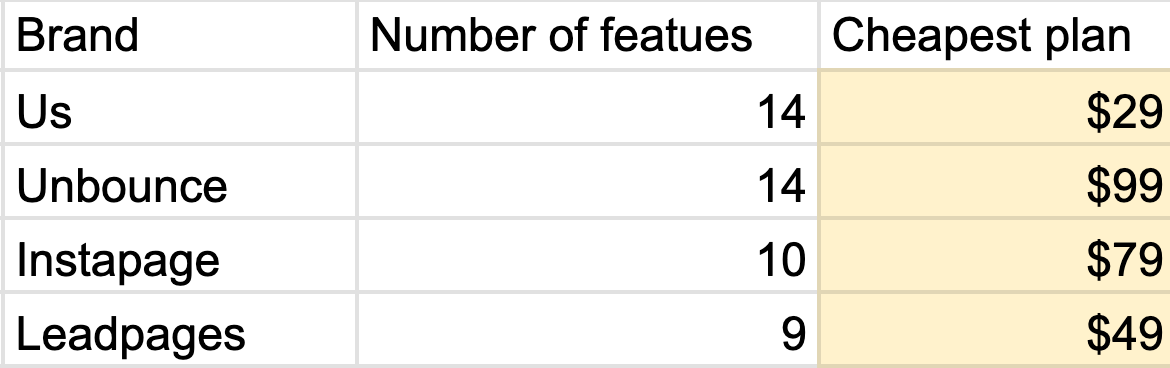
- Once finished, copy the chart and paste it inside the deck.
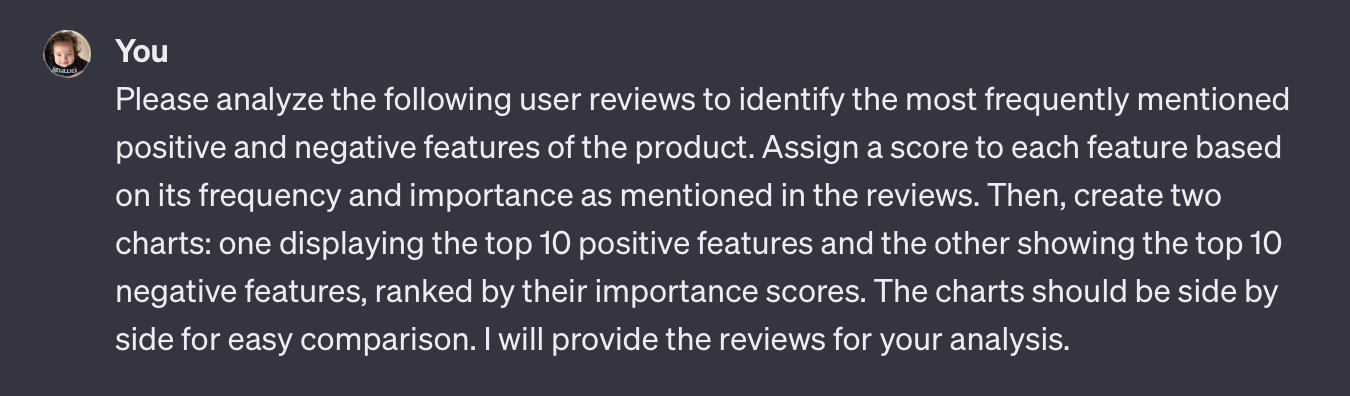
User reviews can show incredibly valuable insight into your competitors’ strong and weak points. Here’s why this matters:
- Improving on what your competitors’ customers appreciate could help you attract similar customers and possibly win some over.
- Dissatisfaction with competitors is a huge opportunity. Some businesses are built solely to fix what other companies can’t fix.
Here’s a sample from our analysis:
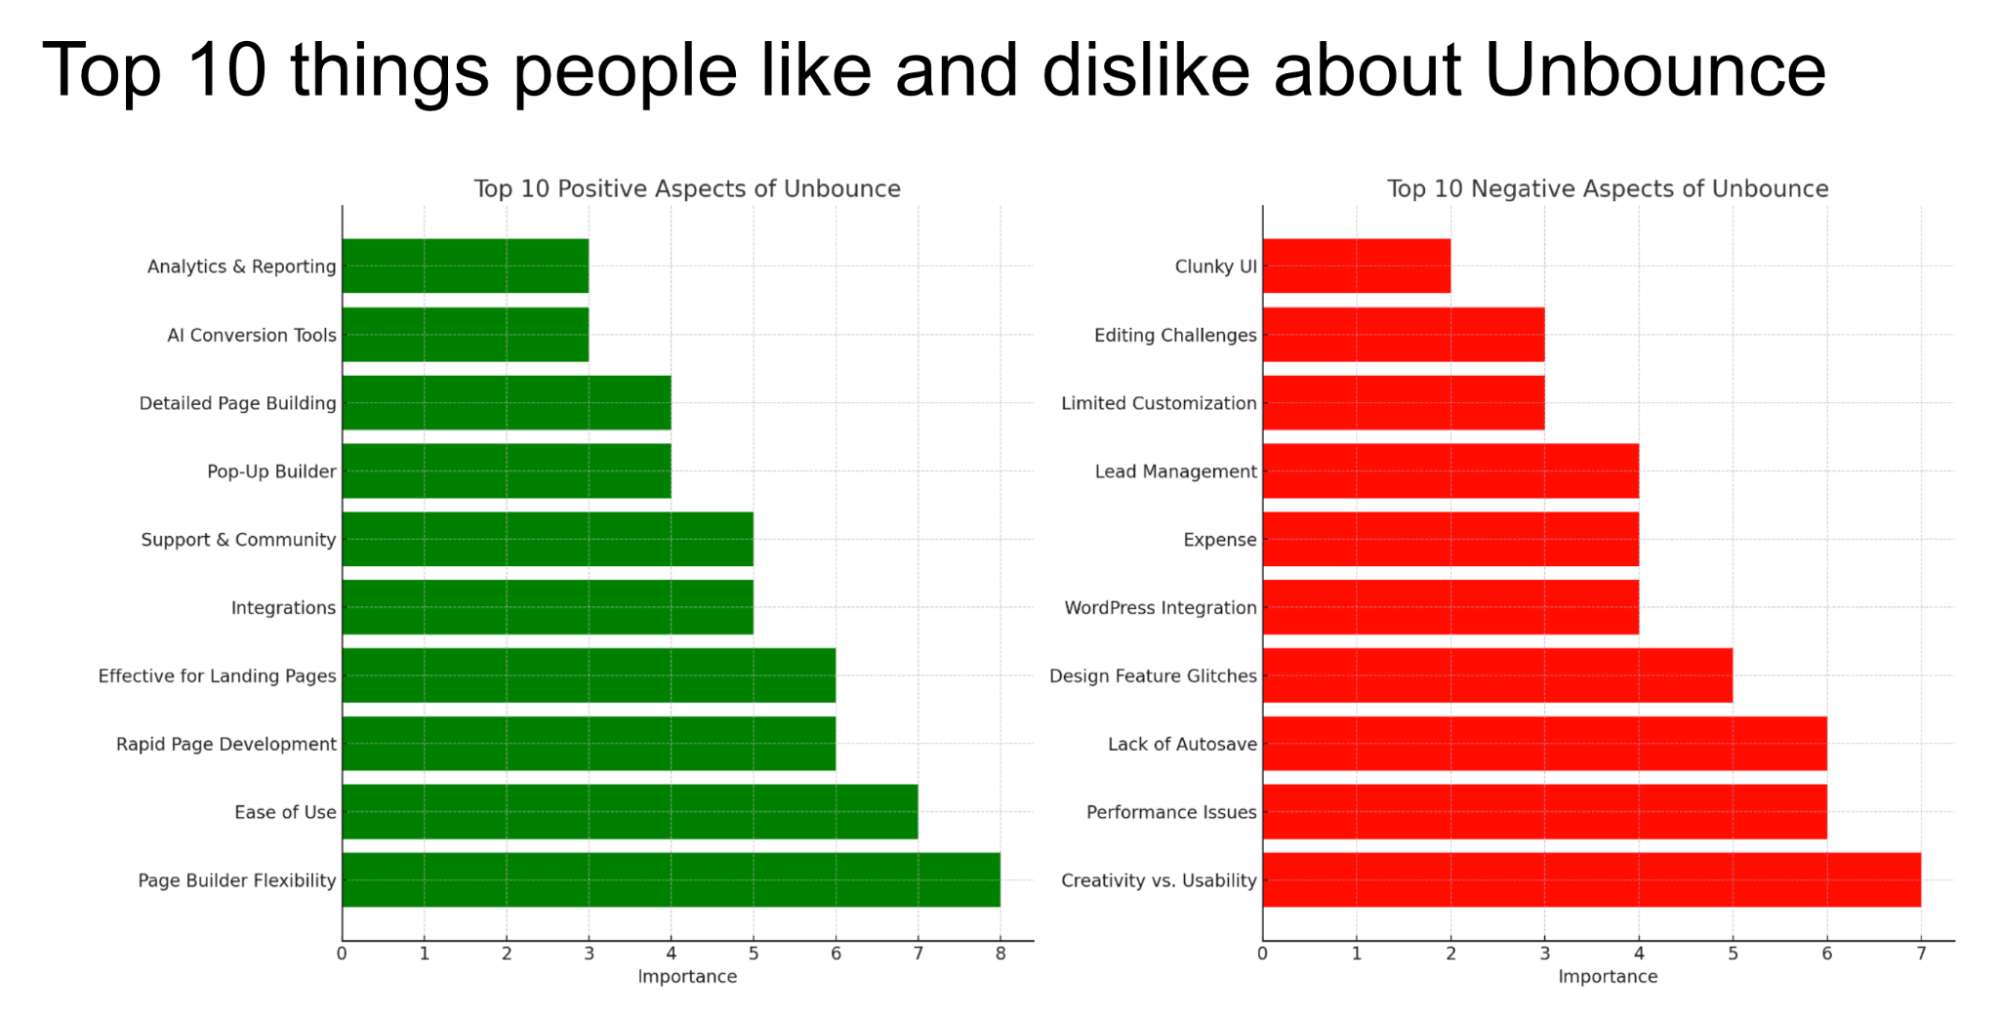
And here’s how we collated the data using ChatGPT. Important: repeat the process for each competitor.
- Open ChatGPT and enter the prompt from the template.
- Go to G2, Capterra, or Trustpilot and find a competitor’s reviews with ratings from 2 – 4 (i.e. one rating above the lowest and one below the highest possible). Reason:
businesses sometimes solicit five-star reviews, whereas dissatisfied customers tend to leave one-star reviews in a moment of frustration. The most actionable feedback usually comes in between.
- Copy and paste the content of the reviews into ChatGPT (don’t hit enter yet).
- Once you’re done pasting all reviews, hit enter in ChatGPT to run the analysis.
- Paste the graphs into the deck. If you want the graphs to look different, don’t hesitate to ask the AI.
There’s a faster alternative, but it’s a bit more advanced.
Instead of copy-pasting, you can use a scraping tool like this one to get all reviews at once. The downside here is that not all review sources will have a scraping tool available.
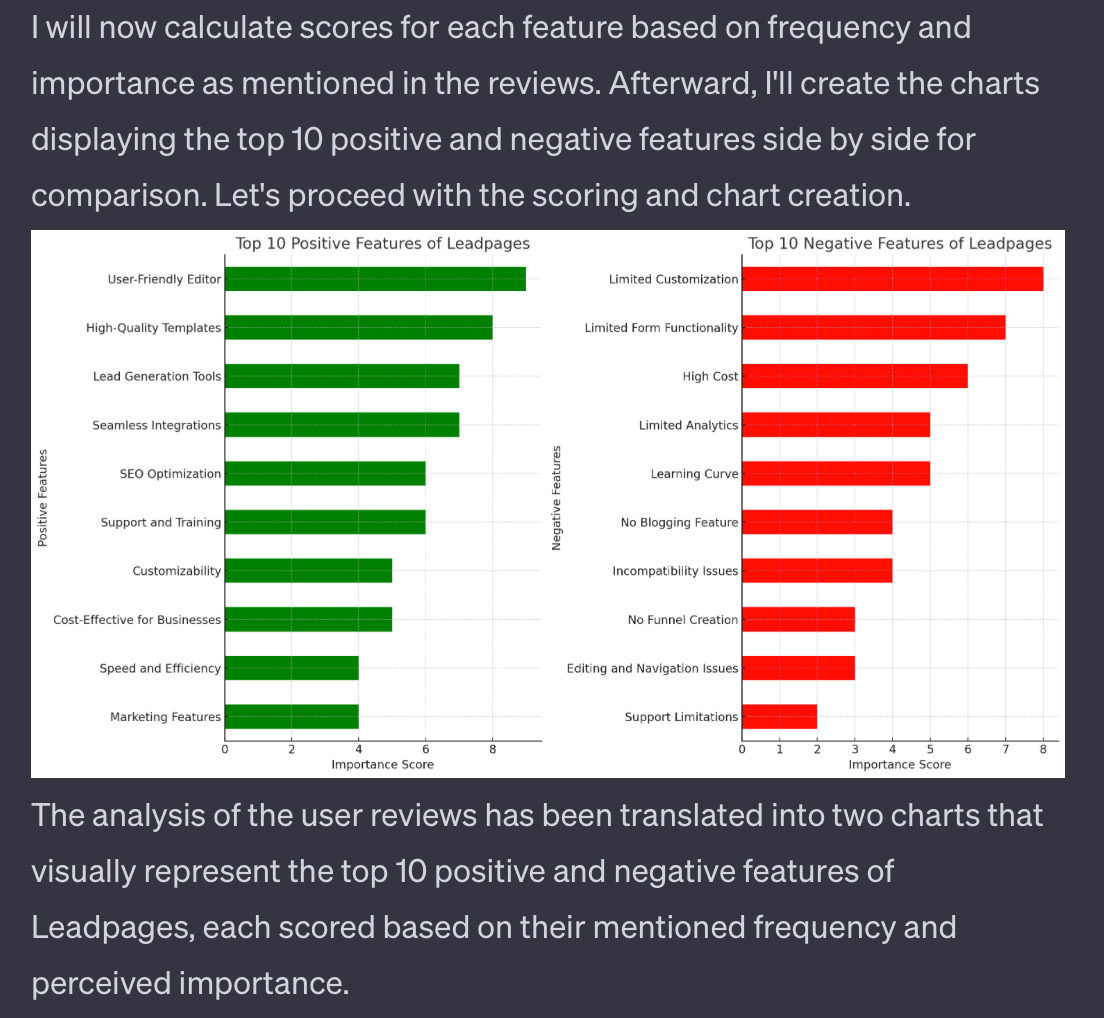
Lastly, we’ll see how easy it is to actually buy your products, and compare the experience to your competitors.
This is a chance to simplify your checkout process, and even learn from any good habits your competitors have adopted.
For example, we found that our sample company had probably nothing to worry about in this area — they ticked almost all of the boxes.
Here’s how to complete this step:
- Place a “1” if you or any of your competitors offer convenience features listed in the template.
- Once done, copy the chart and paste it into the deck.
This is the part of the presentation where you sum up all of your findings and suggest a course of action.
Here are two examples:
- Landingi had the lowest SOV in the niche, and that is never good. So the conclusion might be to go a level deeper and do an SEO competitive analysis, and to increase social media presence by creating more share-worthy content like industry surveys, design/CRO tips, or in-house data studies.
- Although the brand had a very high purchasing convenience score, during the analysis we found that there was a $850 gap between the monthly full plan and the previous tier. The conclusion here might be to offer a custom plan (like competitors do) to fill that gap.
We encourage you to take your time here and think about what would make the most sense for your business.
Final thoughts
A competitive analysis is one of the most fruitful exercises in marketing. It can show you areas for improvement, give ideas for new features, and help you discover gaps in your strategy. It wouldn’t be an exaggeration to say that it’s fundamental to running a successful business.
Just don’t forget to balance “spying” on your competitors with innovation. After all, you probably don’t want to become an exact copy of someone else’s brand.
In other words, use competitive analysis to keep up with your competitors, but don’t let that erase what’s unique about your brand or make you forget your big vision.
Got comments or questions? Ping me on X.