
That’s because you can’t make rational decisions without knowing which of your SEO efforts are (and aren’t) contributing to your SEO goals.
In this guide, you’ll learn how to solve this problem using SEO analytics.
SEO analytics is the process of collecting and analyzing raw data to better inform your search engine optimization efforts. It helps you to prioritize tasks, get approval for SEO campaigns, and make better decisions to improve SEO.
It does not matter whether you’re optimizing a personal blog while learning the ropes or consulting on an enterprise SaaS. All marketers will benefit from the information gained in SEO analysis because data eliminates much of the guesswork for developing goals and strategies.
Here are just a handful of questions SEO analytics can answer:
- Which marketing efforts bring in the most valuable traffic?
- What content do users engage with the most?
- Where do my best customers come from?
- What is the competition doing?
- How do I get more backlinks?
- Where are we losing money?
- How do we increase sales?
Every company will find value in different data points. So although I can’t tell you precisely what data points to focus on, I can outline an overall approach to SEO analytics that’s applicable to pretty much every company.
Step 1. Plan your work
You can easily get lost in the rabbit hole of analysis and lose sight of the end goal. So the first step is to ask the question, “What do I want to know?”
From here, you can map out what tools you will need and what reports to pull.
Don’t be tempted to skip this step. Good planning is the key to smooth data analysis projects. If you jump ahead, you’ll only create more work for yourself and miss out on important insights.
Step 2. Set up the right measurement tools
Now that you know what you need data for, the next step is to set up the measurement tools that will collect the data.
Since we’re trying to rank on Google, we need to set up tools that provide insights into our Google search presence and keyword rankings. There are lots of tools, both free and paid, but there are three that we recommend setting up as a starting point.
Google Search Console
Google Search Console (GSC) provides data to help understand what is happening in Google’s search results.
Think of GSC as your window into the search engine results page (SERP). You will get insights into how your content is doing, index coverage issues, and page experience.
Here’s how to set that up:
- Go to Google Search Console
- Click Start now
- Select Add property on the dropdown
- Enter domain or URL prefix
- Choose a verification method
Google Analytics
Google Analytics (GA) is your window into on-site user behavior. It tells you what organic users do once they land on your website, how engaged they are, what they click on, and how many leads (or sales) they generate.
Here’s a quick step-by-step process for setting up Google Analytics:
- Go to analytics.google.com
- Click Start measuring
- Enter an account name, then click Next
- Enter a property name, then click Next
- Click Show advanced options
- Toggle the option to Create a Universal Analytics property
- Enter Website URL, then click Next
- Click Create
- Add the GA tag to your website
It’s important to note that Google Analytics products are not retroactive. Meaning, it can’t tell you what has happened, only what happens once the tracking tag is in place.
Depending on your time to conversion and product seasonality, you may need to wait before meaningful analysis can be done. So the sooner you get these tools in place, the better.
Ahrefs Web Analytics is a simple Google Analytics alternative. Fast, privacy-friendly, and free for up to 1 million events per month per site.
Ahrefs
It’s undeniable that Google’s free tools are an incredible free resource for SEOs, but they were never meant to do everything. There are a few instances where you will need to invest in reliable software to help collect data—like Ahrefs.
Here’s how to set up a new project:
- Go to App.Ahrefs.com
- Click + New Project
- Choose to Import from GSC or Add manually
- Enter scope
- Verify ownership
- Schedule site audits
- Add keywords to track
- Add competitors to analyze
Step 3. Set up dashboards and reports
Now that you have set up your measurement tools, you will need to visualize the information in a way that is easy to understand and act on.
Most of the SEO tools mentioned above already have a bunch of pre-made reports.
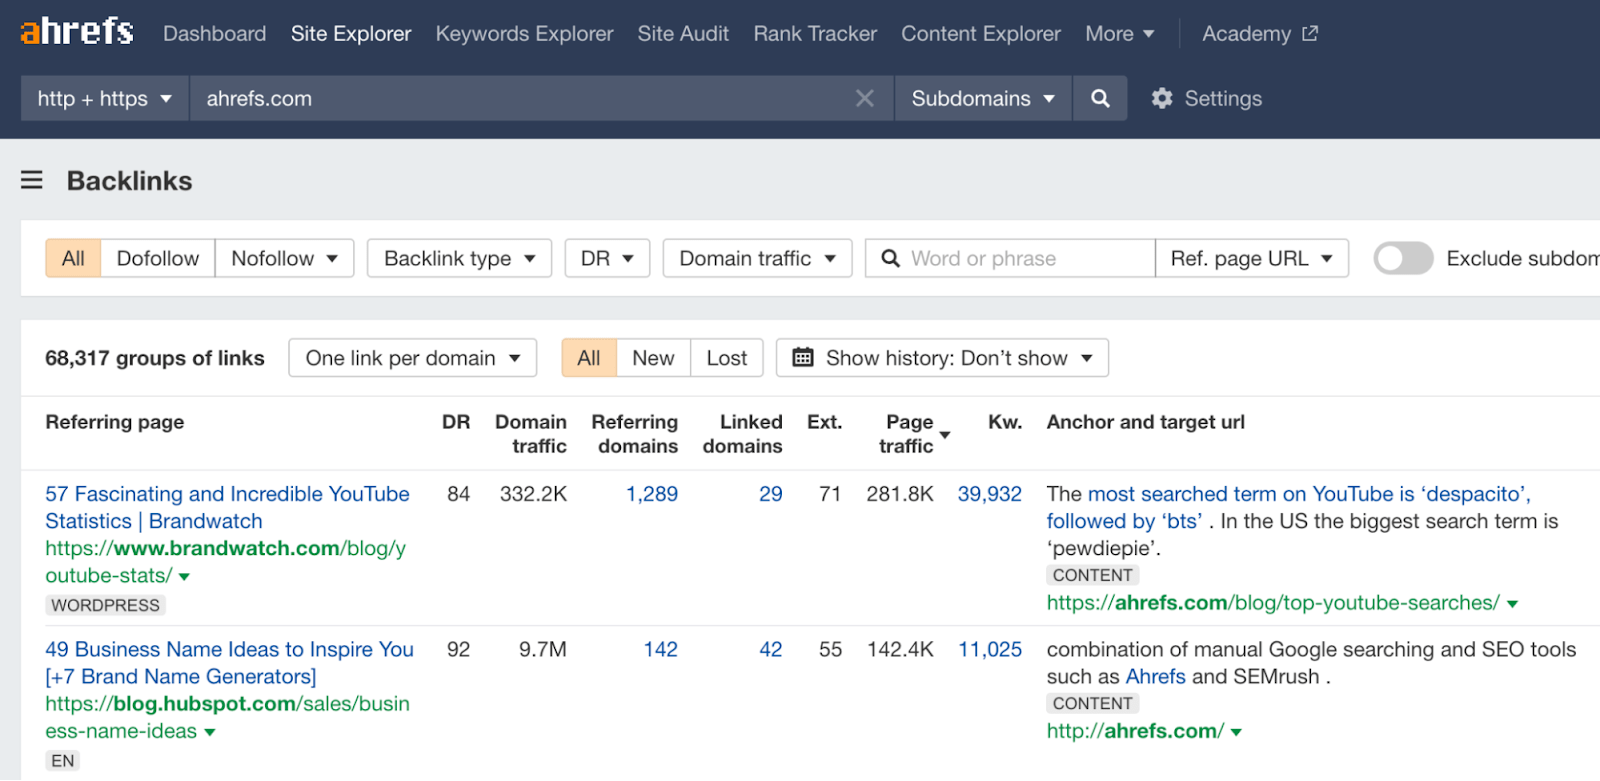
For example, the Backlinks report in Site Explorer shows you who’s linking to your website, where they’re linking from, and the anchor text they use:
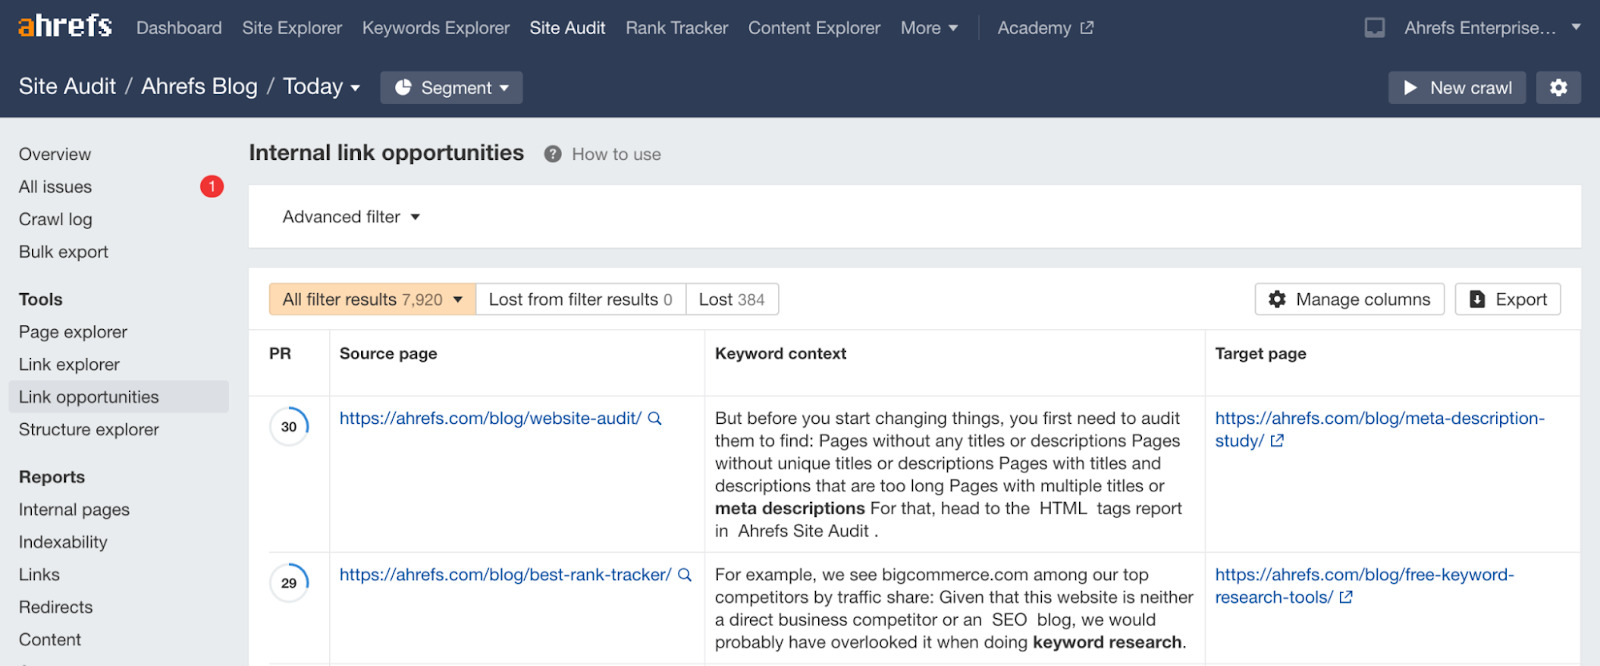
The Link opportunities report in Site Audit tells you about missed internal link opportunities:
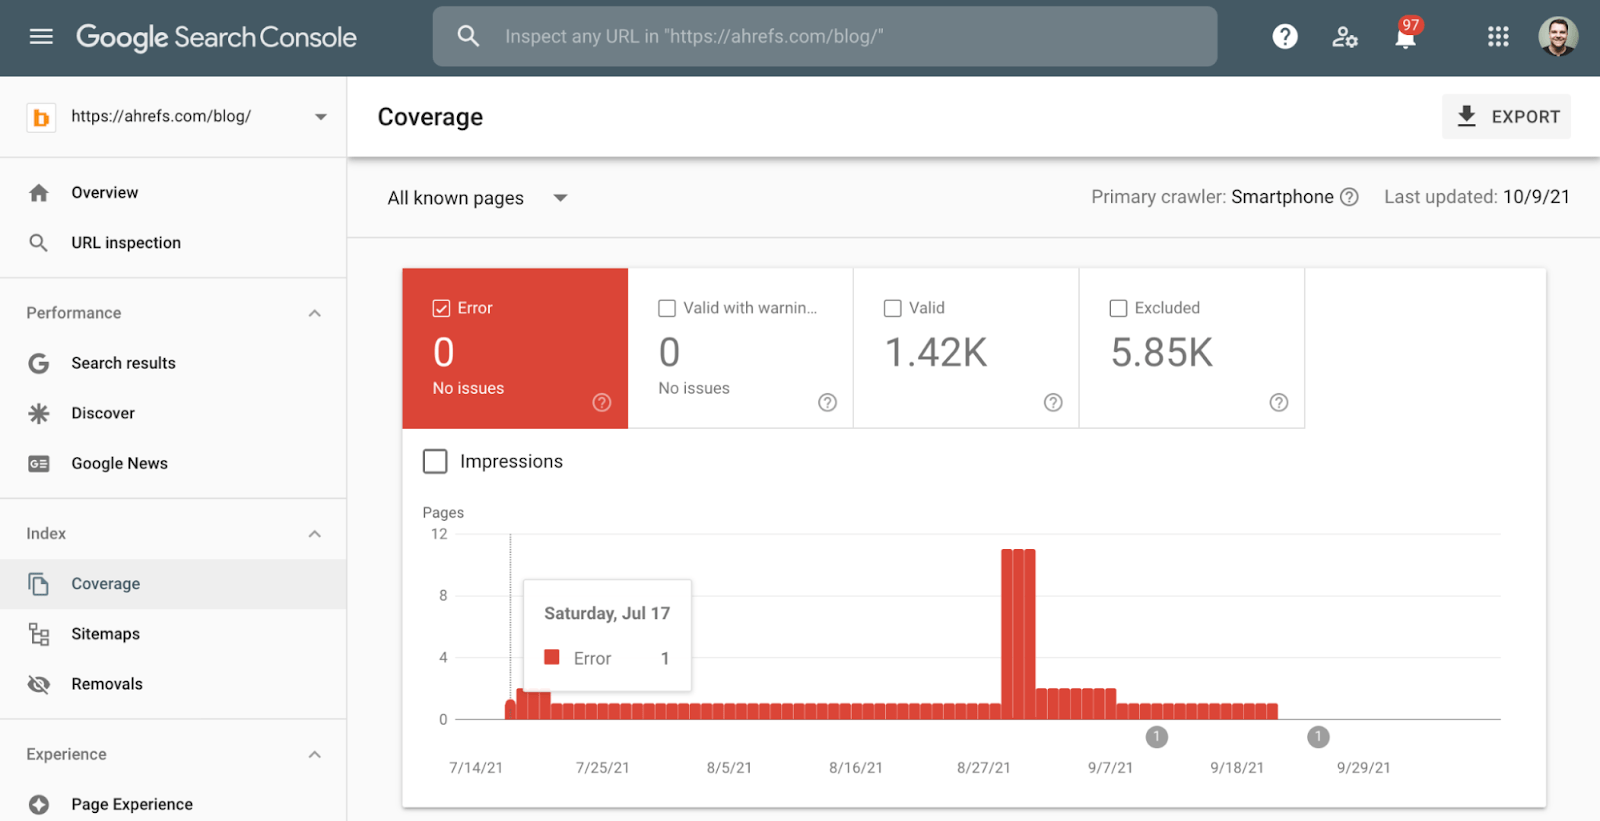
And the Coverage report in Google Search Console tells you about issues affecting your site’s presence in Google search:
Reports like these are super useful and insightful and offer a great starting point for SEO analytics. But there are many instances where you’ll need to create custom reports and dashboards so that you can see the data more clearly.
You can’t really do this in Search Console, but you can customize a lot in Google Analytics. You can also use the advanced filters in Site Audit to pinpoint pretty much any issue you like.
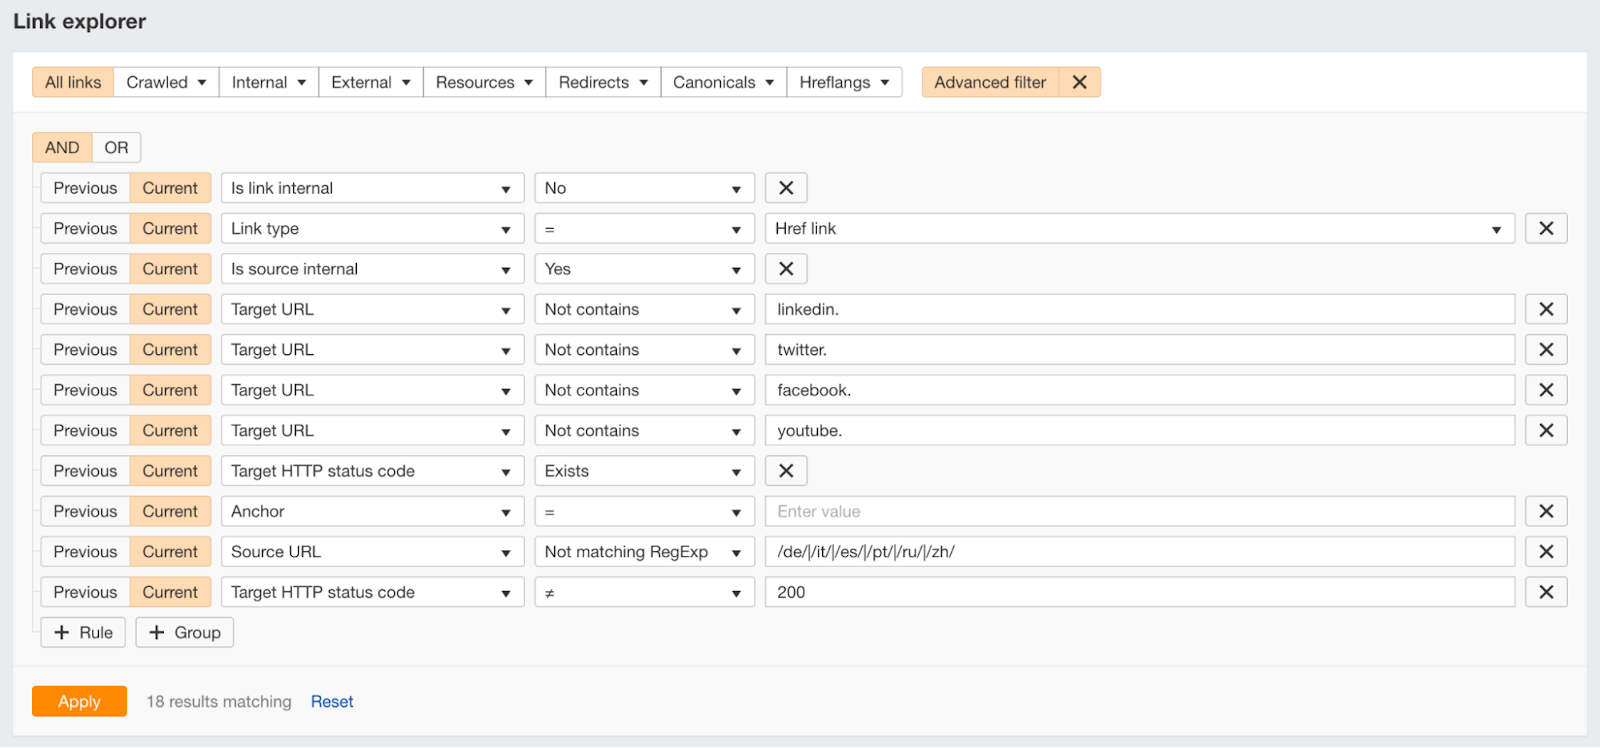
For example, this hyper-specific set of filters effectively creates a report that allows us to keep an eye on broken or redirected bio links on our blog:
But still, if you’re working with data from multiple sources, what you ideally want is a dashboard that pulls in the data you need and presents it how you like. This is where Google Data Studio comes in handy, as it allows you to do precisely that.
There are dashboard templates available in the public gallery, or you can build your own from scratch.
Here’s how to set up a Google Data Studio Report:
- Go to Data Studio
- Click the Template Gallery
- Select data sources from the Category dropdown
- Choose a report template from the gallery
- Tour sample report and make sure it has all the features you need
- Click Use Template
- Add your New Data Source
- Click Copy Report
The important thing to remember with SEO dashboards and reports is that you don’t need all the bells and whistles. You simply need insights that will inform strategy development.
Stick to the metrics that tell a story about what is working and identify areas for improvement.
Step 4. Review and act on the data
The final step is to review and act on the data. Data is useless without action. Pristine client-facing reports are not the point—better performance is.
Let’s take a look at some of the questions we turned to data analysis for and use our tools to answer them.
Google Analytics: What content is the most engaging?
Google tells us in its own SEO Starter guide that “any optimization should be geared toward making the user experience better.”
But how do you know which content your users are (and aren’t) engaging with?
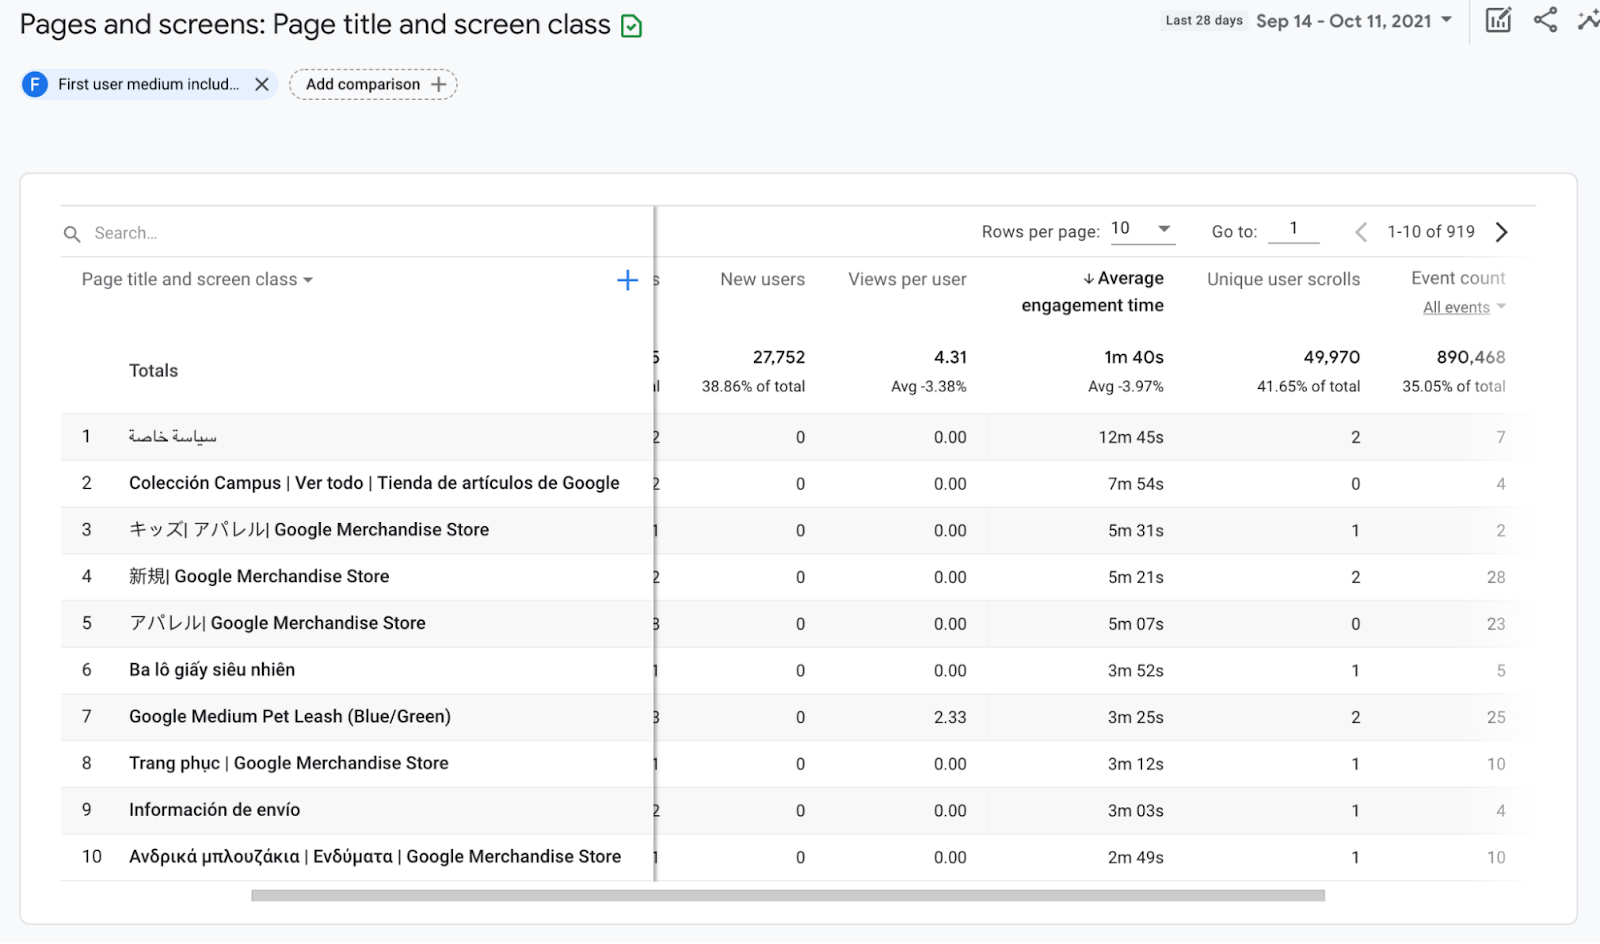
This can be a difficult question to answer, but the “Average engagement time” metric in Google Analytics 4 can help. It shows the average engagement time per user.
Here’s how to see it for your organic visits:
- Go to Google Analytics 4
- Click Engagement > Pages and Screens
- Click All users at the top
- Change the dimension to First User Medium
- Change the dimension value to organic
- Sort the table by “Average engagement time” from high to low
You’re now seeing the most to least engaging pages on your website.
You should still take this data with a pinch of salt because some pages will be longer than others. Having a low average engagement time on a 300-word blog post probably isn’t a sign that it’s unengaging; there just isn’t much to read.
Similarly, you shouldn’t read too much into data for pages with few users because it’s unwise to base your decisions on small sample sizes.
Search Console: How do I increase backlinks?
Our study of over a billion pages found a clear relationship between organic search traffic and backlinks. So if you’re looking to increase traffic, backlinks are definitely something to pay attention to.
To get more backlinks, you’ll need to answer the question: What content attracts backlinks?
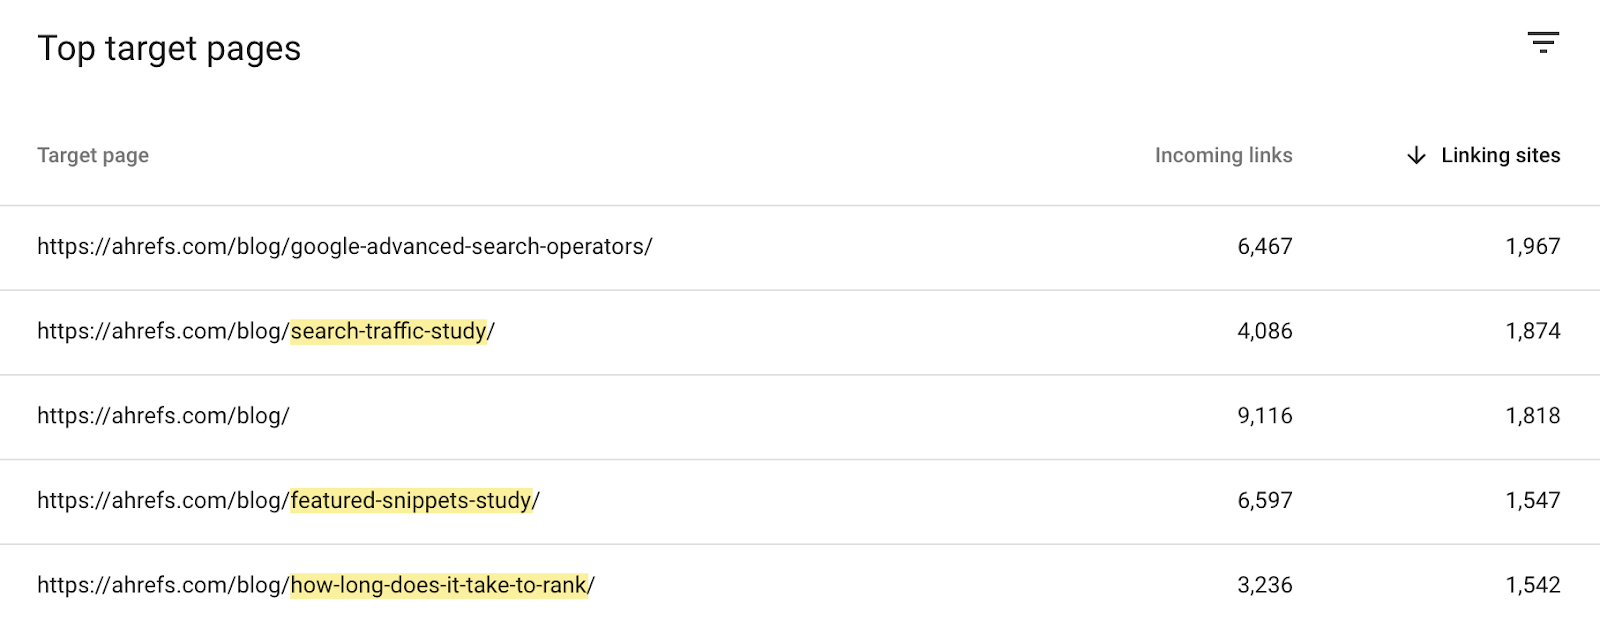
The answer can be found in Google Search Console:
- Go to Google Search Console
- Open the Links report
- Click More on the “Top Links Pages” report under the “External links” subheader
- Sort the report by “Linking sites” in descending order
Look for patterns in the type of content-generating backlinks.
For us, it’s clearly studies:
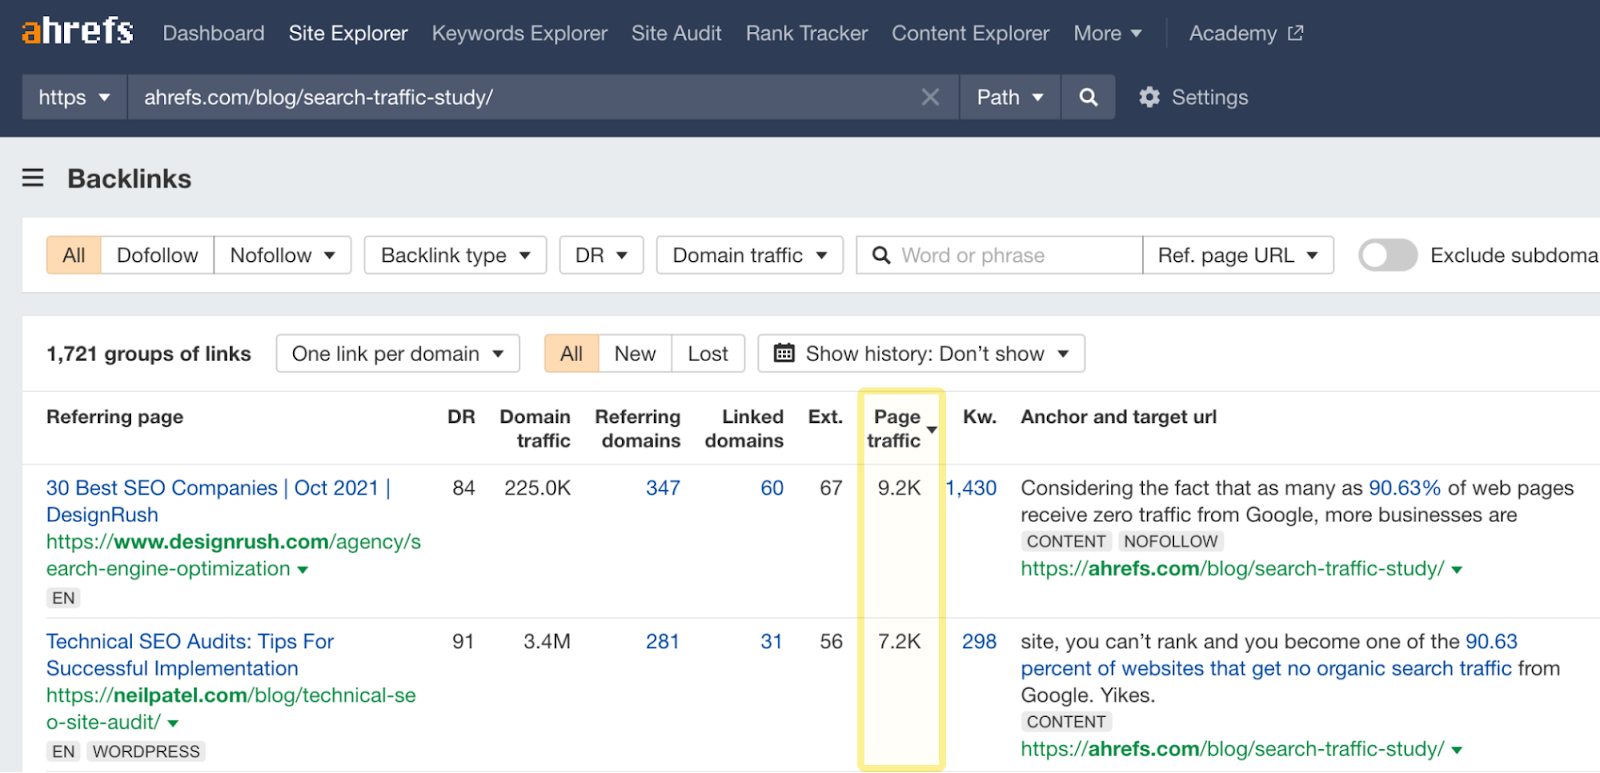
Just keep in mind that Search Console will only show you the number of backlinks and linking sites, not their quality. To delve deeper and analyze their quality, you’ll need a third-party backlink tool like Site Explorer. You can use it to view backlinks for your own website for free by signing up to Ahrefs Webmaster Tools.
Here are all the backlinks to our search traffic study sorted by the linking page’s estimated monthly organic traffic (which is a good proxy for backlink quality):
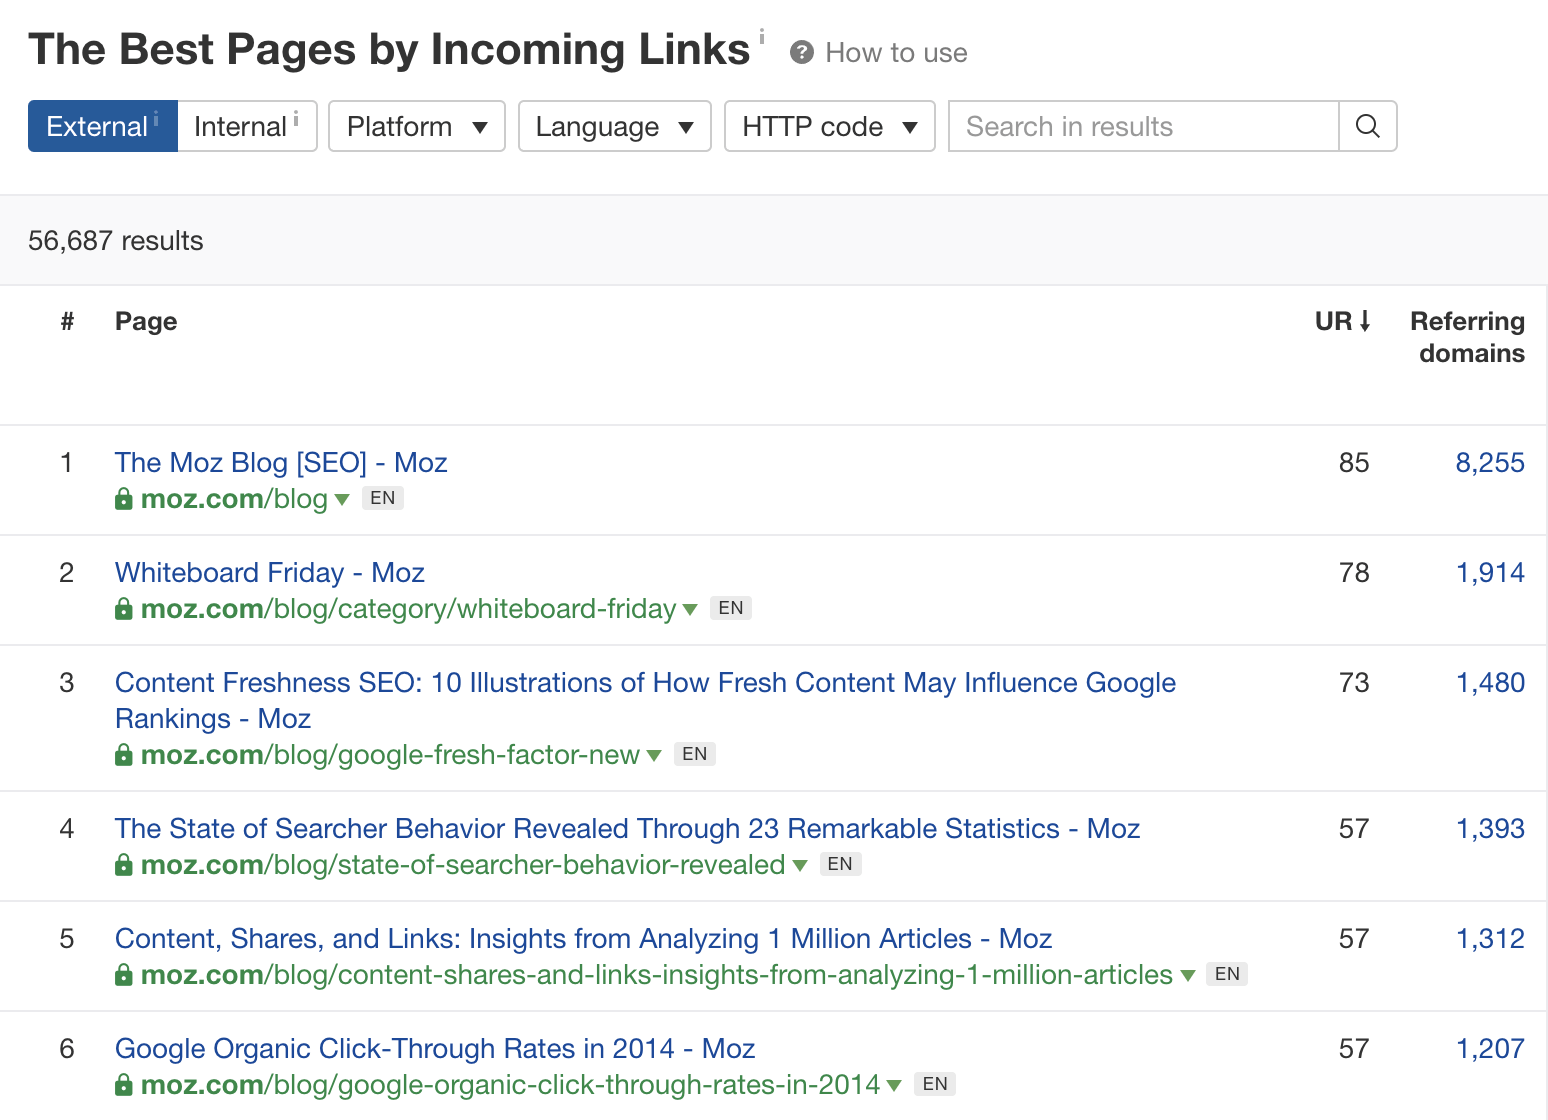
You can use the Best by links report in Site Explorer to see which of your competitors’ content attracted the most backlinks. This can be super useful for finding popular “link worthy” content ideas that you may have missed.
Ahrefs: What are my competitors ranking for that I’m not?
While I don’t advise basing your entire marketing strategy on what competitors are doing, it stands to reason that if two to three competitors are ranking for a particular keyword (that you’re not ranking for), then it’s important to your market.
You can find these keywords with Ahrefs’ Content Gap tool:
- Go to Site Explorer
- Enter your domain
- Click Content Gap on the left menu
- Enter two to three competing domains
- Click Show keywords
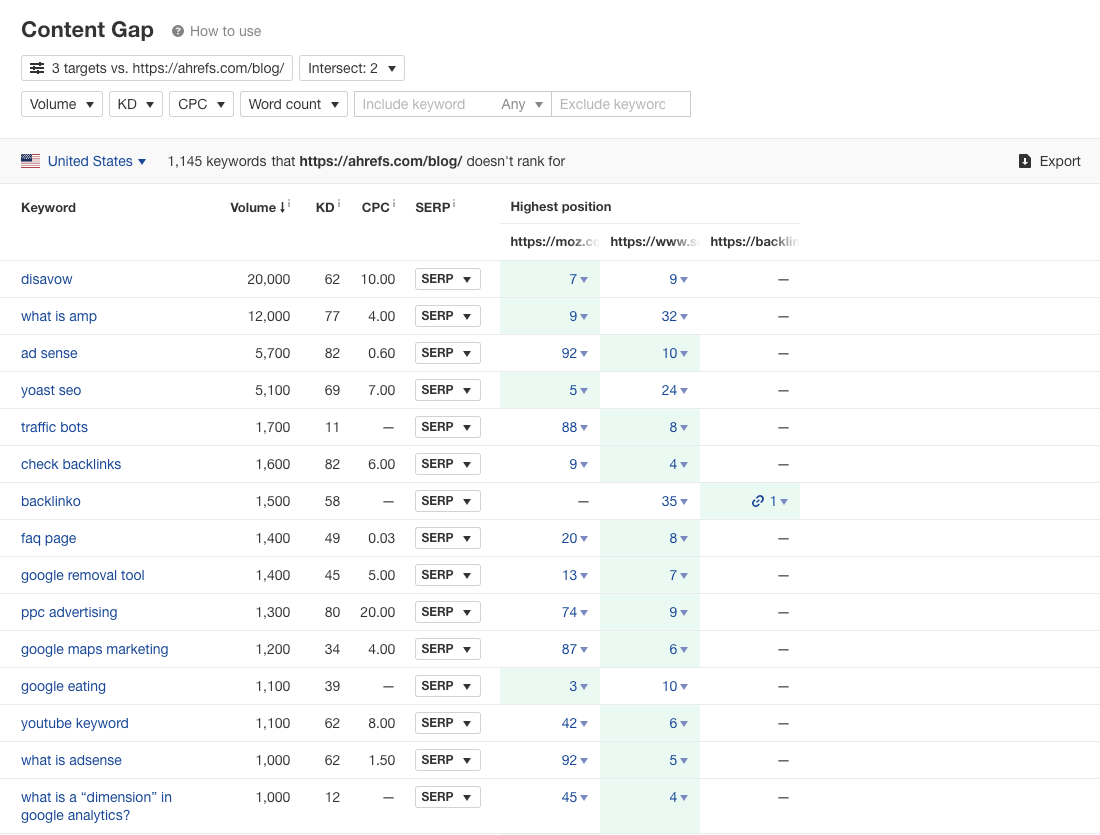
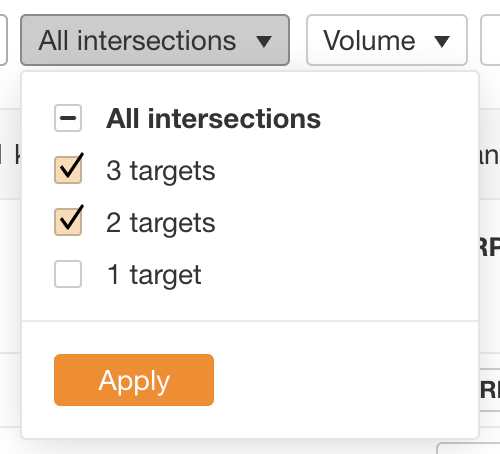
If this uncovers too many keywords or you see a lot of irrelevant ones, switch the number of intersections to two or three.
Recommended reading: How to Do an Effective Content Gap Analysis for SEO
Final thoughts
In this article, we have defined what SEO analytics means, why it’s important to digital marketing, and how to get started.
Whether you’re optimizing a personal blog or multimillion eCom site, the insights you’ll gain from analytics should be at the core of your approach to defining and improving performance.
If you take away nothing else from this article, remember SEO analytics is simply a means to an end. It is a process to identify and then implement a value-driving answer.
Got questions? Ping me on Twitter.