This isn’t surprising. Google Analytics is a powerful tool, but extracting valuable and useful insights can often feel like pulling teeth—especially for beginners.
But it doesn’t have to feel this way. You just need to know what data to look at, how to interpret it, and then take action.
In this guide, we’ll go through seven actionable ways to use Google Analytics to improve SEO and cover some common mistakes to avoid.
But first, let’s go over the basics.
When you first log in, you’ll see the “Home” dashboard.
This is vanity metric central, and there aren’t a lot of useful insights here. You’re better off looking at individual reports, which you can find on the left of the screen grouped by topic.
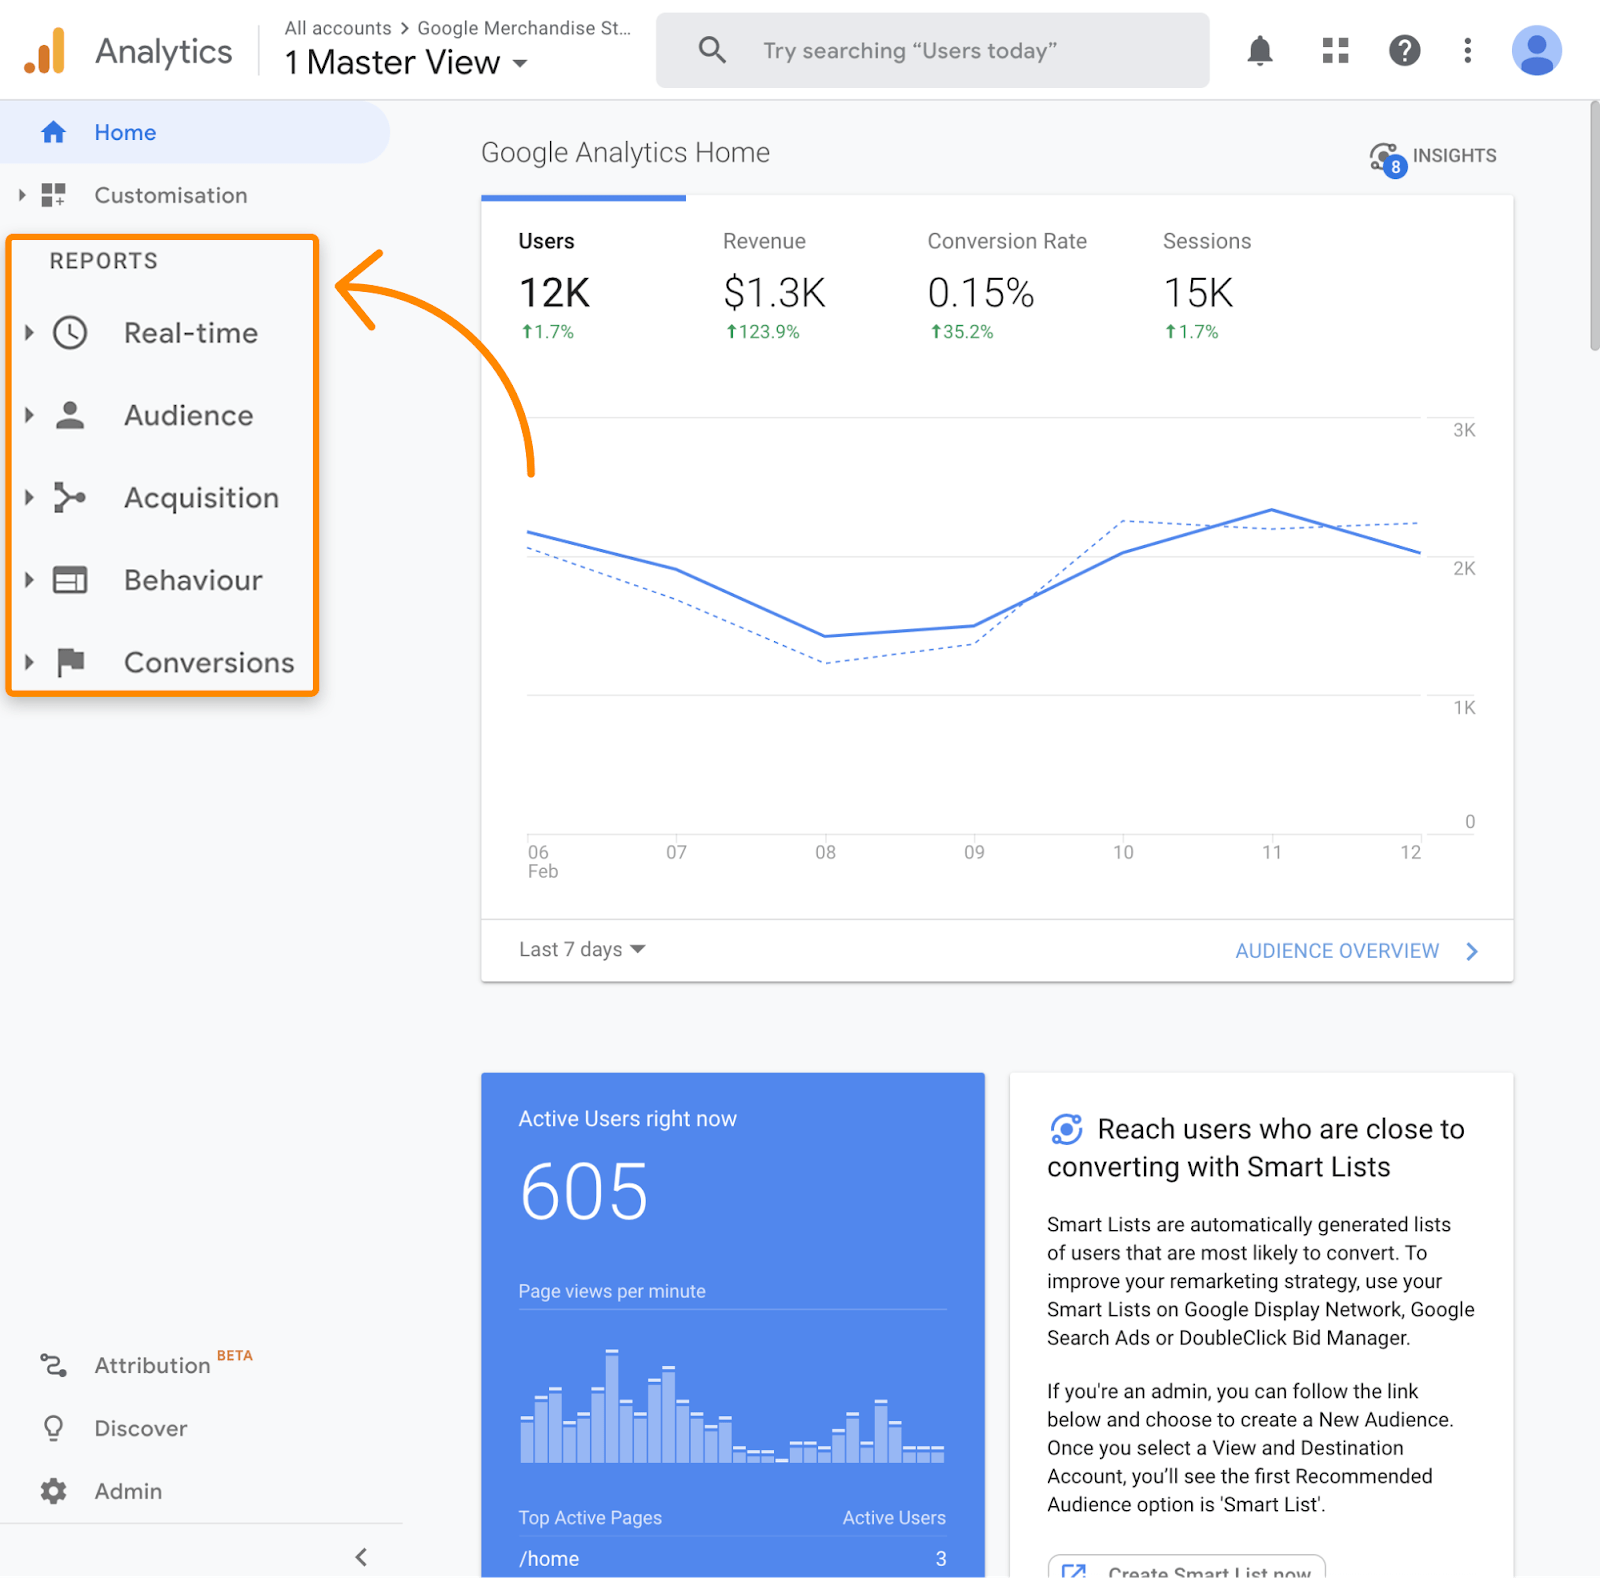
Reports show two things: dimensions and metrics.
Dimensions are attributes of data, and metrics are quantitative data points associated with that dimension.
Confused? Don’t be. It’s quite simple.
Take a look at the data in the landing pages report:
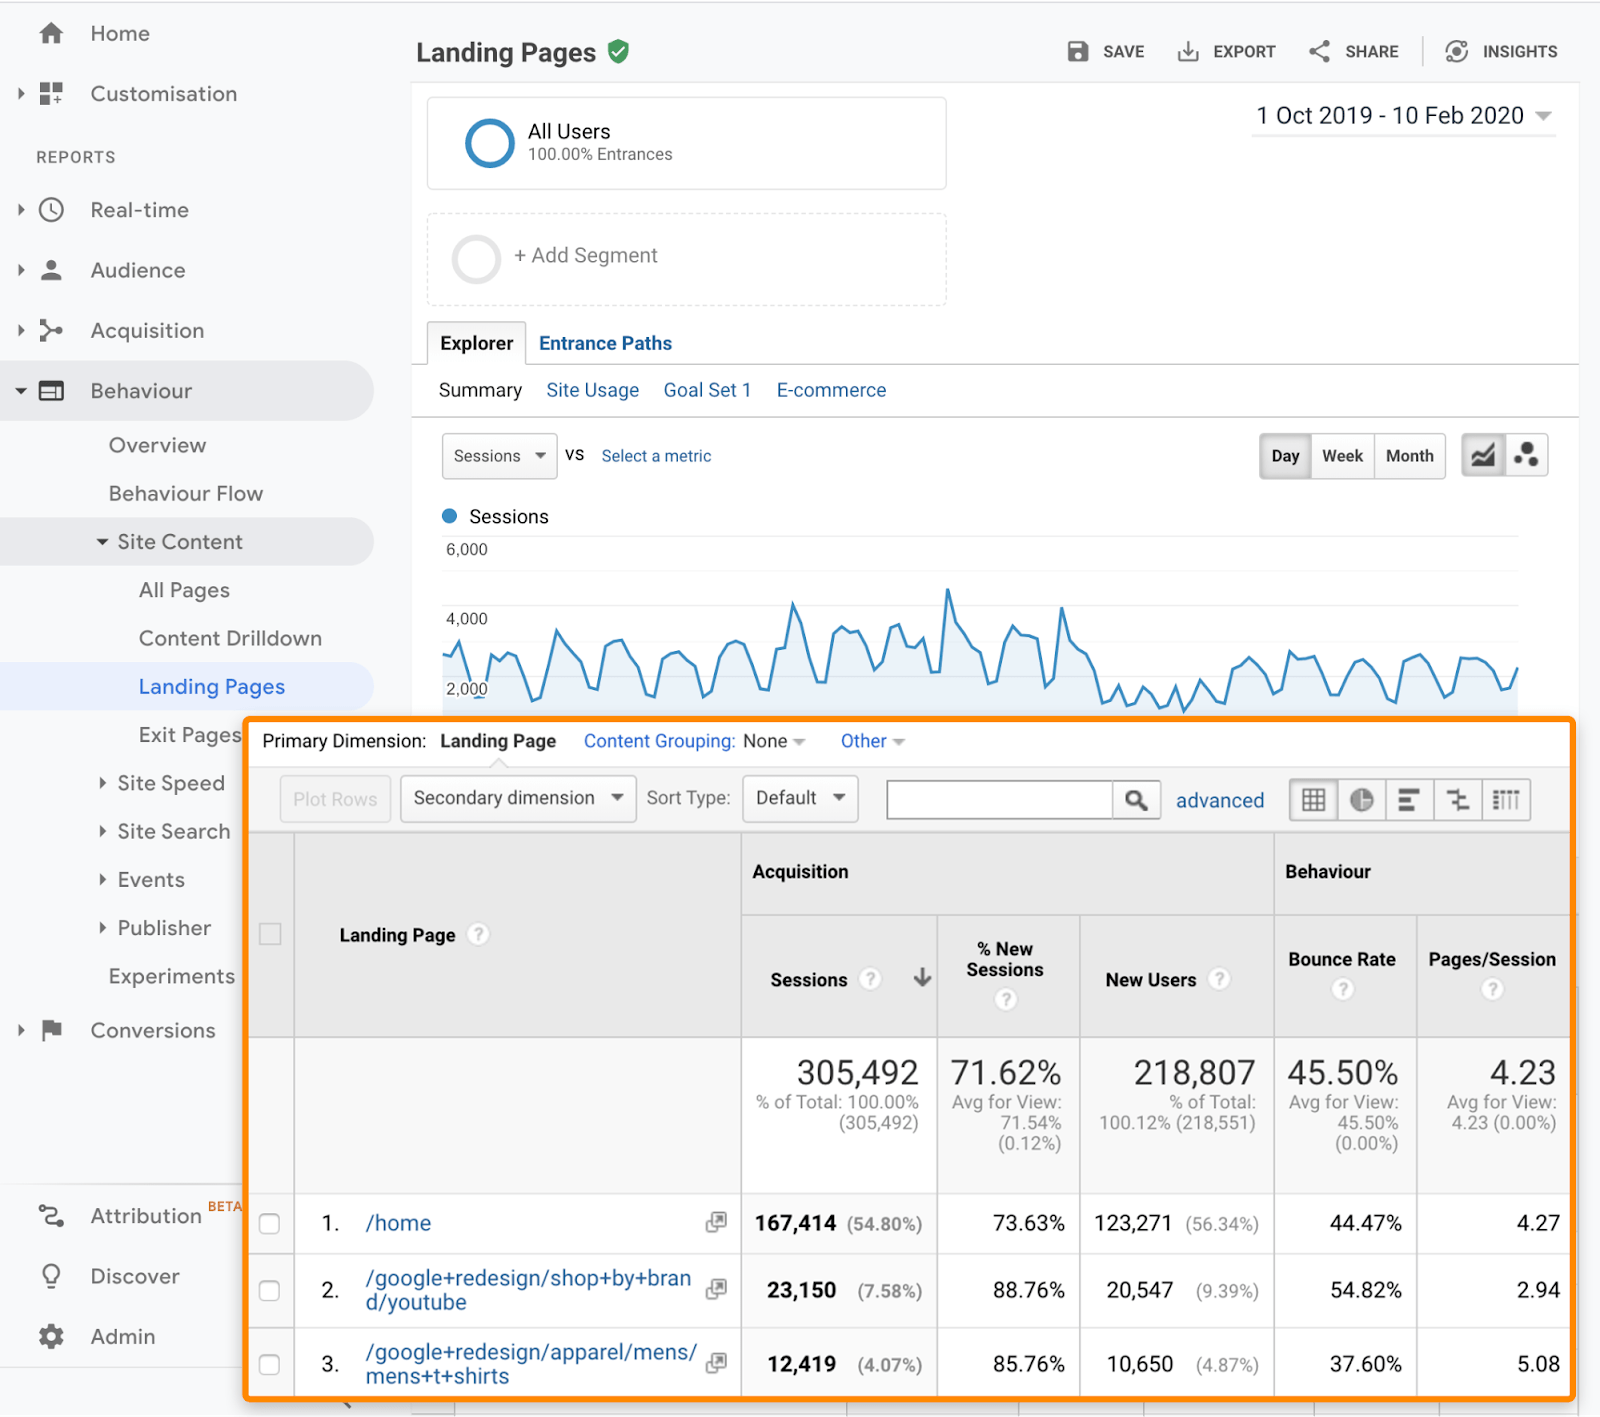
Here, the dimension is the landing page. The other columns show metrics associated with each landing page, like the number of sessions over your selected period.
To get more granular, you can add a secondary dimension to any of these reports.
Let’s add “Country” as our secondary dimension here.
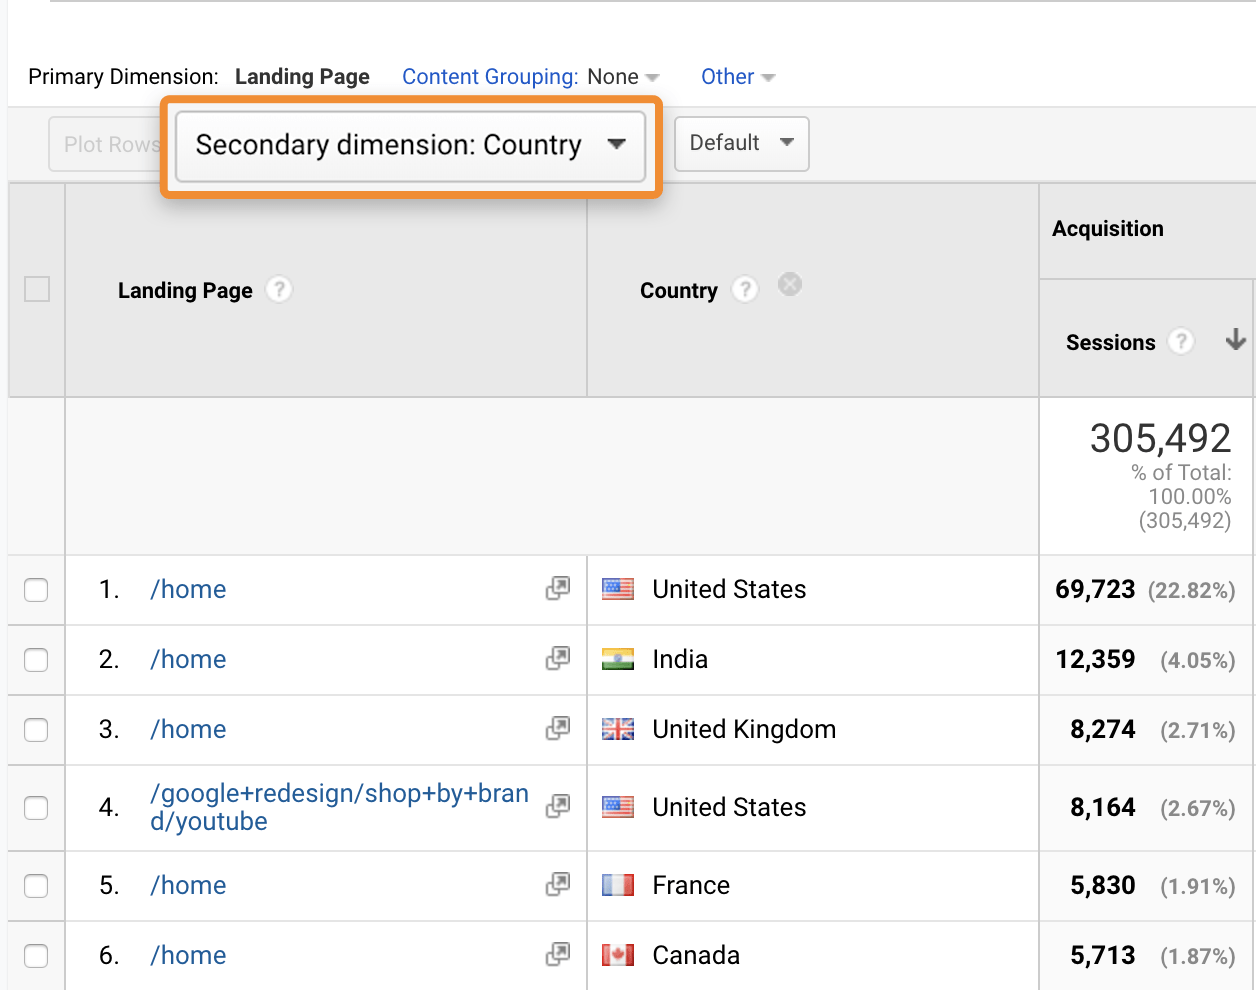
Now we see metrics for each landing page (primary dimension) broken down by country (secondary dimension). For example, we see that 8,274 UK users started their session on the homepage.
But, you might be wondering, what if you only care about seeing a subset of data, like organic traffic from the UK?
That brings us onto segments and filters.
Segments are a way to see data for only a subset of users or sessions across reports. For example, you can segment by organic traffic, like so:
Filters are similar to segments, but they only apply to the report you’re viewing.
For example, we can use a filter to see only data from the UK:
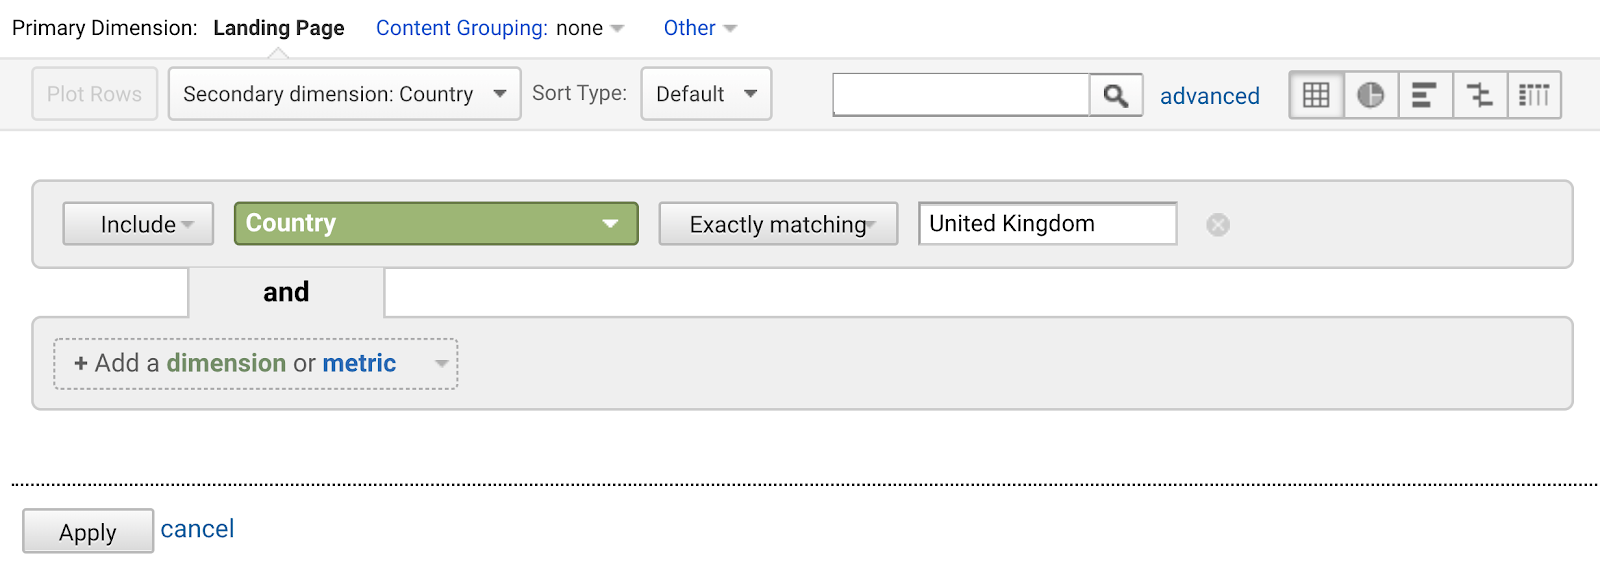
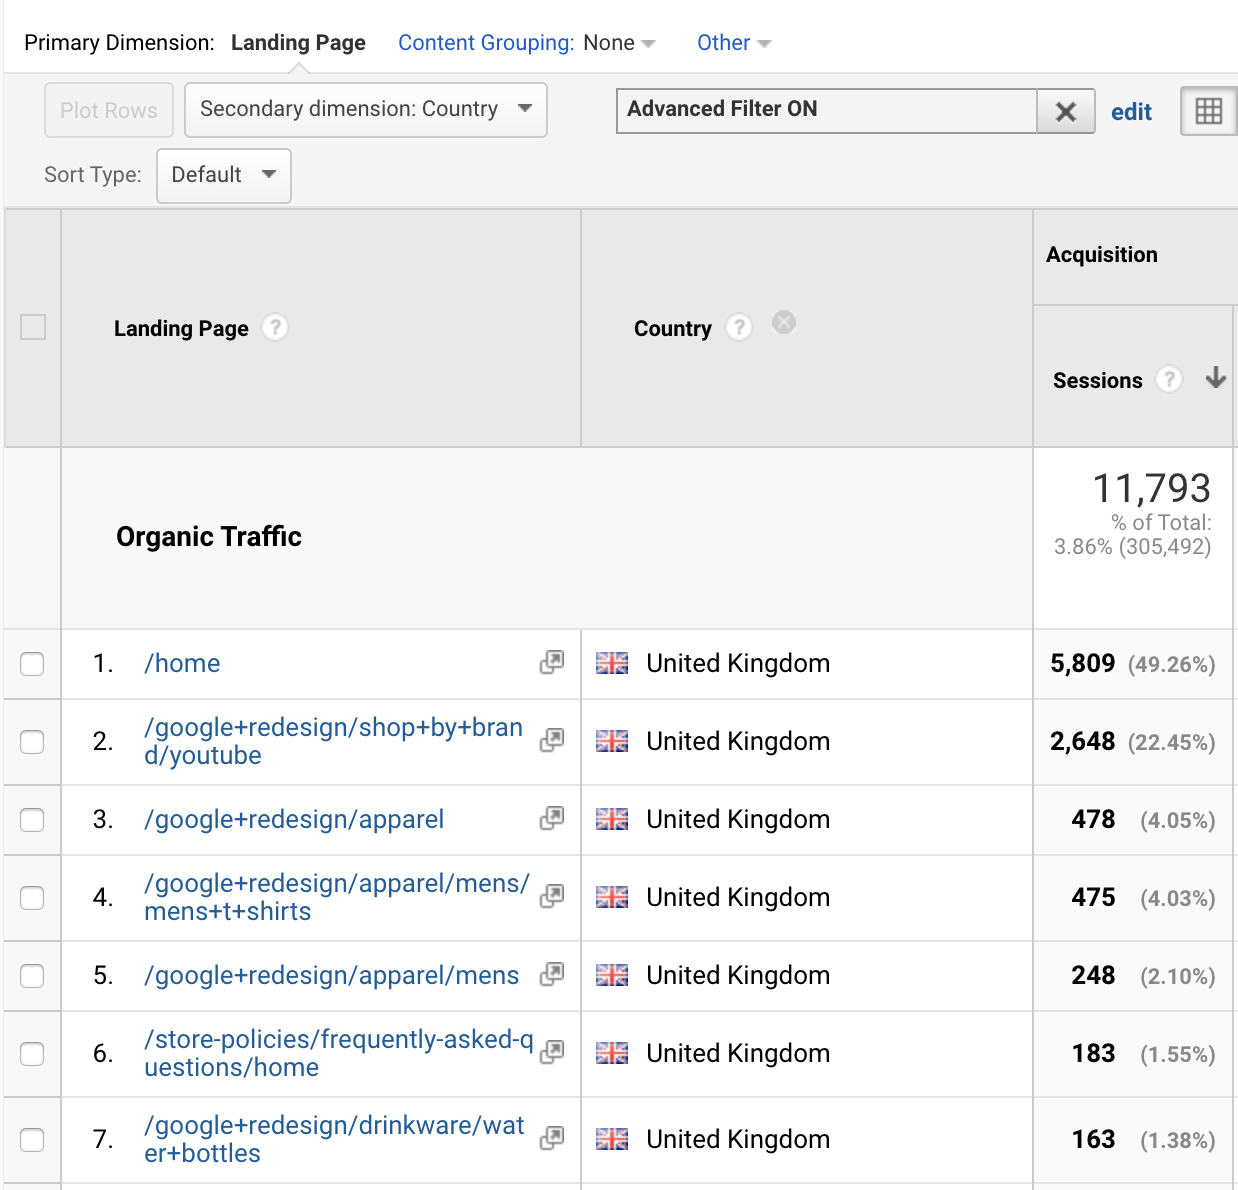
That’s so much more granular than the default report, don’t you agree?
Good. Now let’s move onto the more exciting stuff.
Knowing the basics is great, but how do you actually move forward, obtain meaningful insights, and improve your SEO?
Here are seven ways:
- Find low-hanging opportunities to boost traffic/revenue
- Find high-converting pages and improve their SEO
- Improve landing pages that contribute to conversions
- Find keyword opportunities by tracking internal site search
- Automatically track organic traffic dips and spikes
- Set up alerts and monitoring for 404 pages
- Use annotations to pinpoint issues and changes
1. Find low-hanging opportunities to boost traffic
Pages don’t always rank forever. Just look at the decline in traffic to our list of top Google searches in 2018:
That’s a 54% drop in just over a month.
But you’ll notice that shortly after, traffic skyrocketed:
So, what changed?
Answer: We updated and republished the post to bring it back to its former glory.
The question is, how do you find pages ripe for republishing?
While you can use Ahrefs’ Site Explorer or the Performance report in Google Search Console, it’s best to use Google Analytics. Why? Because it gives you conversion data, which you can use to tie SEO efforts to business metrics.
Here’s the process:
Go to Acquisition > Search Console > Landing Pages.
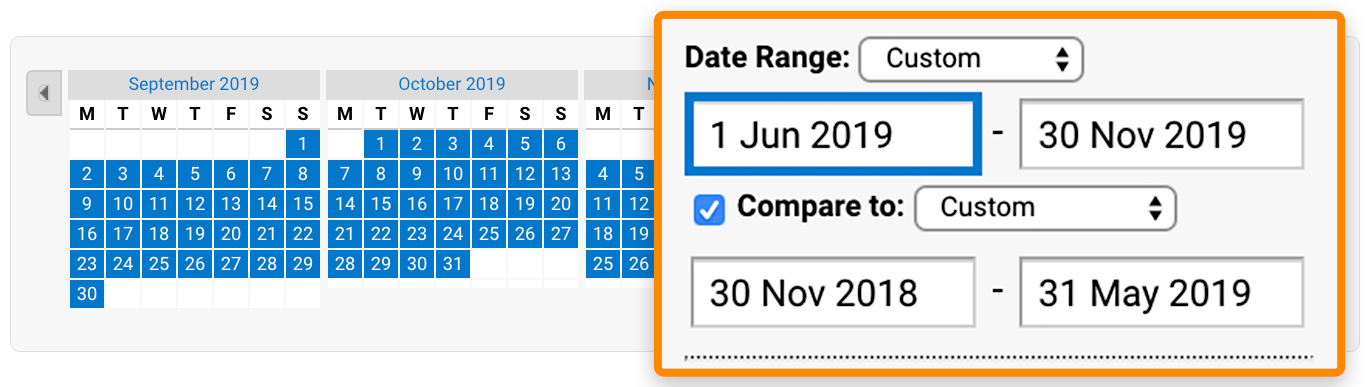
Select a time frame for comparison. We’re primarily looking for content that needs republishing, so it’s worth comparing at least six-month periods.
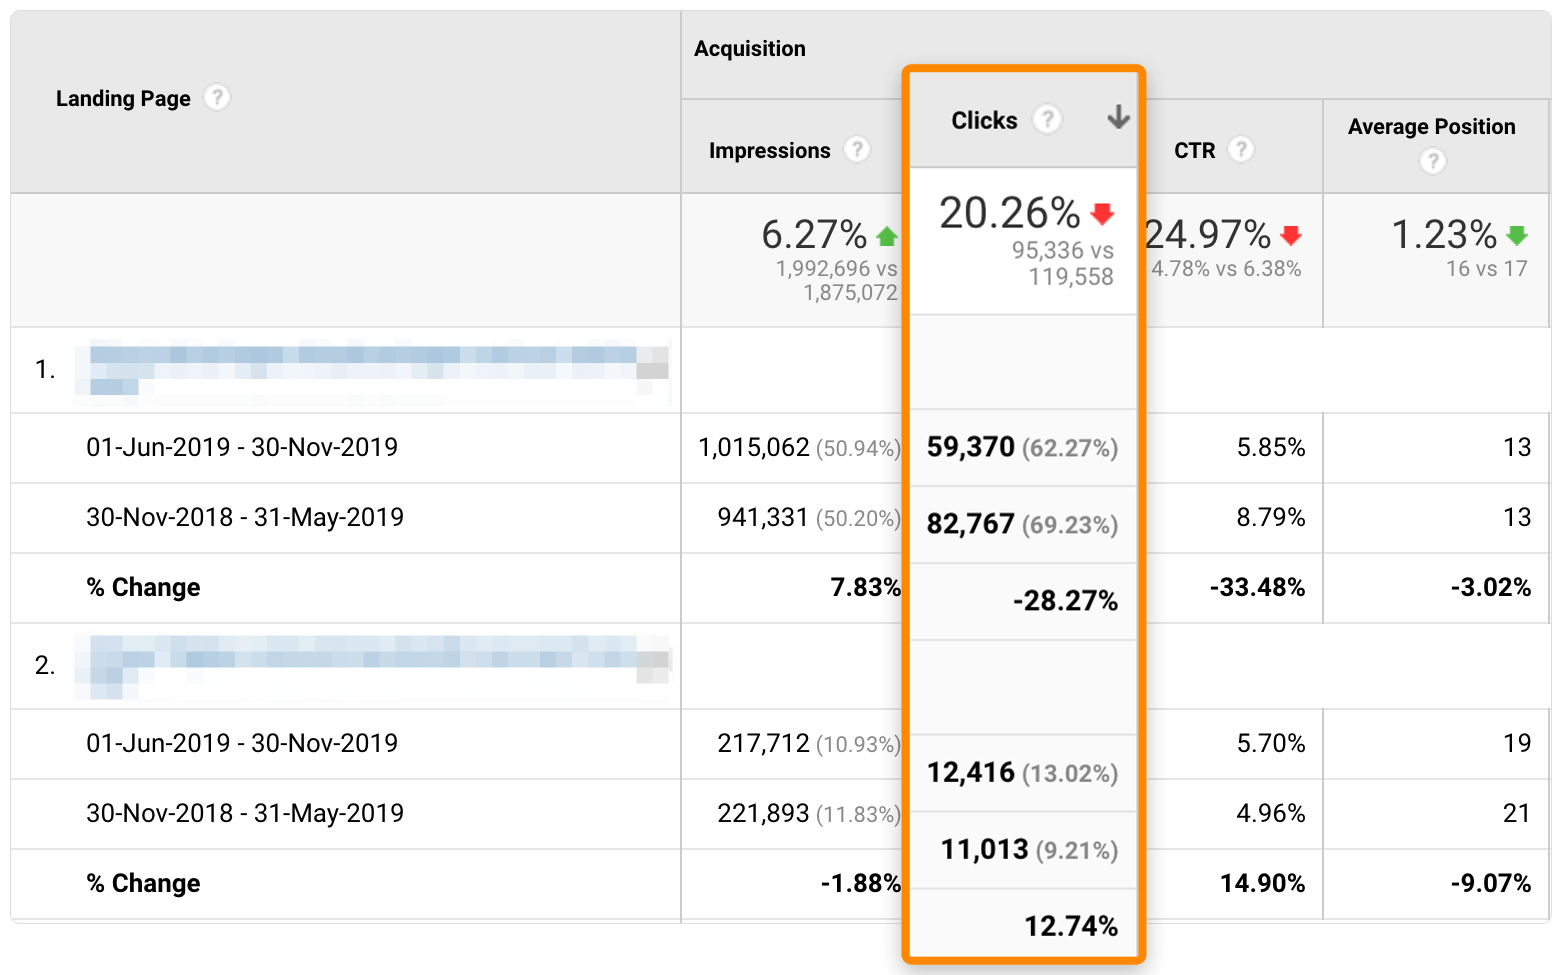
Sort the table by clicks, then select the landing page you want to investigate to see search query data.
Look for potential causes, find patterns, and take action to drive more organic traffic.
Of course, the final part is easier said than done. So, what should you look for?
First, consider whether the page is about a topic where freshness is a ranking factor. That was the case with our post about the top Google searches. People didn’t want to see popular searches from 12 months ago, so traffic started to drop.
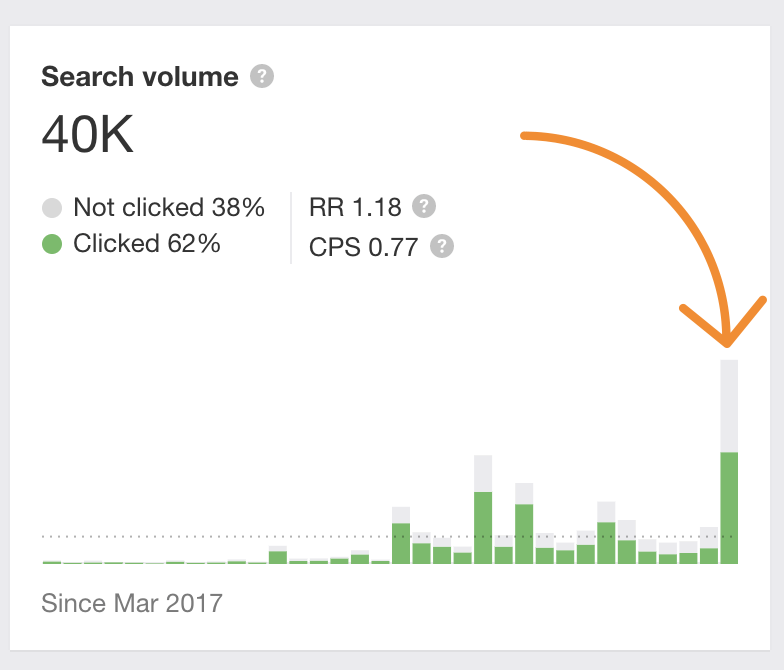
Second, if you see a significant organic traffic change to your homepage, it’s usually down to a fluctuation in the search volume of navigational queries. Maybe you went viral six months ago, and more people were Googling your brand, but then it naturally dropped back to the mean?
Judging by the search volume fluctuations for “aviation gin,” this seems to be what happened after their brilliant TV ad, which capitalized on the cringy Peloton ad.
If none of those appear to be the culprit, it’s a case of digging deeper. There could be any number of reasons for a drop in traffic.
Here are a couple of useful secondary dimensions to get you started:
- Device Category: If the traffic change is mainly attributed to one device category, start checking for device-specific UX issues, page speed issues, and content differences between devices. Remember, Google uses mobile-first indexing, so if your website shows mobile users less information than desktop users, that could be a problem.
- Country: Traffic drops from specific countries might mean localization or indexation issues. If you have content in more languages, start by auditing your hreflang tags.
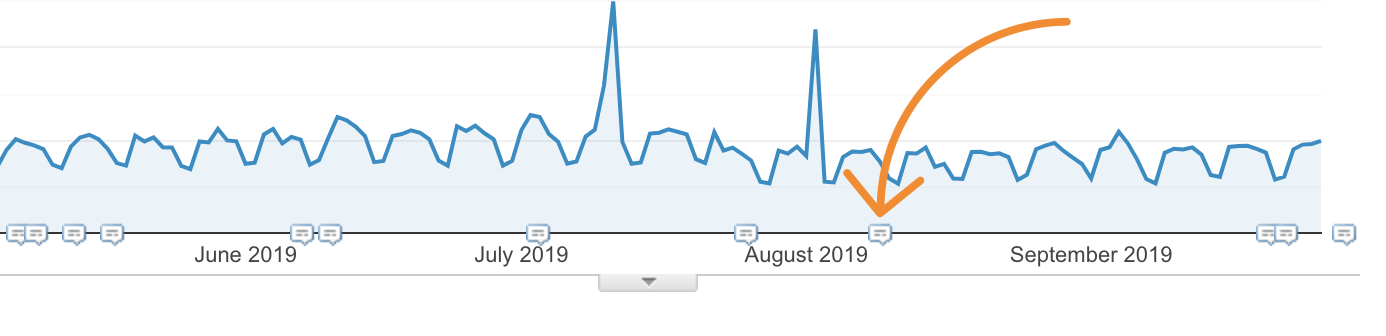
Don’t forget to look at the time chart above the report. It’s especially important to check for drops or spikes around the time Google announced an algorithm update. You might also come across traffic spikes caused by ranking for irrelevant keywords. Google is not perfect.
2. Find high-converting pages and improve their SEO
The ultimate goal of SEO is usually to drive more sales from organic search. One of the easiest ways to do that is to improve rankings for your most valuable pages.
Here’s how to do that:
Go to Acquisition > Search Console > Landing Pages.
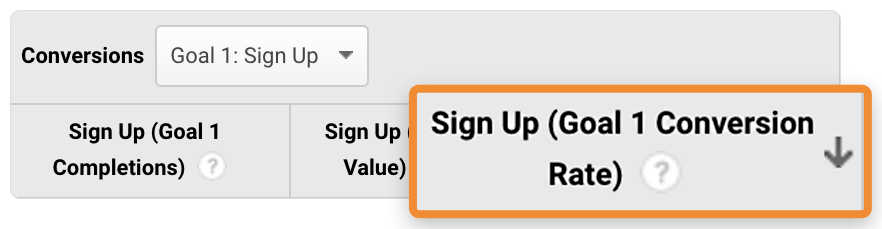
Select an important goal and sort the table by conversion rate.
Plug each URL into Ahrefs’ Site Explorer and check the Organic Keywords report.
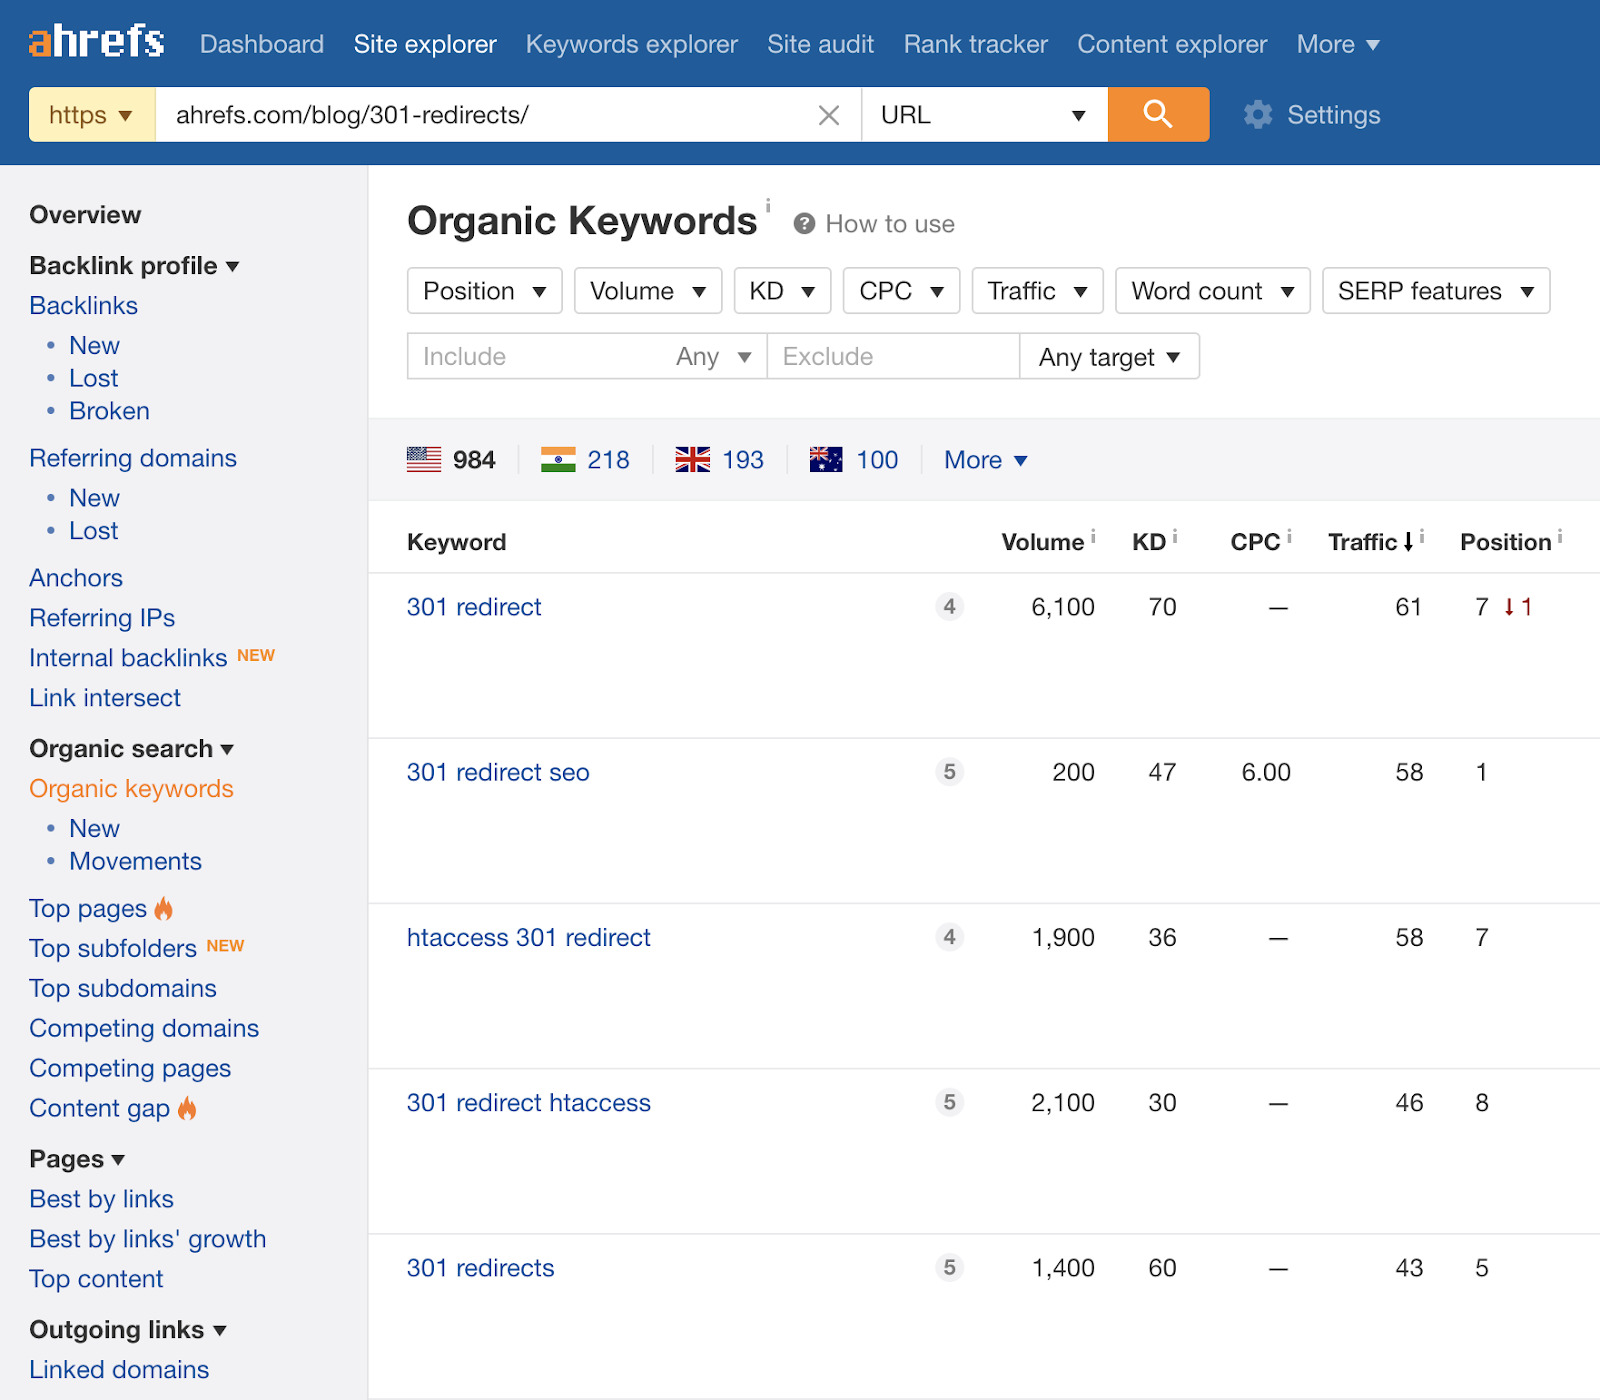
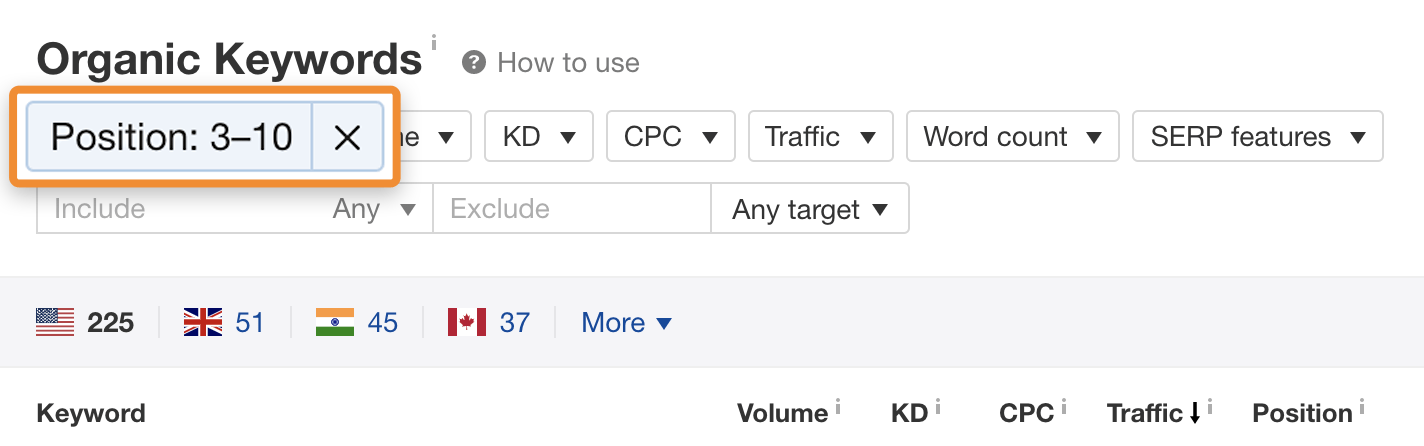
Filter for keywords where you rank in positions 3-10.
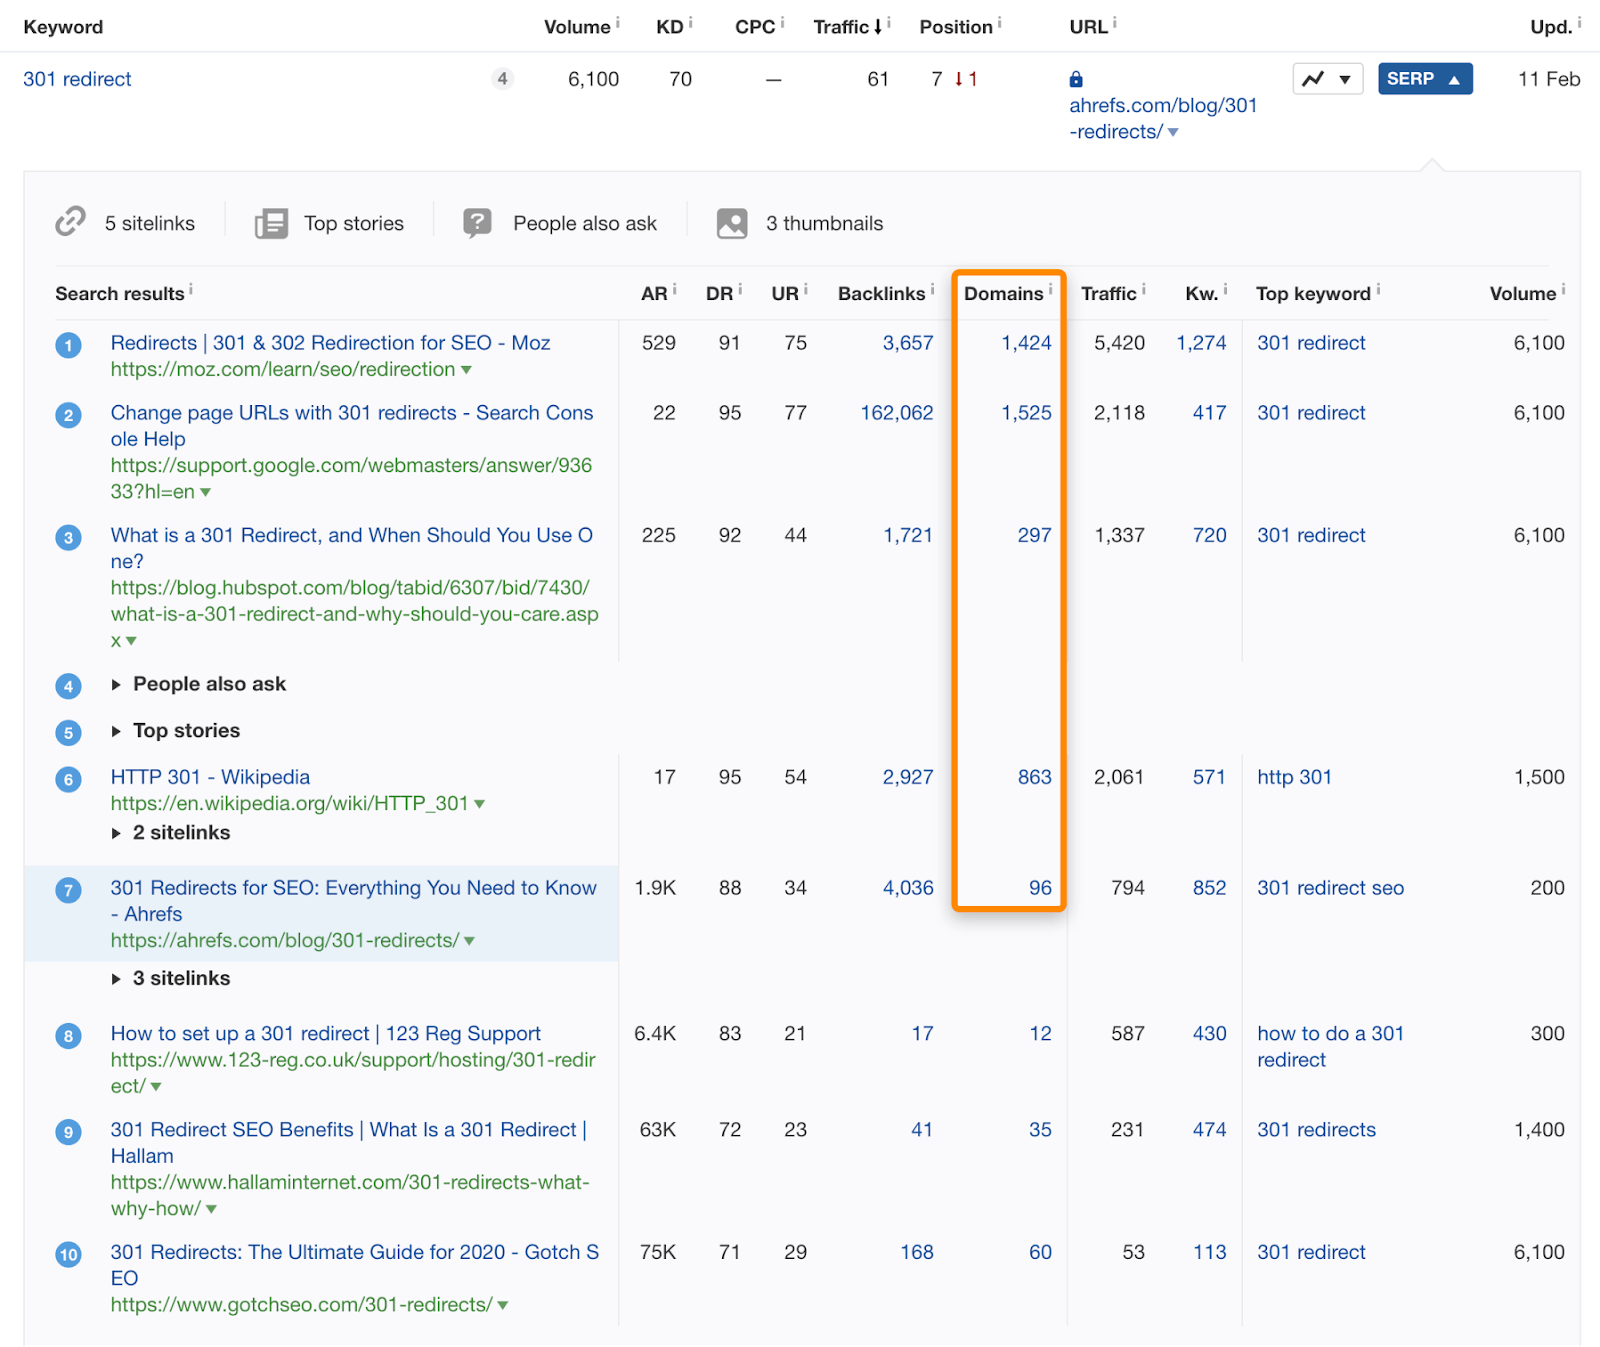
Hit the “SERP” button and compare your page’s SEO metrics to those that outrank you. In this case, it looks like the pages above us have way more referring domains.
Take action to improve your page where it falls short. Follow our guide to ranking higher on Google if you’re not sure where to start.
Use Google Search Console, Google, and Ahrefs’ Free Backlink Checker to do something similar.
- Find the keywords you rank for in Search Console.
- Search for them on Google.
- Check backlinks to the top-ranking URLs in our free backlink checker.
- Compare them with your page to see if and where you fall short.
3. Improve landing pages that contribute to conversions
People rarely land on websites they’ve never visited before and buy something right away. They go on a journey, often visiting multiple pages on your site in the process.
For example, let’s say someone is new to keyword research. They head to Google to learn more and come across our keyword research guide (and YouTube videos).

They read it. Learn from it. But that’s all for today. They leave and go about their business.
A week later, when they have more time, they pick up where they left off and search for some keyword research tools. Knowing that we produce valuable content, they land on our list, where they decide to sign up for our toolset.
By default, Google Analytics credits 100% of the conversion to the last landing page the user visited (provided that it was a non-direct click). But the reality is that the person probably wouldn’t have converted if they didn’t read our blog post first. So technically, this page helped assist the conversion.
Do you see where this is going?
Improving SEO for these pages will probably lead to an increase in conversions and revenue.
But how do we find them?
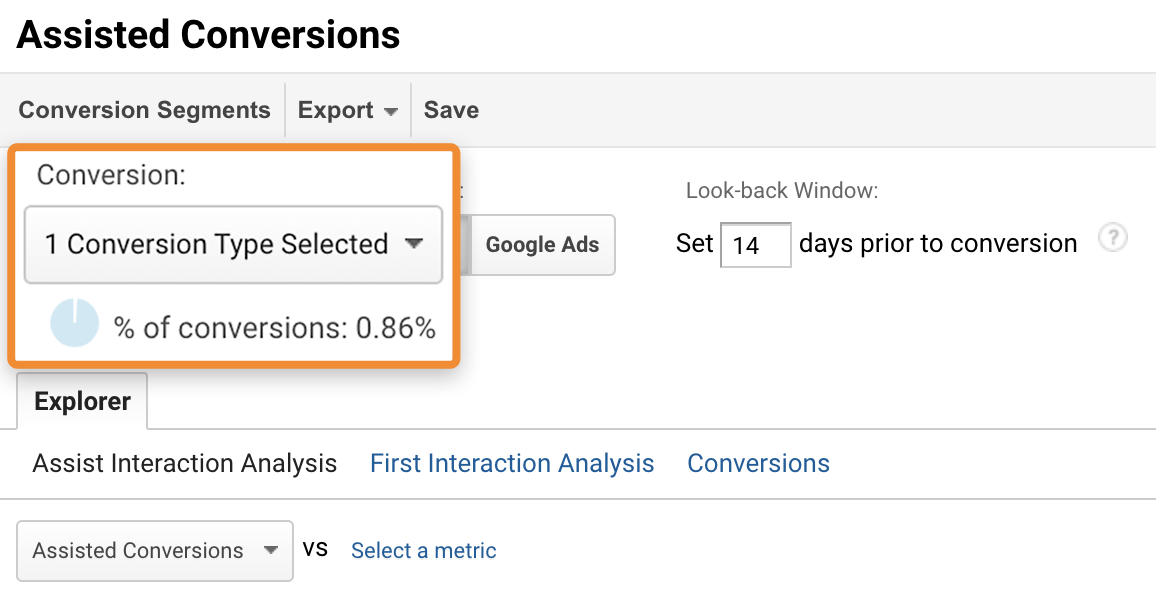
Go to Conversions > Multi-Channel Funnels > Assisted Conversions.
Select a conversion from the dropdown. (All conversions are selected by default, which isn’t ideal.)
Set an attribution window. (This is basically a number of days that should be taken into account prior to the conversion.)
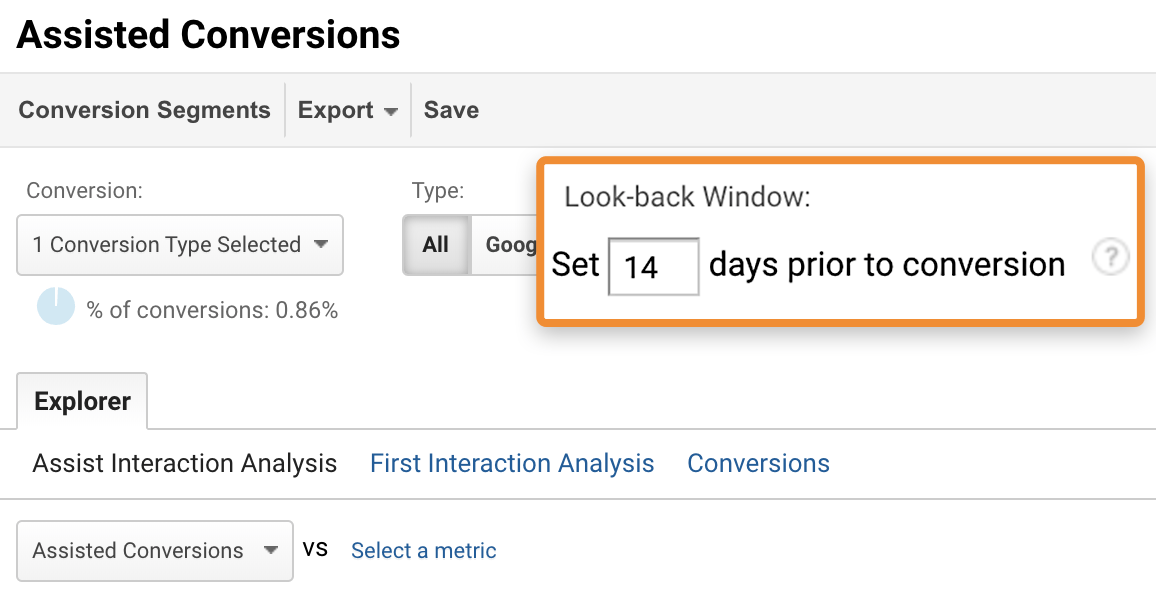
Make sure to adjust this based on the length of your business’ sales cycle.
For example, B2B should generally have the longest attribution window because the length of the decision making process prior to conversion is longer than say buying clothes online. So, play around with the window, and check what it does to the amount of assisted conversions in the report below.
Click on “Organic Search” at the bottom of the report.
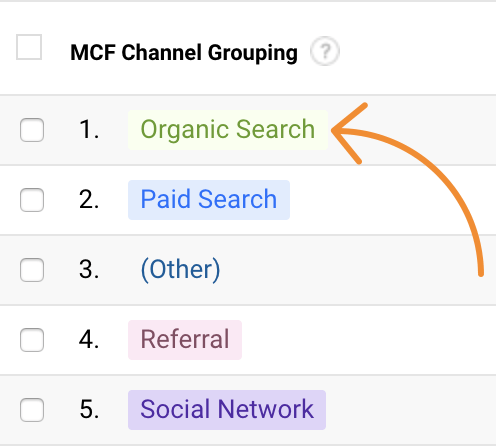
Apply the Landing Page URL as a secondary dimension.
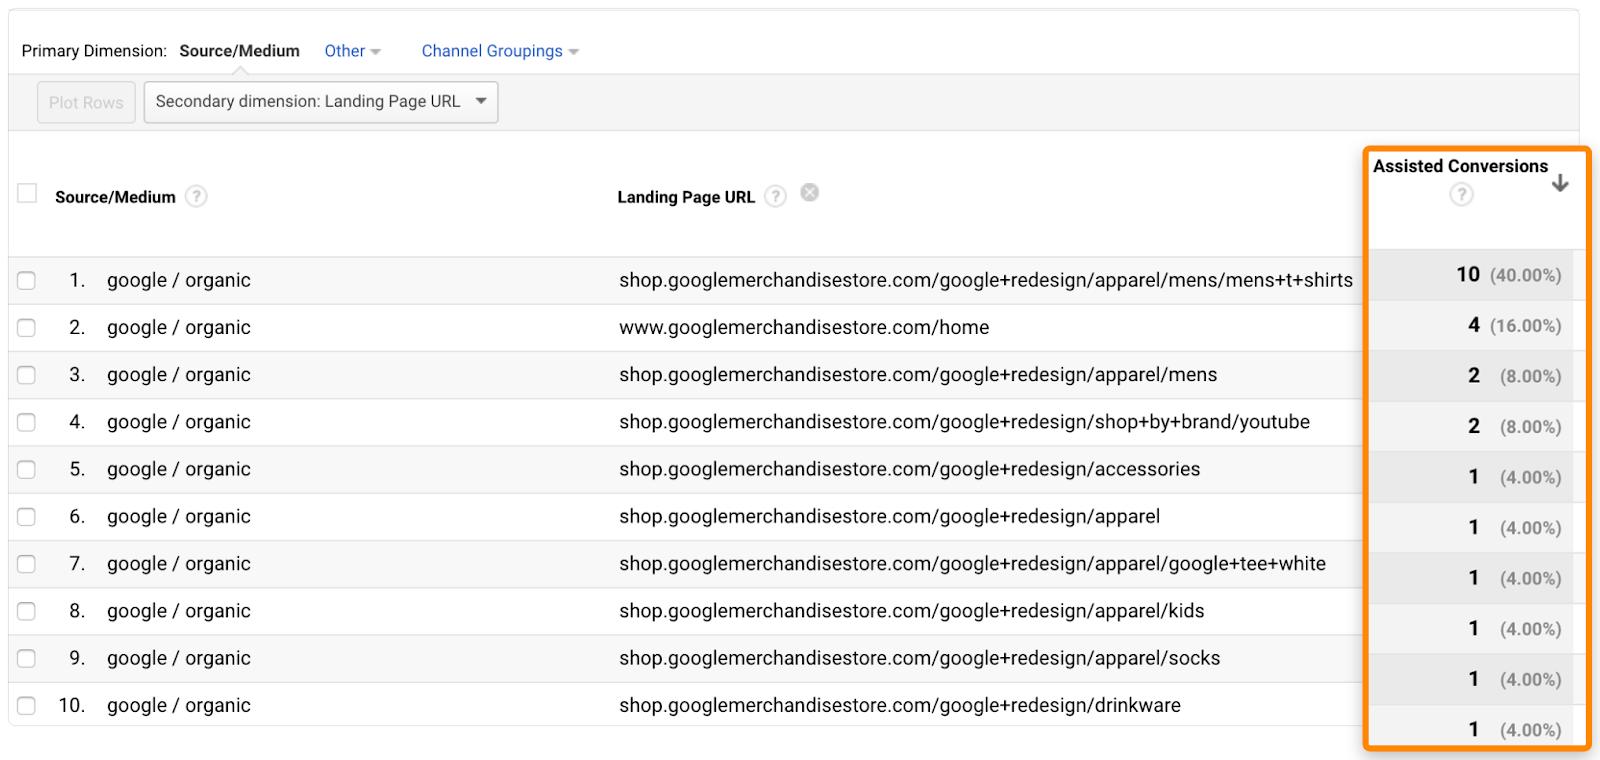
Voila. Now you see a list of organic landing pages sorted by the number of assisted conversions.
Prioritize these pages and improve their SEO.
4. Find keyword opportunities by tracking internal site search
If you have an ecommerce store, help center, knowledge base, or any big website, then you probably also have an internal search engine.
Visitors use it to find specific brands, products, and articles on your website.
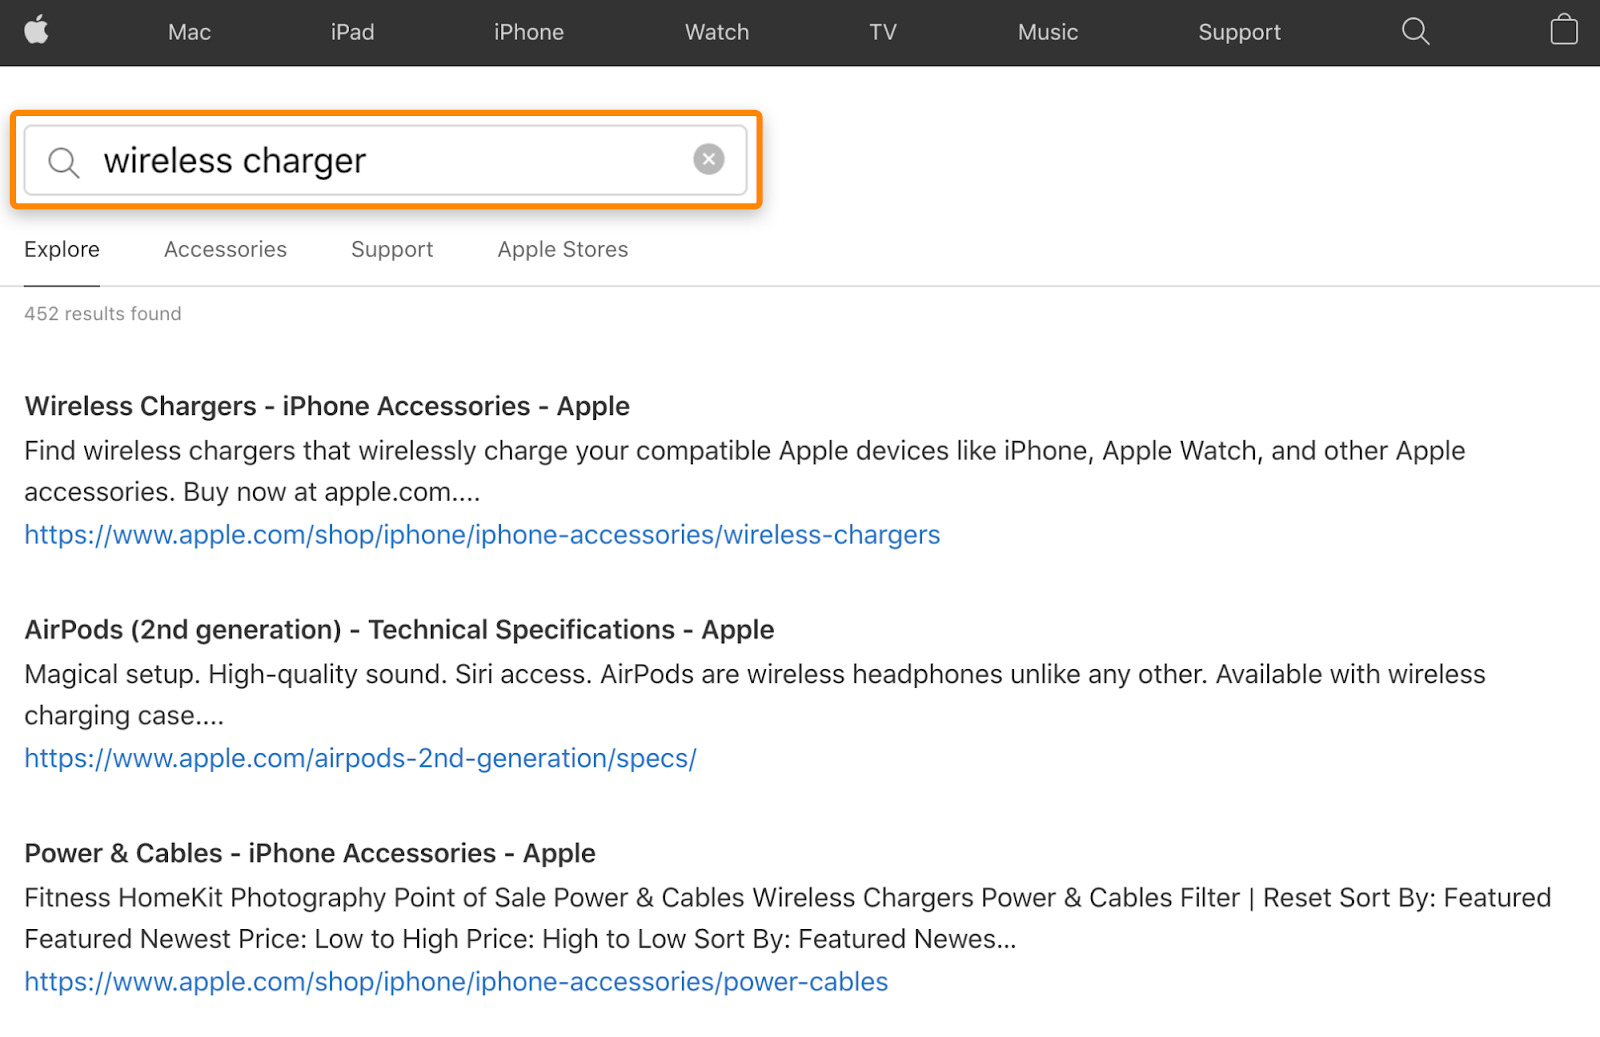
One of the more interesting features of GA is that it can track these internal site searches.
We’ll be looking for keywords that don’t have a good landing page yet. That may be caused by not having relevant content at all, or by ranking for keywords that don’t align with search intent.
Here are the steps:
Follow this tutorial to set up internal search tracking.
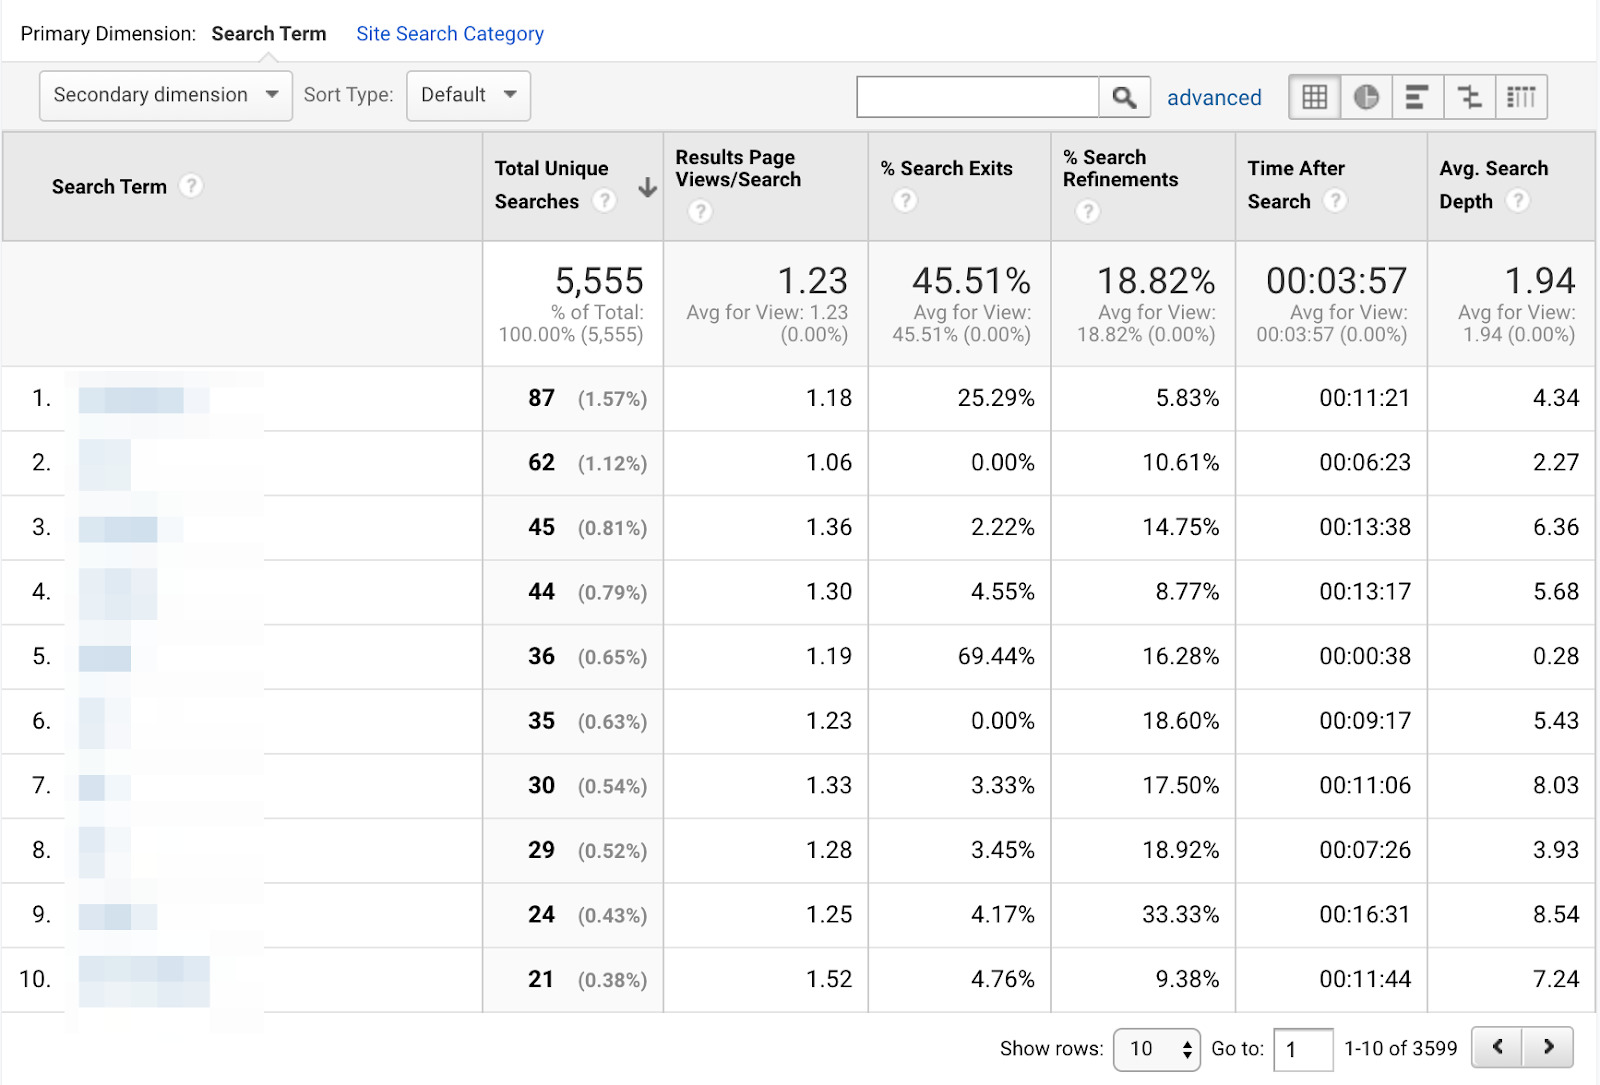
Once you’ve been collecting the data long enough (months), dive into the Search Terms report, which you’ll find under Behaviour > Site Search.
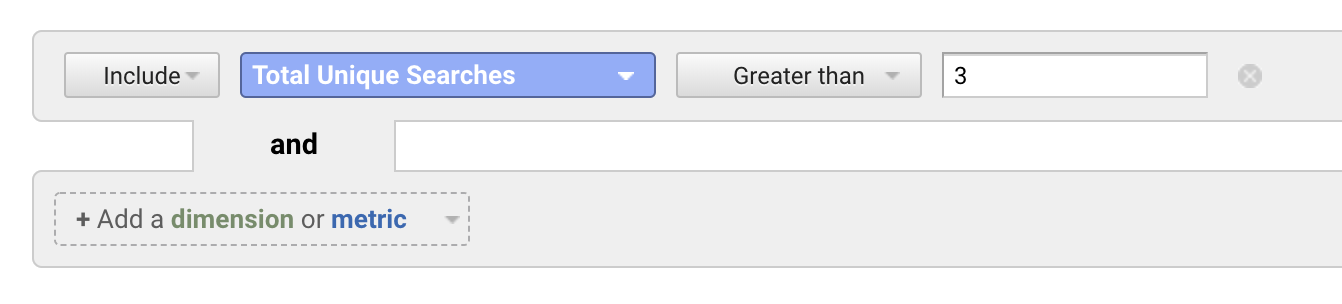
Apply a reasonable filter to rule out super long-tail keywords and typos:
Sort the table by the percentage of search exits and apply the weighted sort type.
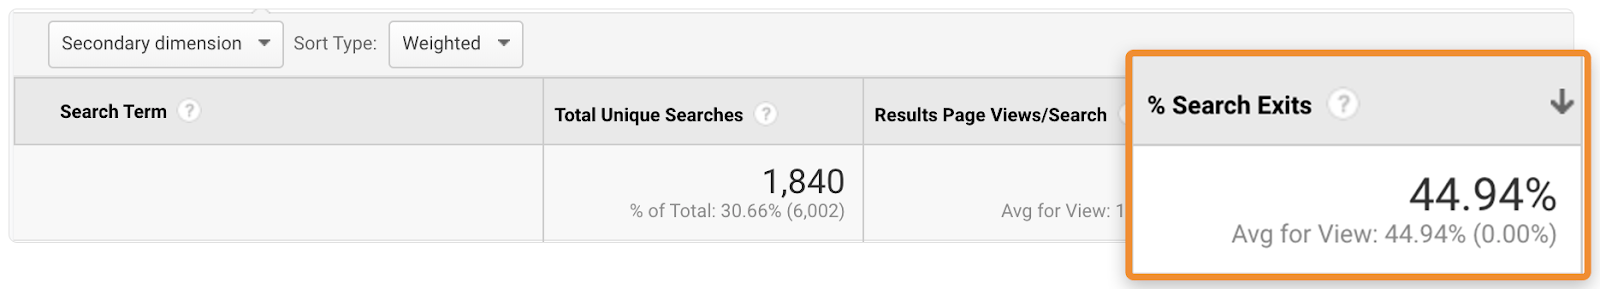
(This is the easiest prioritization process within the GA interface. It shows queries that users searched for sorted by the probability that there was no satisfactory search result. Users left after conducting the search, which counted towards the search exit metric. We use the weighted sort to prioritize more statistically significant search terms.)
Go through the terms and consider creating new content according to the search demand.
If you want to go even further, plug the queries into a keyword research tool like Ahrefs’ Keywords Explorer and check their search volume.
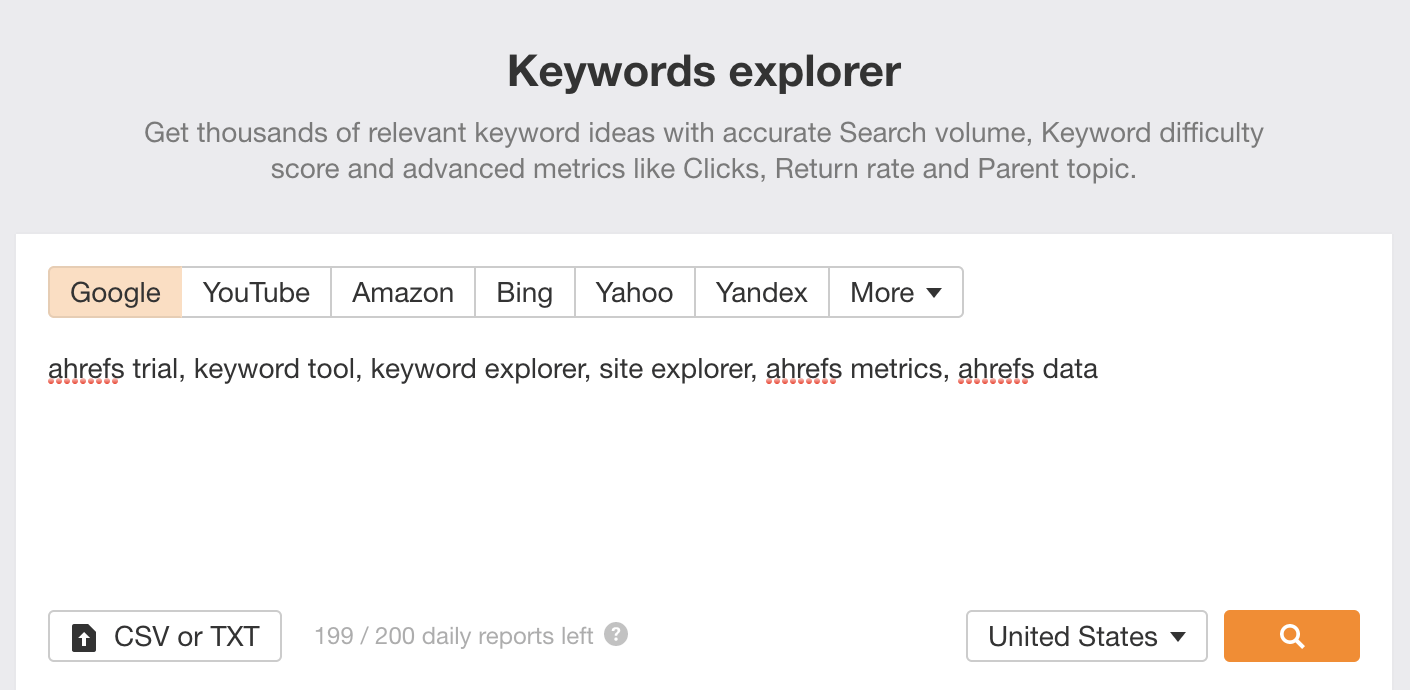
The logic here is that if lots of people are searching for things on your site, there might be lots of people searching Google for them too. So you can leverage GA data to find new keyword and content ideas.
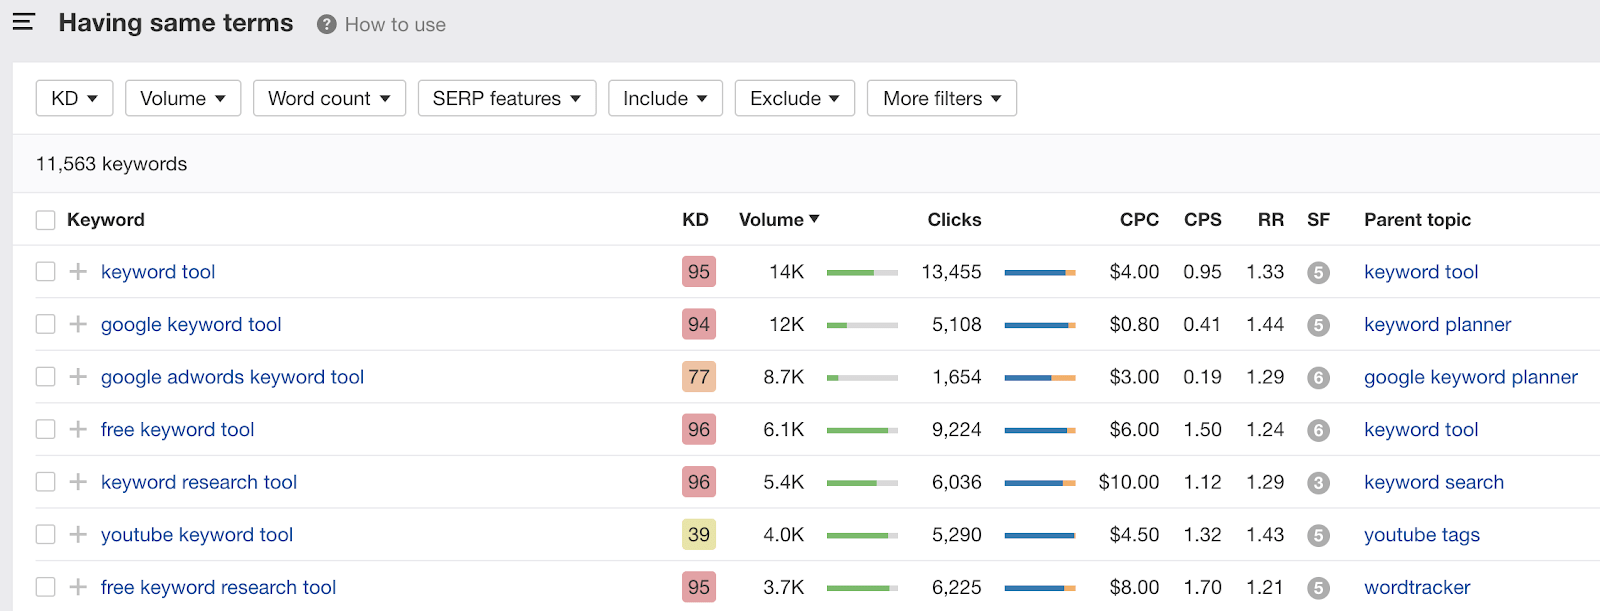
However, don’t just check search volumes for the exact keywords. Check the keyword ideas reports to find even more potential topics to rank for.
5. Automate organic traffic dips and spikes reporting
You can’t improve SEO if you’re not monitoring for issues. It’s inefficient to do this manually, so let’s set up alerts for organic performance.
Go to Admin > View column > Custom Alerts > Create a new alert.
Set up an alert that will fire after you experienced an X% increase or decrease in organic traffic over a certain period. A 20% decrease and 30% increase week-over-week is a good starting point, but feel free to adjust these numbers according to the volatility of your site.
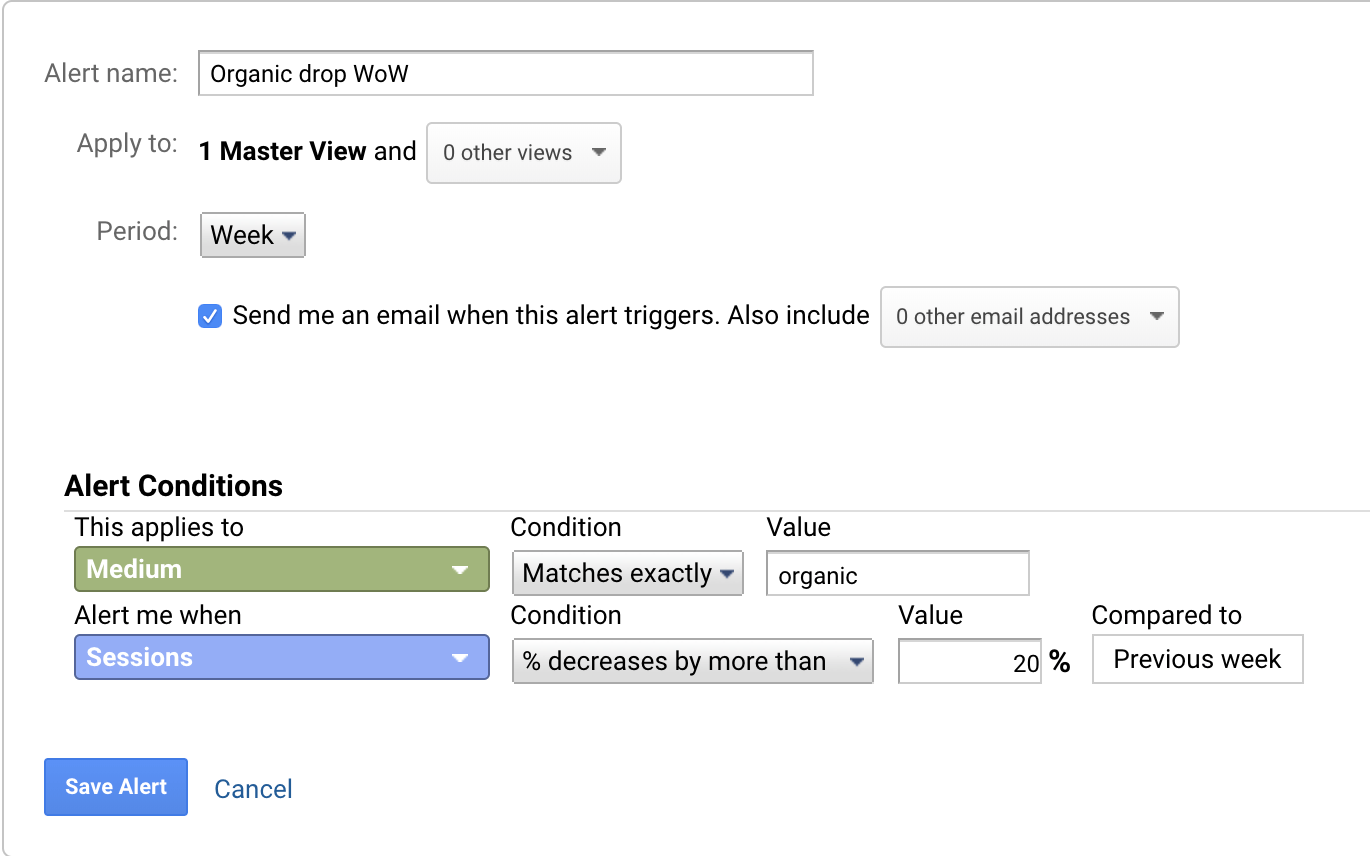
Hit “Save Alert” and you’re done.
Now, while the reason for monitoring traffic drops is obvious, you might be wondering why it makes sense to do this with traffic spikes?
Two reasons:
- If the traffic spike is legit, meaning that you’re driving more traffic from relevant keywords, you’ll want to replicate this with other pages.
- Search engines are not flawless. They might start ranking your pages for irrelevant keywords, and that’s something that you need to take into account for reporting.
You can set up these alerts globally across all the views that you have access to. Just select the views in the dropdown menu next to the main view where you’re setting it up.
6. Set up alerts for 404 errors
Let’s stick with monitoring and automatization for a little longer.
The “404 - Page Not Found” error is inevitable and something that you should monitor. And you can do this in GA.
First, make sure that all your 404 pages have a unified page title such as “404 - not found” or “Page not found.” Second, do not redirect them anywhere; the URL should stay the same.
If you meet these requirements, go ahead and set up an alert:
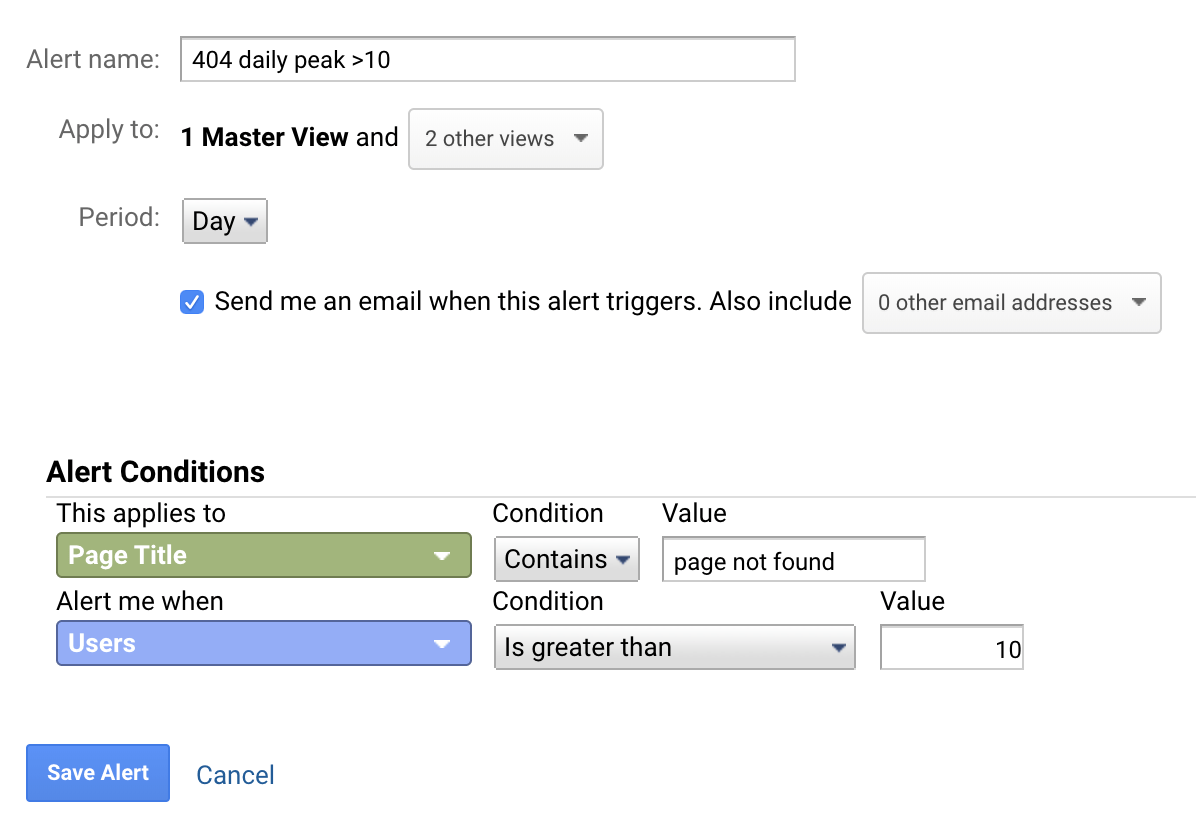
For the first condition, enter your page title for 404 pages.
For the second condition, start low and work your way up. That way, you won’t receive alerts if everything is normal. The bigger your site is, the bigger the number you should start with. Remember, some 404s are inevitable because of typos, so this number should be high enough to rule those out.
You now have everything you need for proper 404 alerts and monitoring.
From here, it’s just a case of figuring out what caused the 404. Was it a typo? Do you have internal or external links pointing to the URL?
Learn how to do this in our guide to fix broken links.
7. Use annotations to pinpoint issues and changes
Google Analytics annotations are notes that show up on every time chart in the tool.
How are they useful? For logging changes.
Perhaps you figured out the reason for a recent traffic drop? Or deployed a sitewide technical SEO change? Or maybe you’re testing a new title tag format?
Whatever the change, logging it with annotations will often help save your sanity down the line.
To do that, choose a relevant time frame, click the roll-down, and enter your note.

Another benefit of annotations is the ability to gauge the effects of changes more easily.
For instance, if you notice a sharp increase or decrease in traffic, you can look back at annotations to reverse-engineer potential catalysts. You can then replicate changes that led to positive outcomes and avoid repeating mistakes that led to adverse outcomes.
Google Analytics is a good servant but a bad master.
Making setup mistakes, looking at the wrong data, or misinterpreting what you see in reports are just some examples that lead to bad business and marketing decisions.
With that in mind, here are eight mistakes to avoid at all costs:
Mistake #1: Incorrectly set up Google Analytics tracking
Most people make mistakes when setting up Google Analytics. While some are more severe than others, even small ones can seriously affect the accuracy and usefulness of your data.
Here are a few of the most common:
- Missing tracking code;
- Multiple tracking codes on one page;
- Not using a referral exclusion list;
- Incorrectly set up interaction events;
- Tracking websites built on JavaScript frameworks with default settings.
If you suspect any of these issues on your site or aren’t confident in your setup, there are plenty of articles online to help. We’d also recommend investing in a professional consultation, audit, and setup if you can afford it.
Mistake #2: Deriving insights from insignificant samples
Don’t waste time trying to decide anything based on a statistically insignificant sample. Nobody ever managed to optimize a Facebook ads campaign by analyzing 37 visits.
Take one of the many free online “statistics 101” courses. It will almost certainly help you to make better decisions.
Mistake #3: Obsessively looking at data without purpose
We’ve all done it. You check one report, and two hours later you’re deep down the rabbit hole looking at something completely different.
Know why you’re doing what you’re doing and how you can get actionable insights out of it. Don’t obsess over looking at data all the time.
Mistake #4: Tracking for the sake of tracking
Learning how to track complicated custom events accurately definitely feels like a win. That’s until you realize you’re now tracking dozens of them, and not doing anything with the data. Been there, done that.
Mistake #5: Not knowing what the data represents
“This landing page sucks because the average time on page is only 11s.”
Eleven seconds indeed sounds bad. But no-one who knows how this metric is calculated would say this.
Why? Because average time on page is based on timestamps between GA hits. This means that any bounced session is calculated as zero seconds long. On top of that, this metric doesn’t take into account inactivity, which skews the data a lot given the number of opened inactive tabs we all have. Being totally honest, this is a pretty useless metric, yet it’s in many reports by default.
Mistake #6: Not looking at granular data
There are very few, if any, scenarios where you can derive actionable insights from a default report. Always apply filters, segments, and secondary dimensions to find root causes.
Mistake #7: Overlooking Google Analytics sampling issues
When looking at an extended timeframe or comparing complex data, make sure it’s based on a 100% sample size. You’ll see the green shield icon next to the report name if it is.
![]()
![]()
For sampled results, the icon turns yellow.
While it’s fine to work with a 95% sample, don’t even try to make conclusions from tiny samples like this:
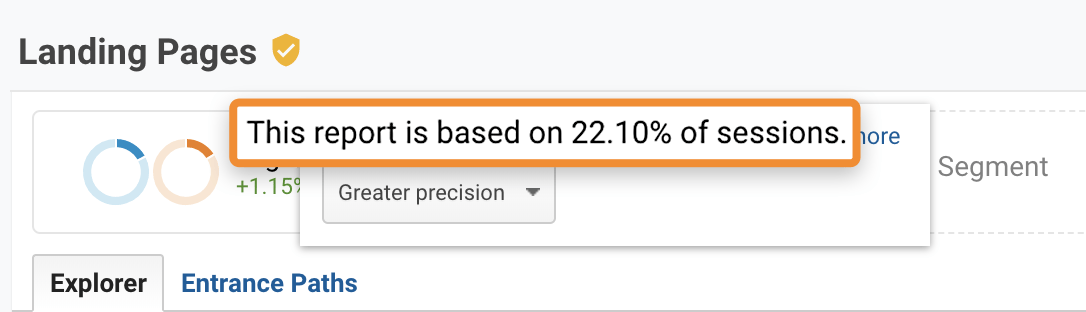
Choose a shorter period or a less complex query if you encounter something similar.
Mistake #8: Not taking ad blockers into account
There’s one thing that always amazes me at marketing conferences—the number of hands up in the air whenever a speaker asks about how many people use ad blockers. (Yeah, marketers are hiding from their own work.)
You can’t be surprised at the popularity of ad blockers. We’re being hit by often awful ads all the time.
The point is, the vast majority of ad blockers block Google Analytics. On top of that, browsers are also enforcing more and more privacy policies. That results in blocking GA completely (Brave) or rapidly shortening cookie expiry time (Safari), which leads to even more problematic attribution.
No matter what you do, you’ll always be missing a significant proportion of data.
So, always take the data in Google Analytics with a grain of salt.
Final thoughts
One of the biggest SEO challenges is to show its value and make data-driven decisions. It takes more effort than let’s say search ads where you can directly track and influence everything immediately.
For that reason, if you only take one thing away from this guide, it should be to use critical thinking when looking at data—always.
If you want to learn more about Google Analytics without running into misinformation, start with these blogs and resources:
- Official Analytics Academy courses
- Occam’s Razor by Avinash Kaushik
- Simo Ahava’s resources
- Analytics Ninja blog
- Analytics Mania by Julius Fedorovicius
Did I miss any useful ways to use Google Analytics to improve SEO? Do you have any questions? Ping me on Twitter!