
It might look like a relatively standard post, but we strategically created it to attract links from an outreach campaign.
And it worked. We sent 515 emails and got 36 backlinks from 32 websites.
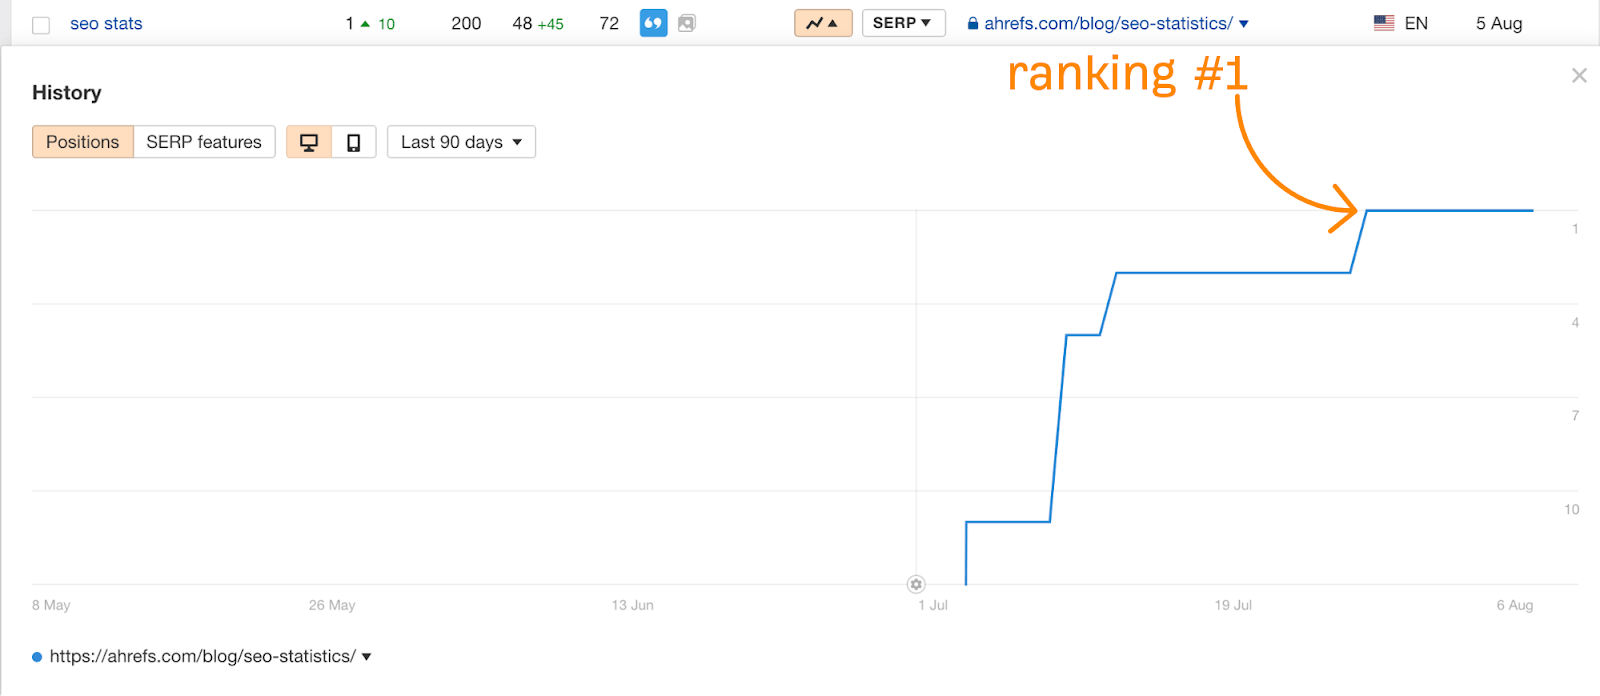
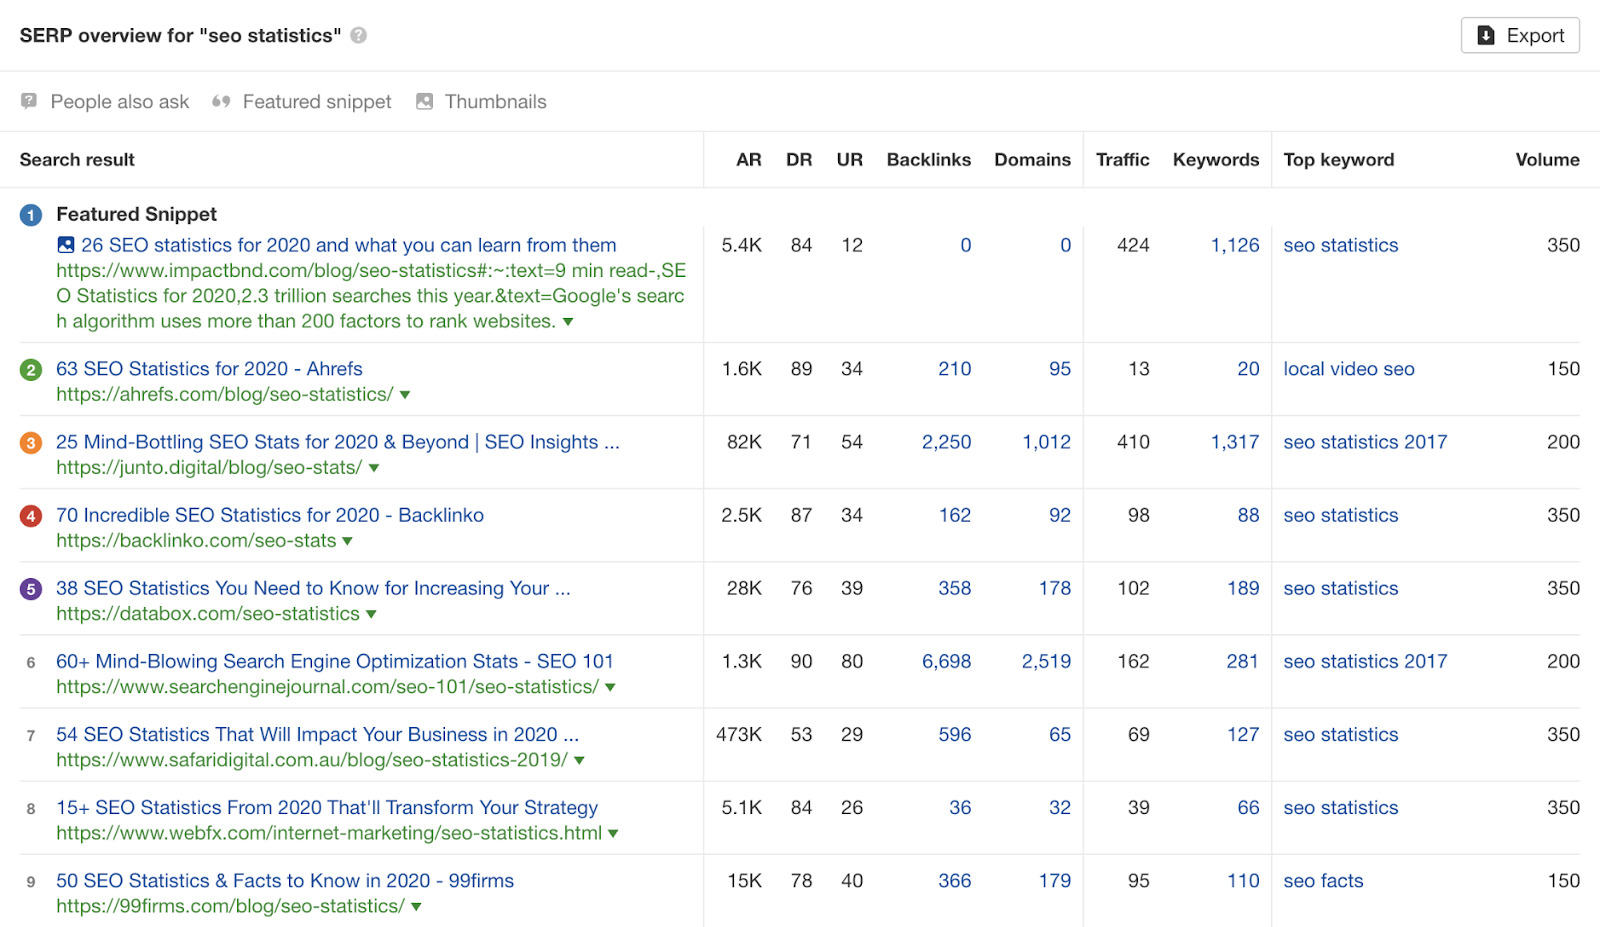
The post now ranks #1 for “SEO stats”:
In this guide, you’ll learn:
- Why we chose a statistics page
- How we created the page and built links to it
- Detailed results from our campaign
- How we could have improved our results
Head over to our list of SEO case studies.
You’ve probably heard of the Skyscraper Technique. It’s a link building tactic where you find a page with lots of links, create something “better,” then pitch your new and improved resource to those linking to the now inferior page.
It can work for any type of content, but we had a theory that it might work particularly well for statistics pages because:
- Statistics pages tend to have a lot of links
- Statistics pages are often outdated
- Statistics are often sloppily updated
Let’s delve a bit deeper into why each of these things matter.
1. Statistics pages tend to have a lot of links
Every ‘skyscraper’ campaign starts with a page or pages that have tons of links. And if you search Google for statistics pages about any popular topic, you’ll almost always see that the top-ranking pages have tons of backlinks.
Just look at the results for “youtube statistics”:
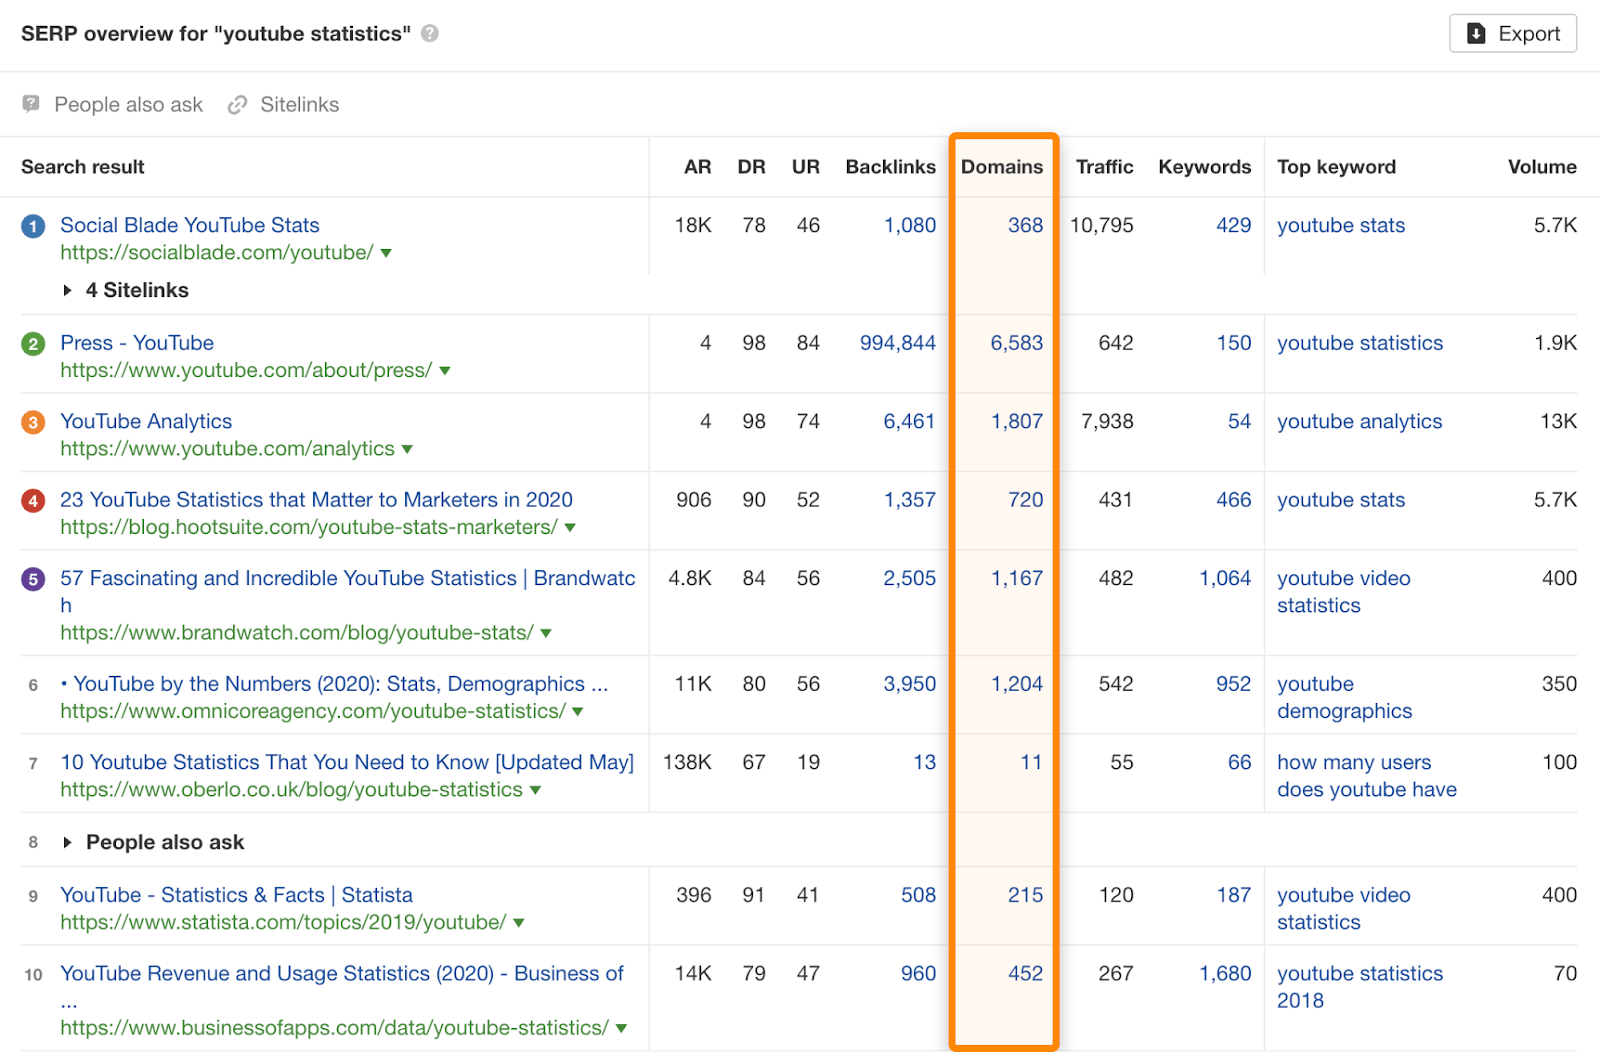
There are multiple pages here with links from thousands of websites.
This usually happens because bloggers and journalists often cite statistics from these pages in their posts.
For example, look at this post from Shopify about starting a YouTube channel for your business:
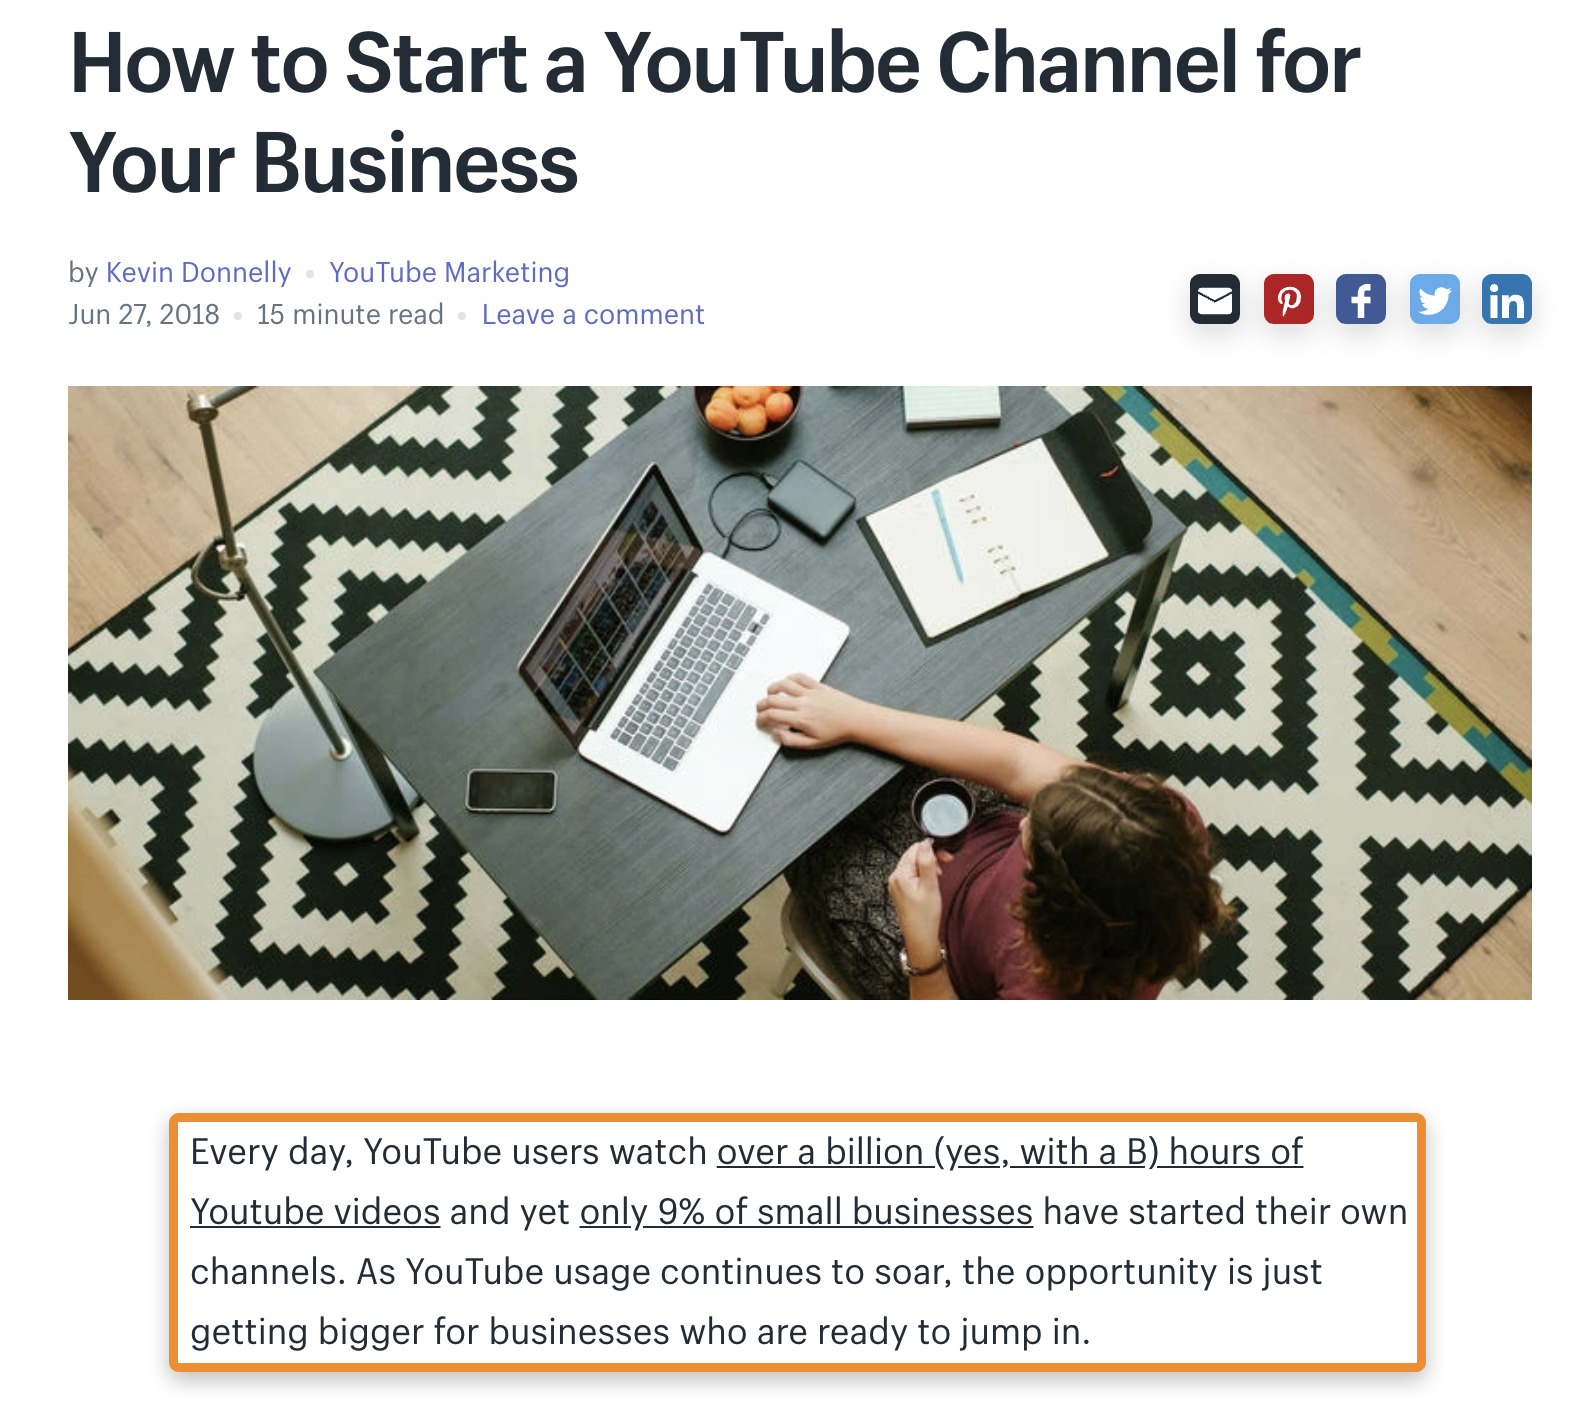
The writer cites two statistics in the first paragraph and links to his sources, one of which is a curated list of YouTube statistics. It’s highly likely that he came across this post while doing research for his article, found a useful statistic, then cited and linked to the source.
2. Statistics pages are often outdated
Most statistics pages are rarely updated and often feature outdated and inaccurate statistics as a result.
Here’s just one example:
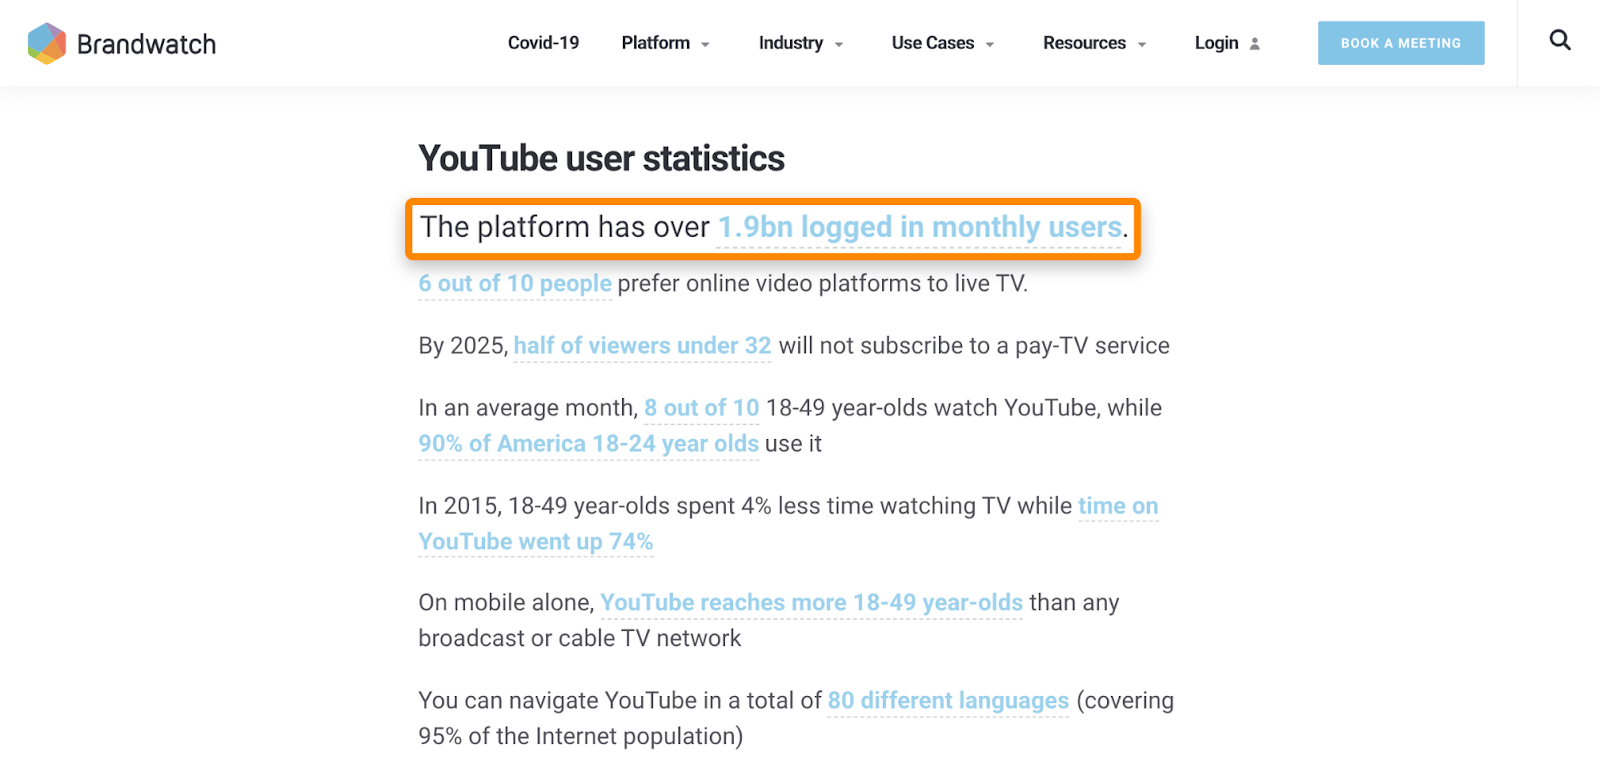
If we look at the source of that statistic, it takes us to YouTube’s Press page. Here, it says there are over two billion monthly YouTube users instead of the cited 1.9 billion.
That’s an issue because it leads bloggers and journalists to cite outdated statistics.
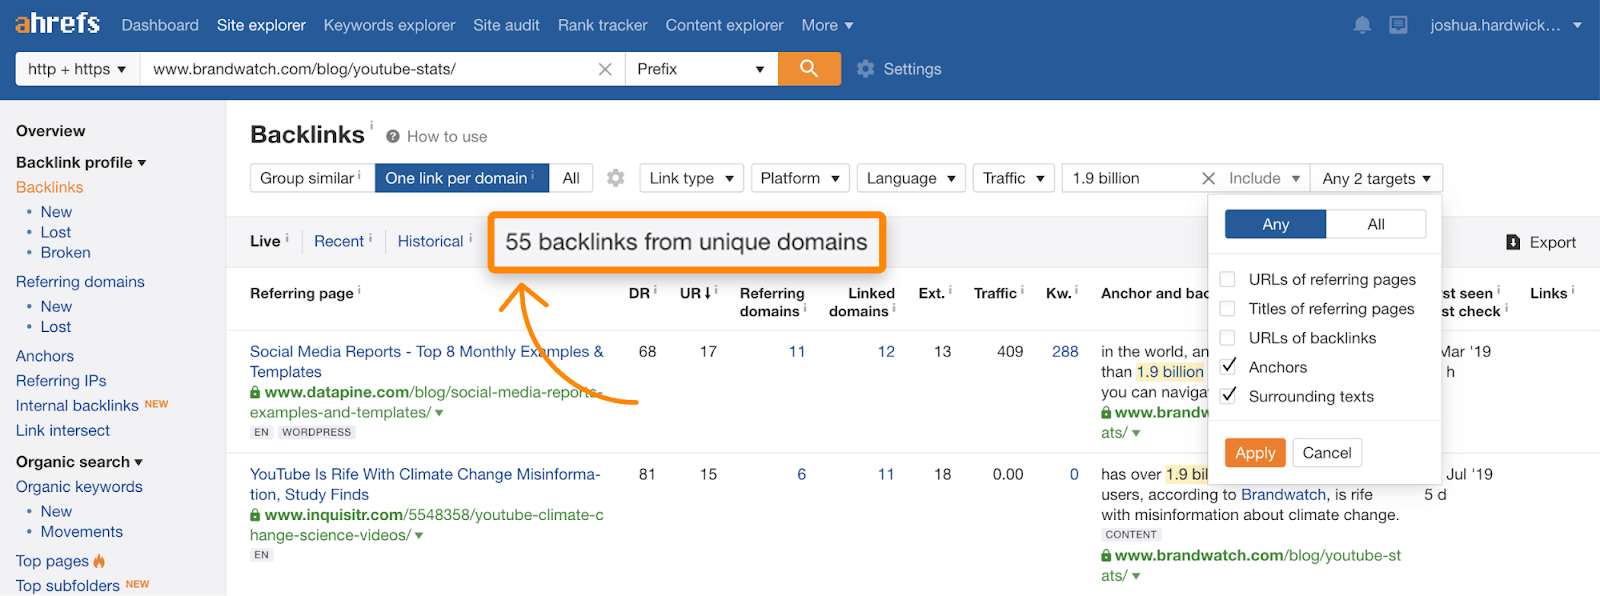
For example, if we check the Backlinks report for this page in Site Explorer, search for “1.9 billion” in the link anchors and surrounding texts, and toggle the “one link per domain” switch, we see 55 websites citing the outdated statistic and linking to the page.
3. Statistics pages are often sloppily updated
Even when people do update their statistics pages, they don’t always do it well. One of the common mistakes they make is removing outdated statistics from the page without replacing them with updated ones.
The problem here is that when statistics get removed, the citations and links remain.
For example, let’s check the Anchors report for the list of YouTube statistics in Site Explorer. Many referring pages cite a statistic about YouTube being the third most visited site on the web. However, if we search the page itself for that statistic, it’s nowhere to be found.
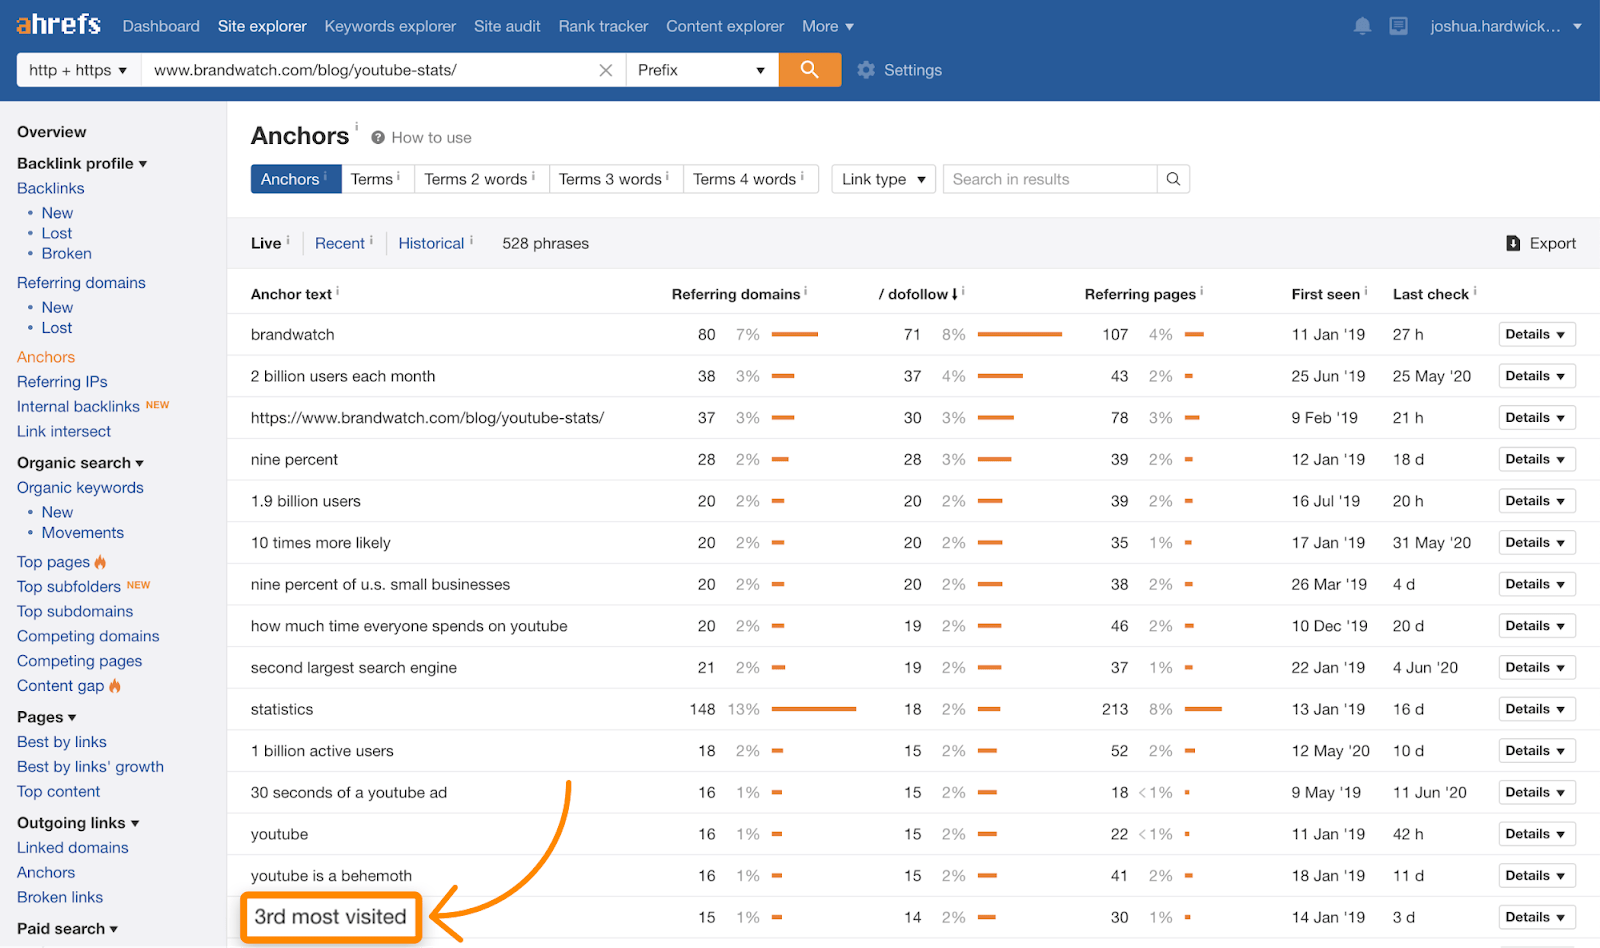
That’s because the author updated the page and removed that statistic.
You might already have a rough idea where we’re going with this. If that’s not the case, don’t worry. We’re going to go through the entire process below.
Here’s what we did:
- Found a winning topic
- Found link prospects
- Narrowed down the link prospects
- Created the statistics page
- Found contact information and vetted prospects
- Wrote and sent outreach emails
Step 1. Find a winning topic
From the start, we knew we wanted to create a statistics page about SEO or online marketing because that’s what our site is about. However, we didn’t yet have a definitive topic in mind, so we first needed to do some research.
To start, we searched in Ahrefs’ Keywords Explorer for keywords related to our business like SEO, search engine optimization, content marketing, etc.

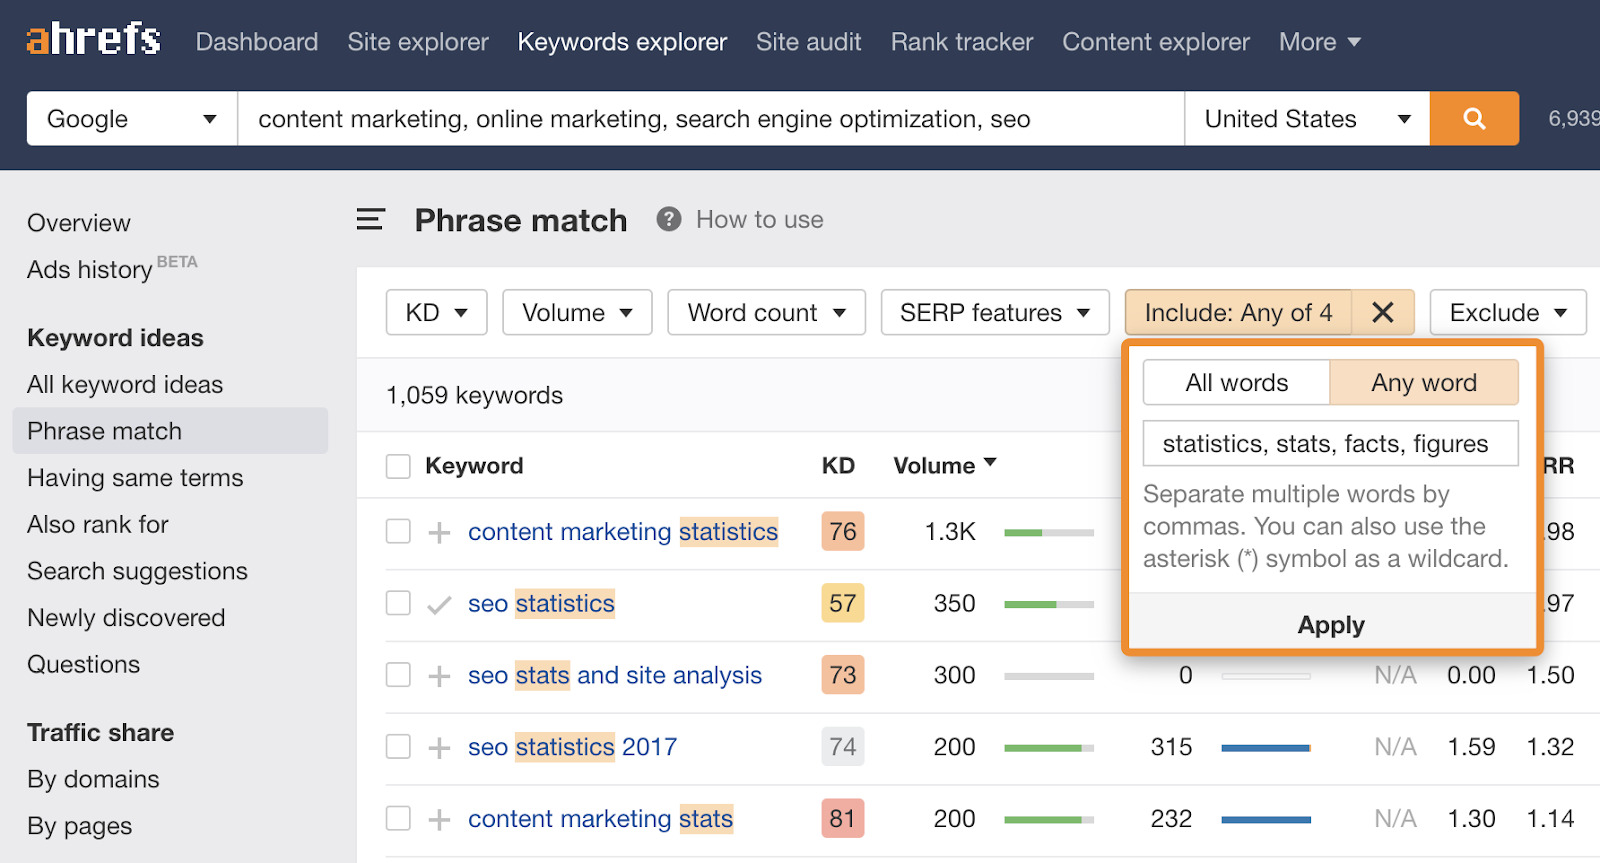
From there, we went to the Phrase match report and used the “Include” filter to find keywords containing words like statistics, stats, facts, and figures.
This gave us a bunch of ideas, but we needed to narrow them down to those with top-ranking pages that had lots of backlinks. For this, we used the Keyword Difficulty filter to exclude all low-difficulty keywords.
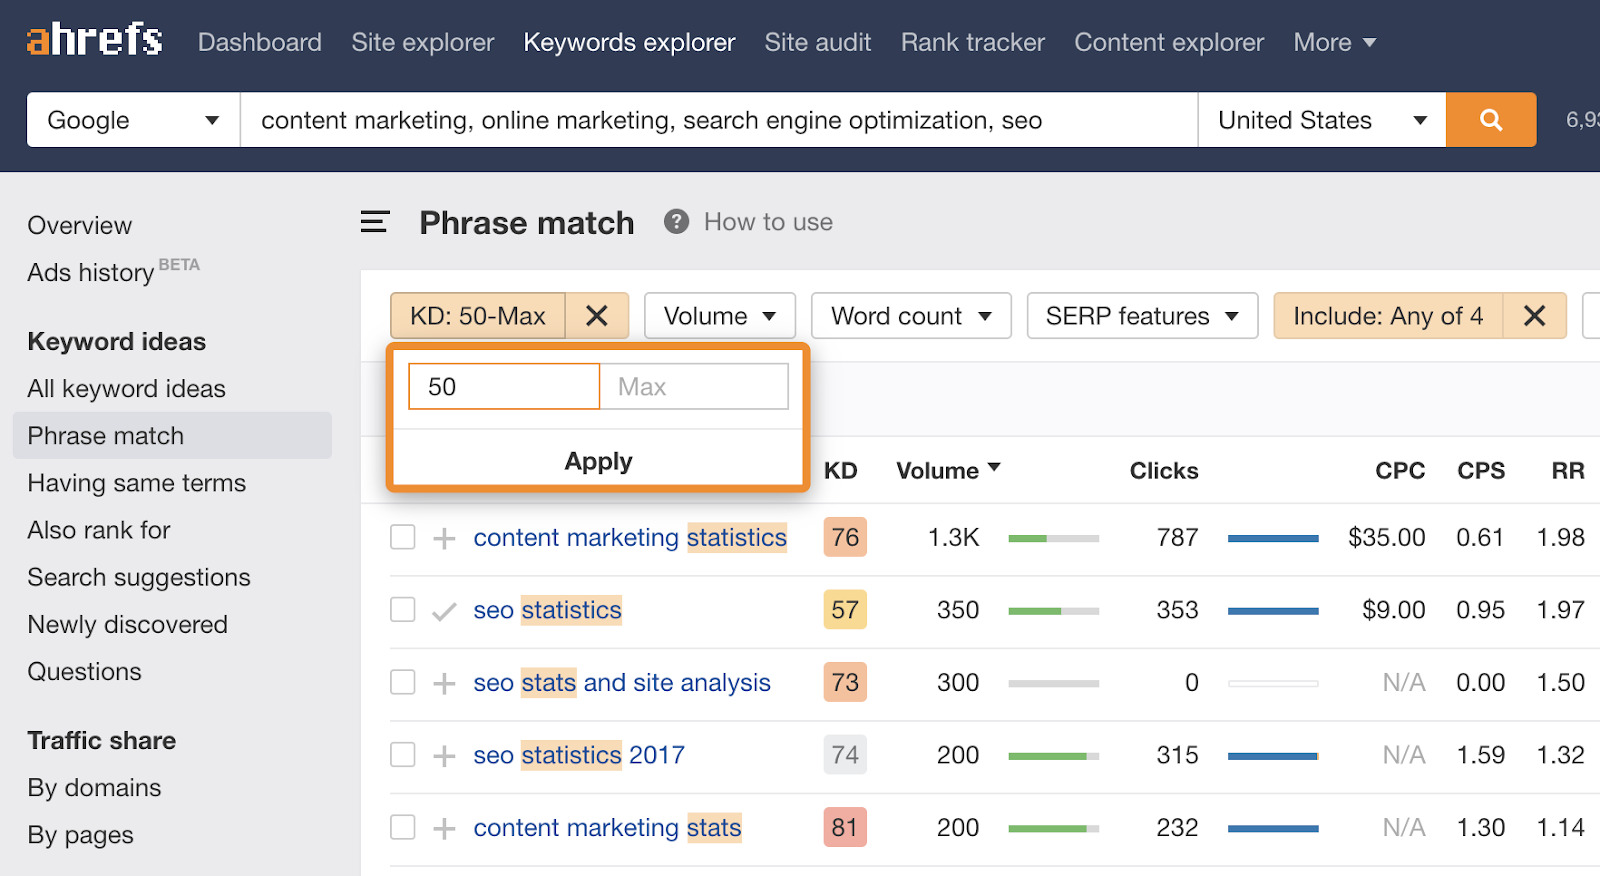
If you’re wondering why we used the Keyword Difficulty filter for this, it’s because the metric is based on the average number of referring domains to the current top-ranking pages. If a keyword has a high KD score, it usually means the top-ranking pages have links from many websites.
This narrowed down things quite substantially, but there were a few ideas left, the most relevant of which was “SEO statistics.”
Finally, we checked the SERP overview to ensure that the top-ranking pages were mostly curated statistics pages. It was pretty easy to tell if this was the case from the page titles.
Step 2. Find link prospects
If we were running a “shotgun” campaign here, finding link prospects would be simple. We’d just download the full list of backlinks to each competing statistics page, write any old post, then blast out the same outreach email to everyone.
This would likely say something generic and vague like “Hey, saw you linked to this stats page. Ours is better. Maybe swap out the link?”
This is the typical “Skyscraper” approach, and it’s not something we like. We’ve all been on the end of these types of outreach emails before. They’re spammy, unhelpful, and annoying.
So here’s what we did instead:
First, we went back to the SERP overview for “SEO statistics” and looked for the curated stats page with the most backlinks.
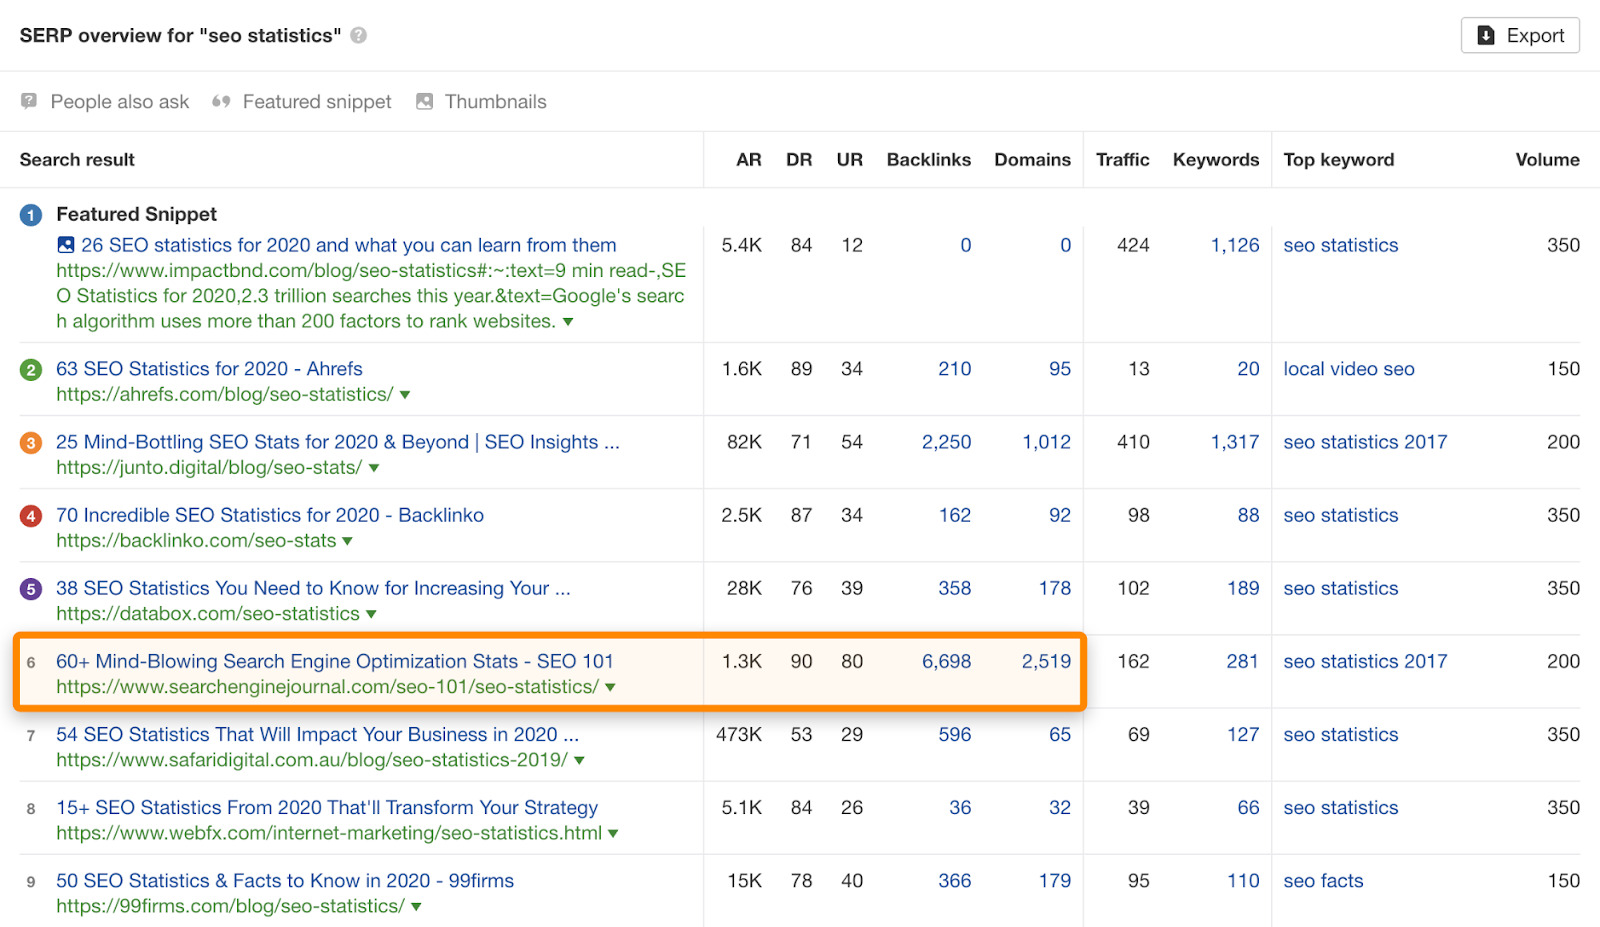
Second, we analyzed this page to see which statistics were responsible for the most backlinks.
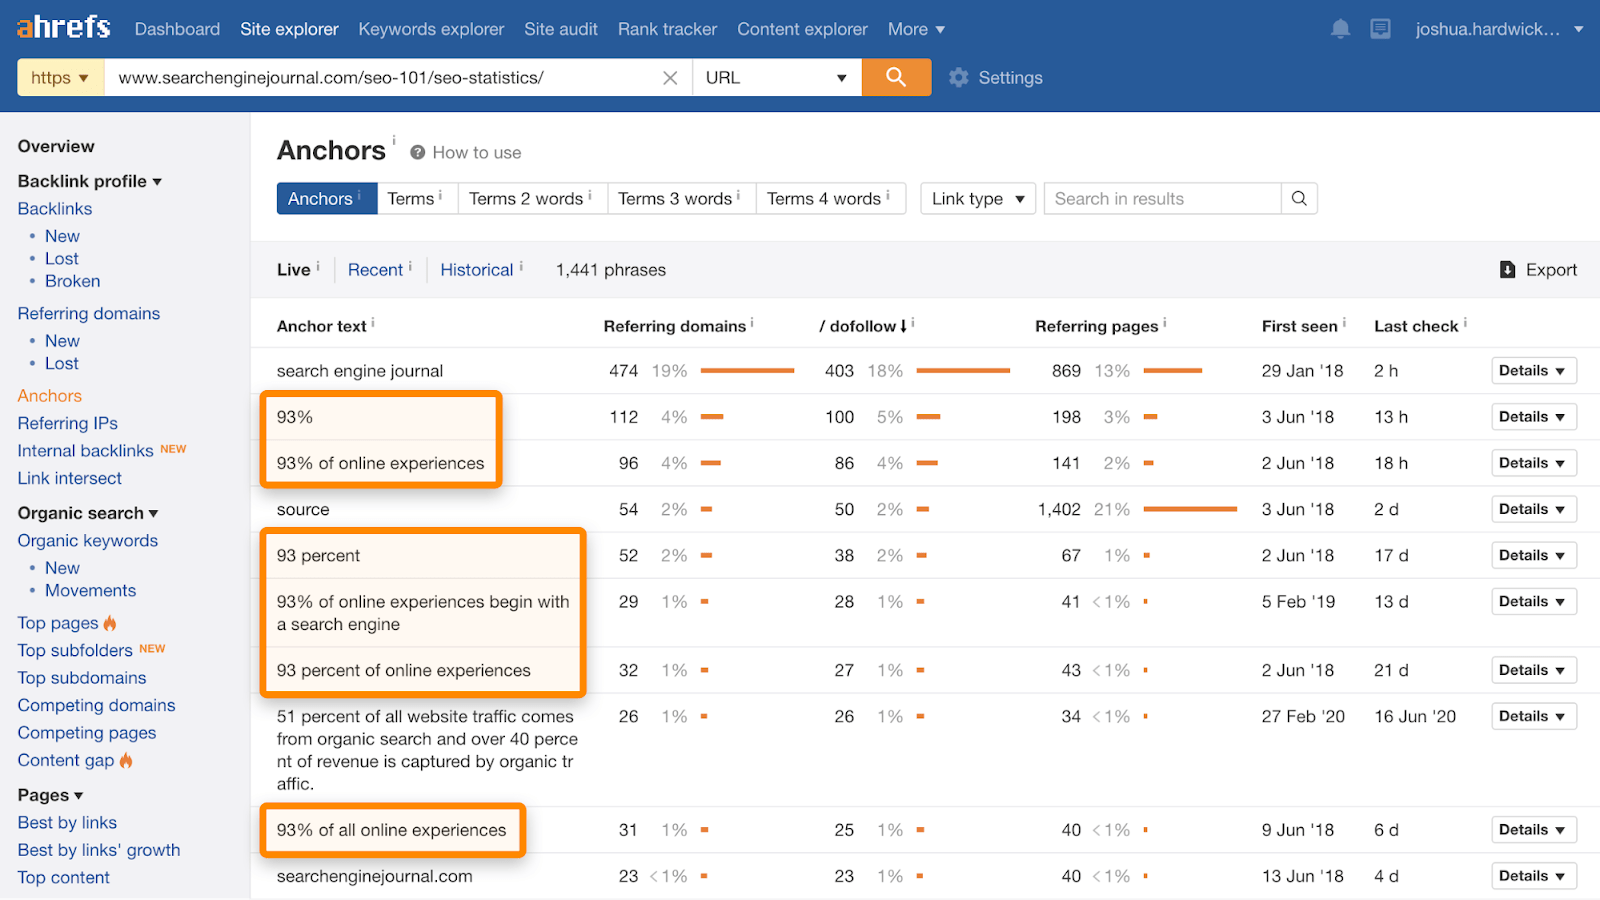
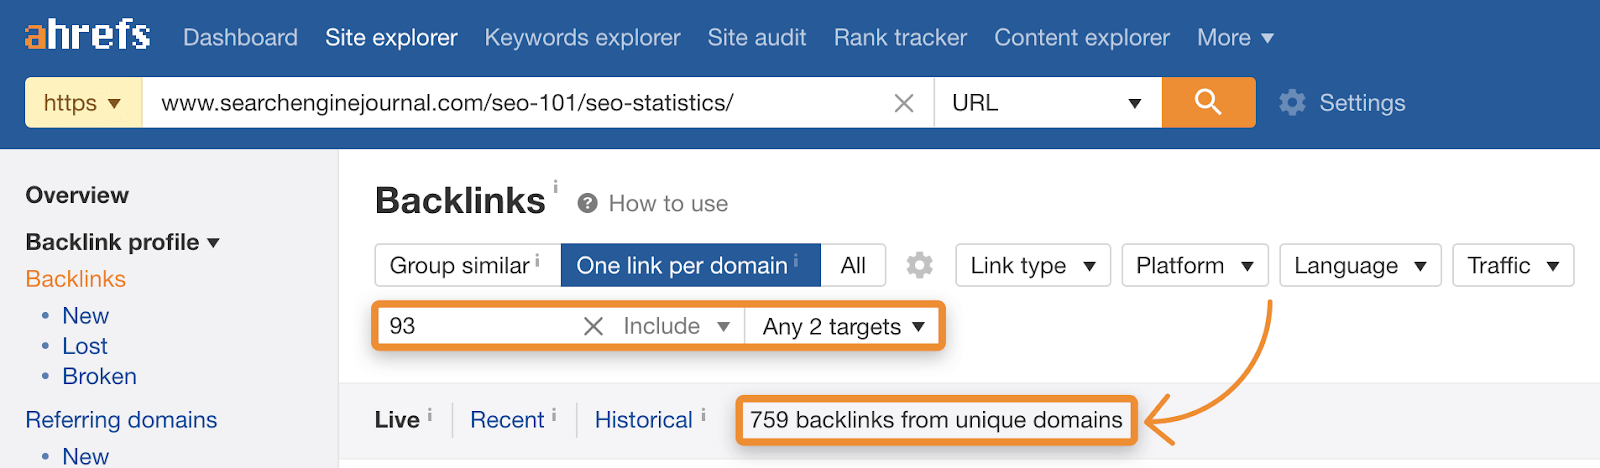
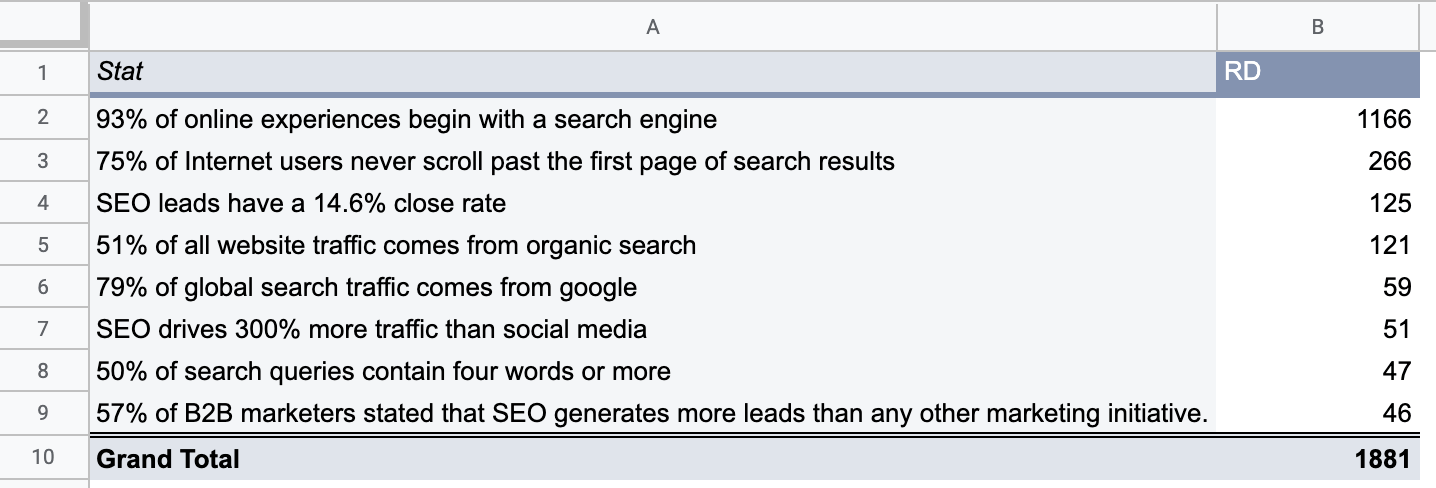
To do this, we opened up the Anchors report for the page in Site Explorer and looked for frequently mentioned stats. Right away, we saw a lot of links referencing how 93% of online experiences begin with a search engine.
We recorded this in a spreadsheet and then continued looking through the report until we had a few popular statistics.
Next, we wanted to tick off two checkboxes for each statistic:
- Are there enough people linking because of this statistic?
- Can we justify a good reason for them to link to us instead of, or in addition to the current page?
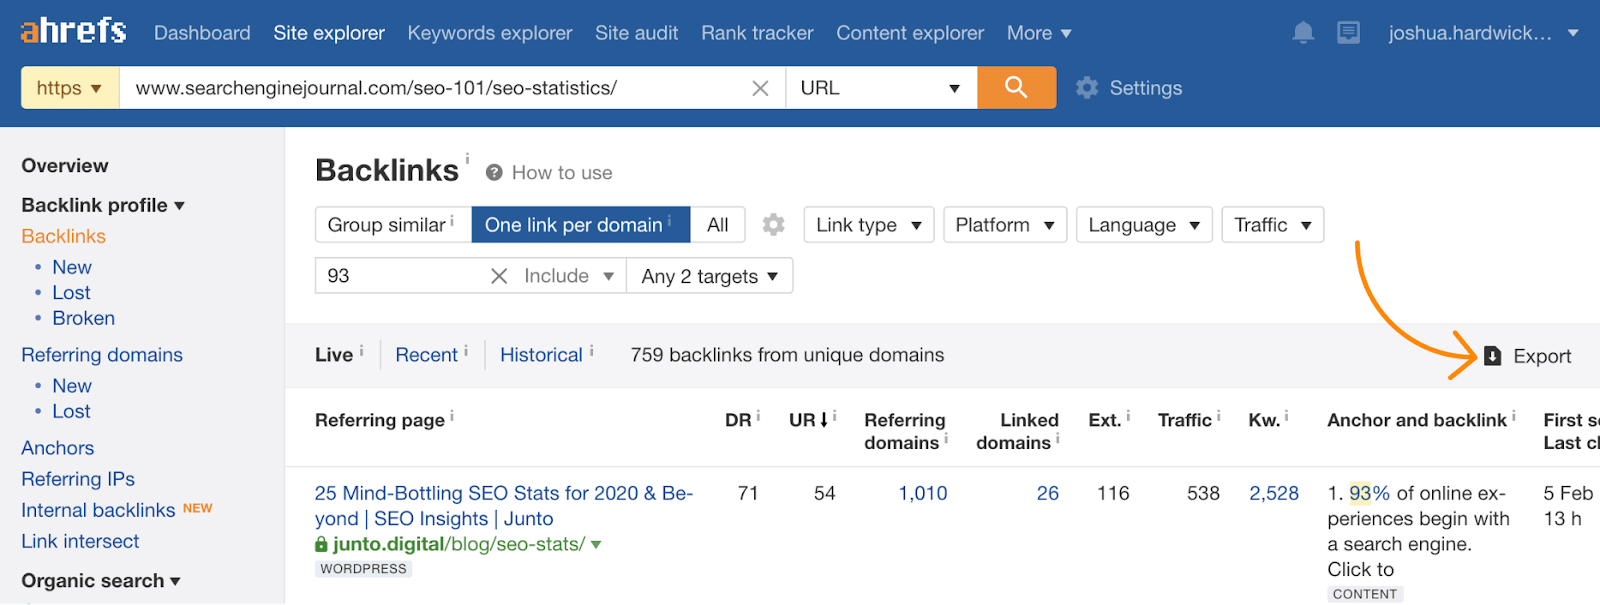
To do this, we first went to the Backlinks report for the page, toggled the “one link per domain” filter, then searched for each statistic in the link anchors and surrounding texts.
For the “93%” statistic, over 700 websites were linking to the page.
That’s the first box checked.
Next, we needed to see if there was a good reason to contact those people, so we opened up the stats page and went through this process:
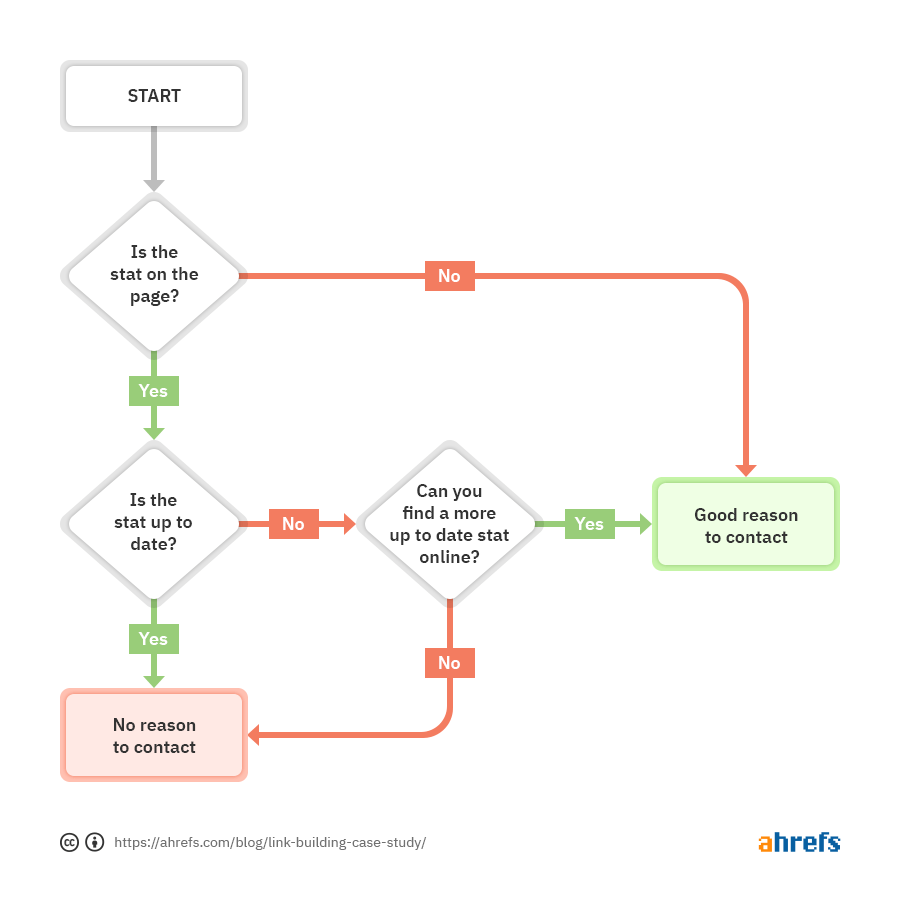
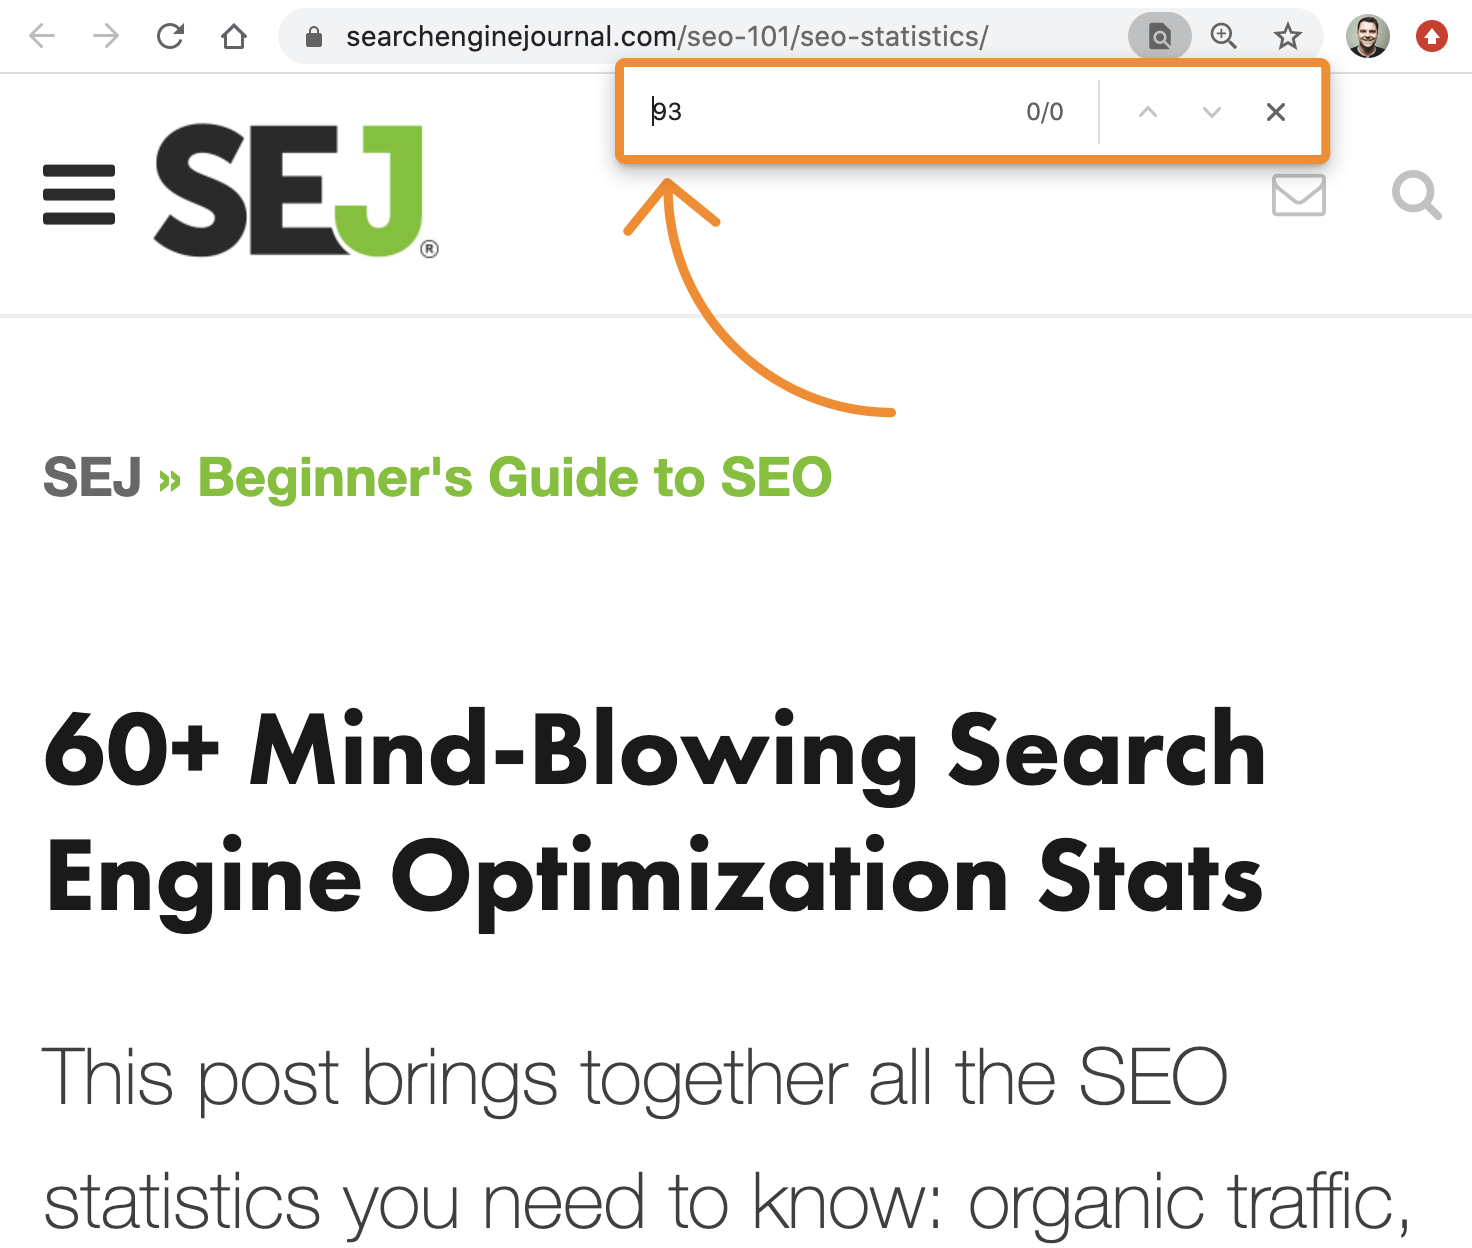
For the “93%” statistic, we saw that it wasn’t even mentioned on the page.
For most of our other statistics, they were still on the page, but when we checked their sources, we noticed that many were old and outdated. Wherever this was the case, we scoured the web for an updated statistic.
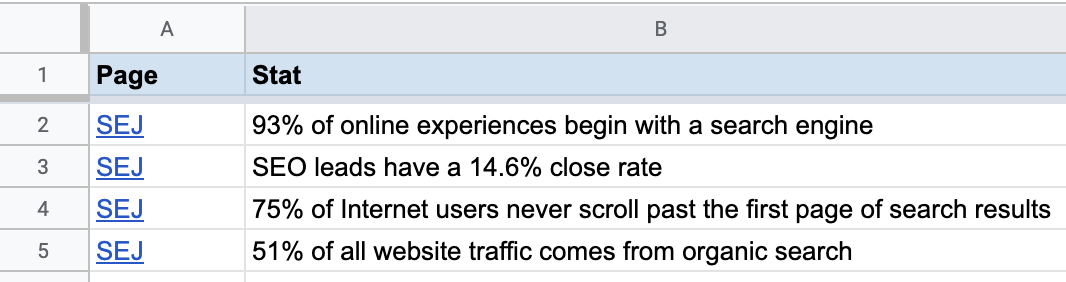
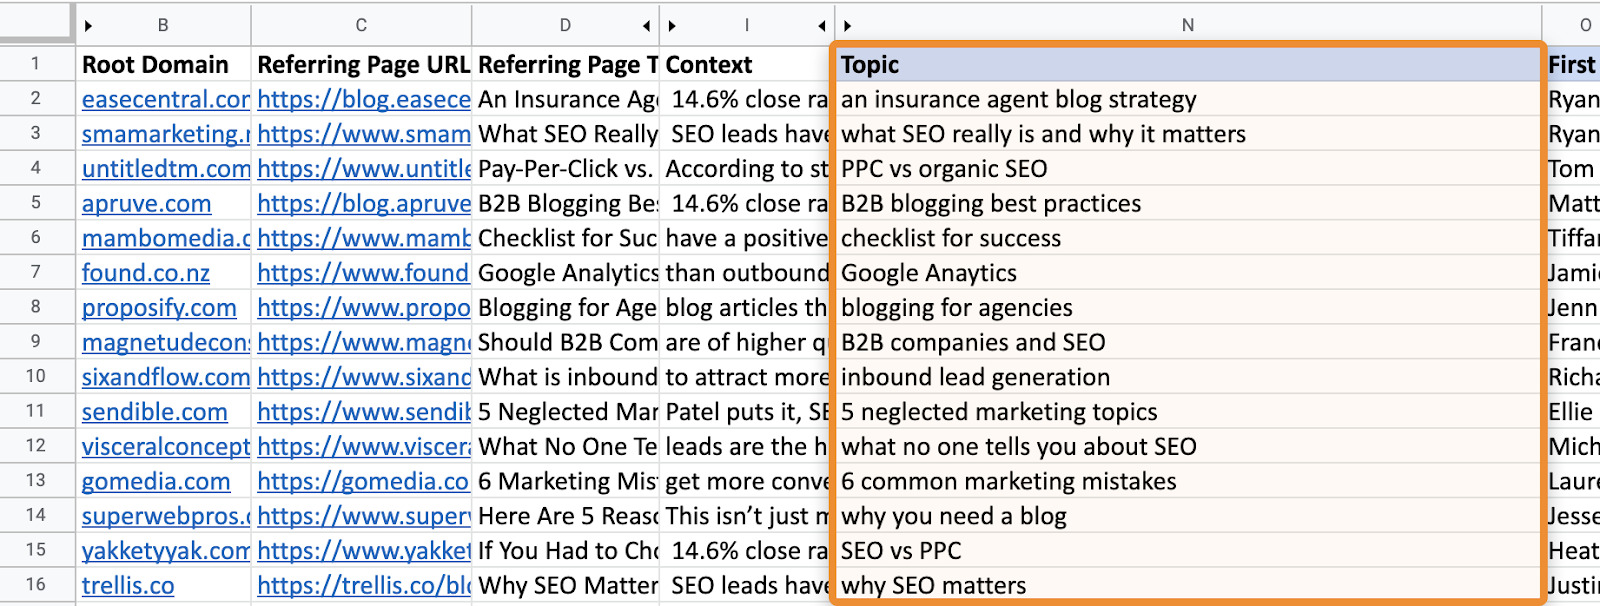
Everything was then recorded in a spreadsheet to give us something that looked like this:
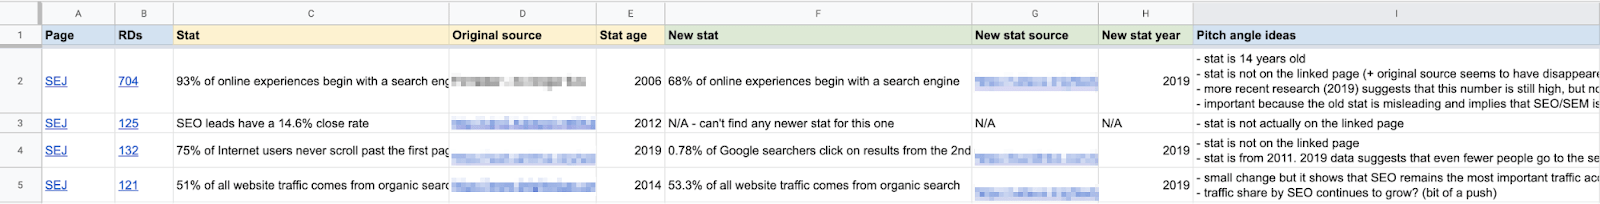
- Column A: The URL of the statistics page (where we found the statistic).
- Column B: The number of linking referring domains citing the statistic (we also linked this to the filtered report in Site Explorer for easy access).
- Column C: The statistic itself.
- Column D: The original source of the statistic (if we could find it).
- Column E: The age of the statistic.
- Column F: The newer statistic (where applicable).
- Column G: The source of the new statistic.
- Column H: The age of the new statistic.
- Column I: Notes and pitch angle ideas, such as whether the statistic was outdated or missing from the page.
Next, we repeated this entire process for the rest of the top-ranking statistics pages until we had thousands of prospects based on eight statistics.
Finally, we downloaded all of the relevant prospects for each statistic and page from the Backlinks report, then imported them into Google sheets and labeled each URL according to their segment.
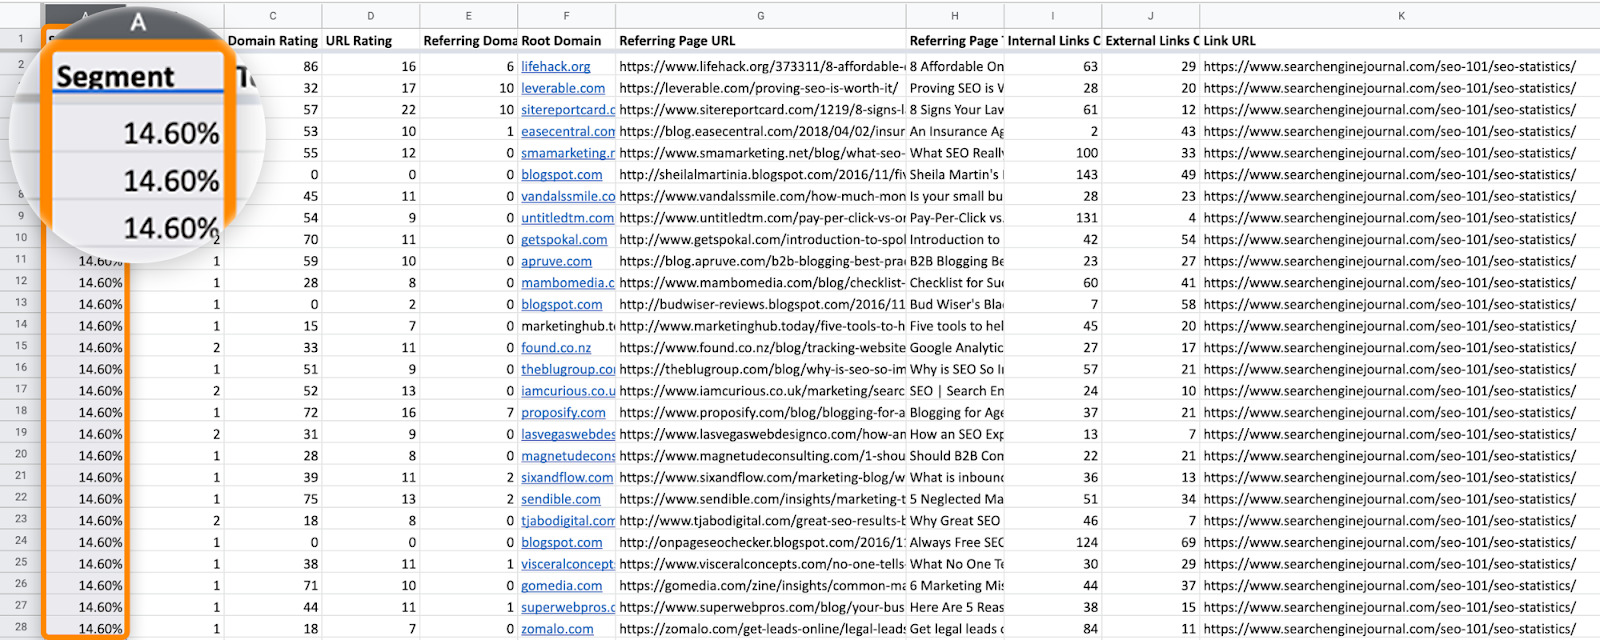
In total, we had 1,986 unvetted URLs.
Step 3. Narrowing down link prospects
Despite having a reason to reach out to 1,900+ prospects, we didn’t want to reach out to low-quality websites for obvious reasons. So our next task was to clean up our list of prospects.
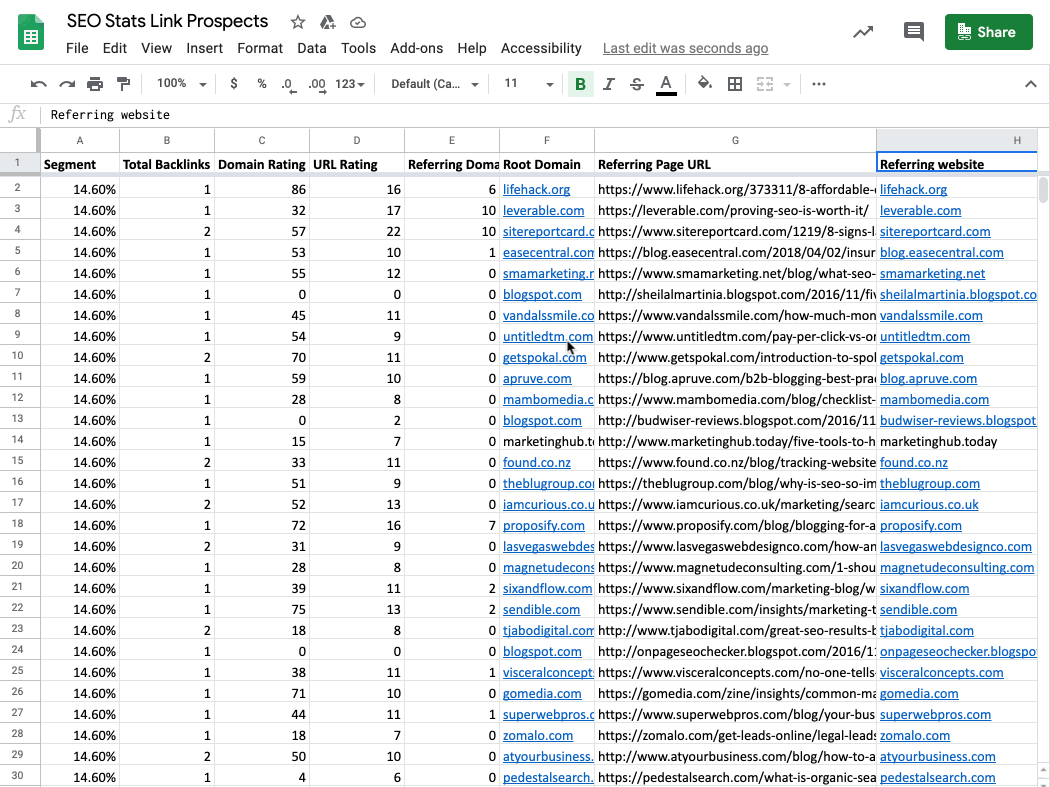
The first step was to deduplicate URLs from the same domain since websites could potentially be linking to more than one statistics page. And we didn’t want to reach out to the same site twice.
This was easy enough to do. We just added a column for the referring website and used a tool like this one to extract the root domains in batches. Then we pasted them into our sheet.
We then used the built-in functionality to remove duplicate domains.
The second step was to remove prospects linking to the statistics pages with nofollow, UGC, or sponsored links. To do this, we filtered the “Type” column and removed the rows.
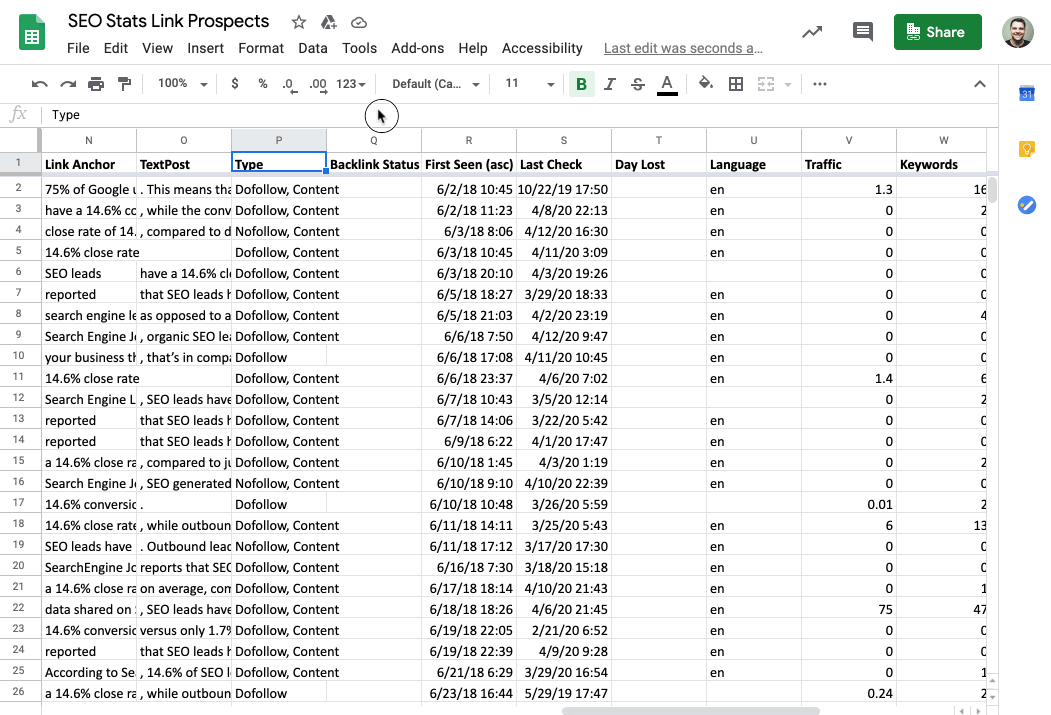
The final step was to exclude websites without a lot of traffic. To do this, we pulled domain-level traffic for all prospects using the Ahrefs API and the script editor in Google Sheets.
If you’re following along and don’t have an API subscription, you can use our Batch Analysis tool instead. Just paste in up to 200 domains at a time and set the target mode to domain with all its subdomains.
You can then export the file and run a VLOOKUP against the root domains.
By the end of this process, we had 902 prospects remaining in our sheet.
Step 4. Create the statistics page
The reality of statistics pages is that it’s tough to make one that stands out from the crowd. However, we did three main things to make ours the “best” SEO statistics page:
- Included popular statistics from other pages
- Included other interesting statistics
- Grouped statistics by category
Let’s go through why these things are important.
Including popular statistics from other pages
We included each statistic that helped other similar pages earn lots of links in our post. If the statistic was outdated, we found and added a more recent one.
Part of the reason we did this was to tie our page back to our link building campaign. However, we also realized that these were the statistics people found most useful. How do we know? Because they’re the ones that bloggers and journalists frequently cited in their posts.
Including other interesting statistics
The statistics on our page didn’t all tie back to our link building campaign. We made an effort to find and include others that seemed interesting.
However, we didn’t want to include any outdated statistics, so we made an effort to hunt down the original source for each statistic we wanted to include. If we couldn’t find the source or realized that it was outdated, we looked for an updated one.
This might sound like a small thing, but it’s actually a huge issue with most lists of statistics.
For example, the “93%” statistic we found earlier comes from a 2006 report.
Grouped stats by category
People don’t consume lists of statistics like they would a regular blog post. Most are just looking for curated information to add to their posts to support their claims. For that reason, we needed to make our post organized and easy to digest.
To do this, we grouped the statistics into categories and added jump links to the introduction.
We also listed the most cited SEO statistics under the “top SEO statistics” section at the start of the post. This made it easier for people to find the most frequently cited and interesting statistics.
Step 5. Find contact information and vet prospects
Having published our list of SEO statistics (and noindexed the page), we were almost ready to do some outreach and build some links. But first, we needed to find contact information for our prospects.
If you’ve read our guide to link building at scale or watched our video on the same topic, then you’ll know that we’re fans of using APIs and automation for this.
With that in mind, here’s what we did:
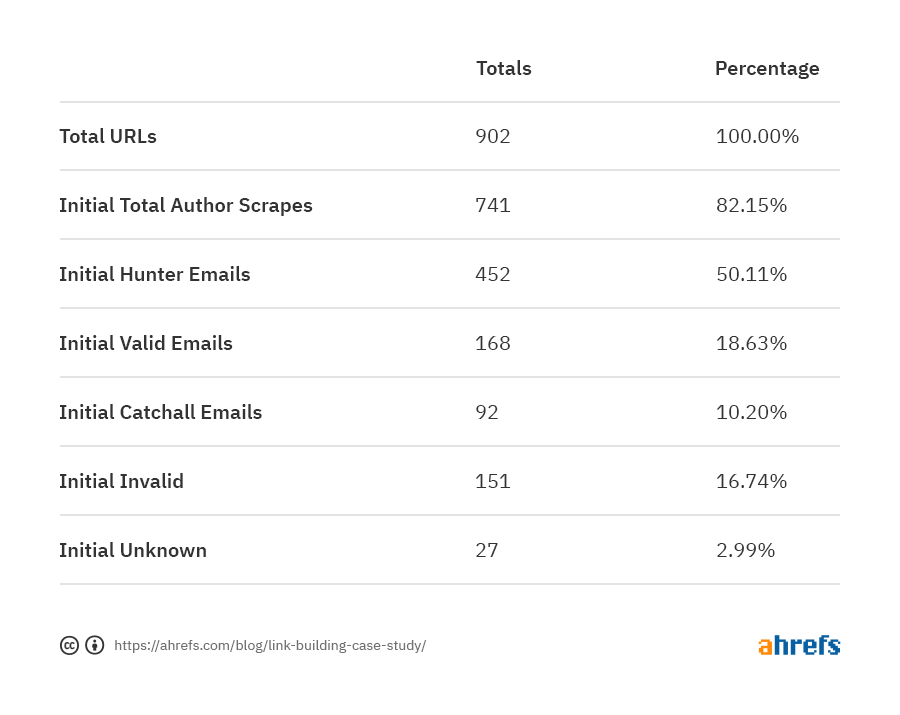
- We ran all the URLs through a custom tool to scrape as many author names as possible. It was far from perfect, but we ended up with 741 names nonetheless.
- We took those names and ran them through Hunter’s API to search for an email address. Hunter sent back 452 email addresses. That’s around a 60% hit rate.
- We ran these email addresses through NeverBounce’s API to see which of them were deliverable.
After around 30 minutes of automation, we had 168 valid emails, 92 catchalls that needed some manual intervention, and 178 emails that were not deliverable.
For valid emails, all we had to do was check that the pages were of decent quality. Vlad, one of our team members, handled this process. He spent a few hours each week vetting prospects and finding missing contact information.
Here’s a simplified version of the vetting process he went through:
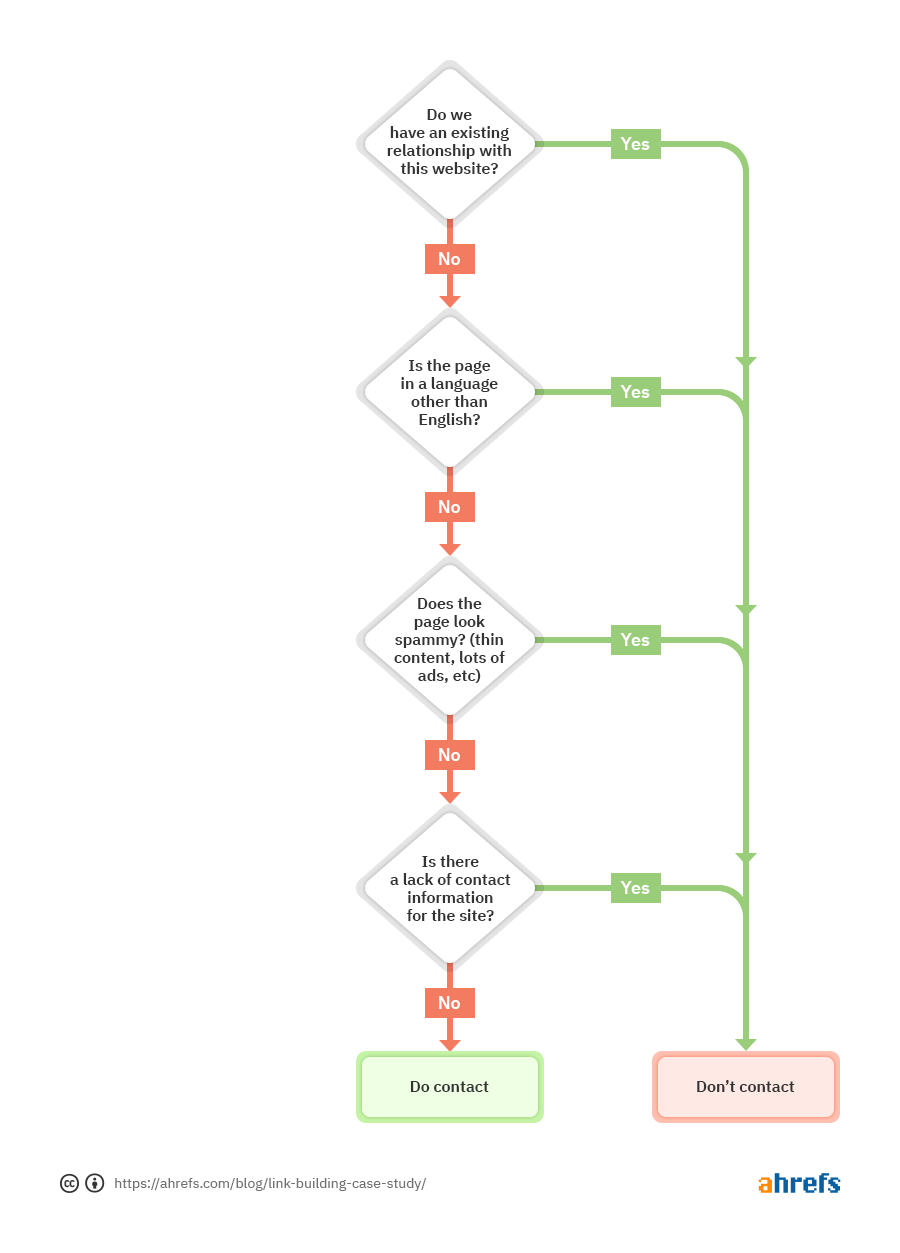
He then tagged all prospects in the spreadsheet, which left us with 515 sites ready to pitch.
He also made a note of what the linking pages were about.
Step 6. Write and send the outreach emails
Before hitting send, the final step of the process was to write our outreach templates and create personalization fields for each prospect.
Our idea here was to personalize emails based on the statistic referenced by each prospect.
Here’s what we came up with:
Hi [First name],
I saw you mentioned how [Stat] on your page about [Page topic].
[Pitch]
We published this and a few other fresh SEO stats here: https://ahrefs.com/blog/57-seo-statistics-for-2020/
Not sure if you’re actively editing posts, but might be worth an update if you are? No pressure 🙂
Cheers,
Vlad
The first three personalization fields were simple enough as we already had this information in our spreadsheet.
For the pitch, we wrote eight custom paragraphs based on the mentioned statistics.
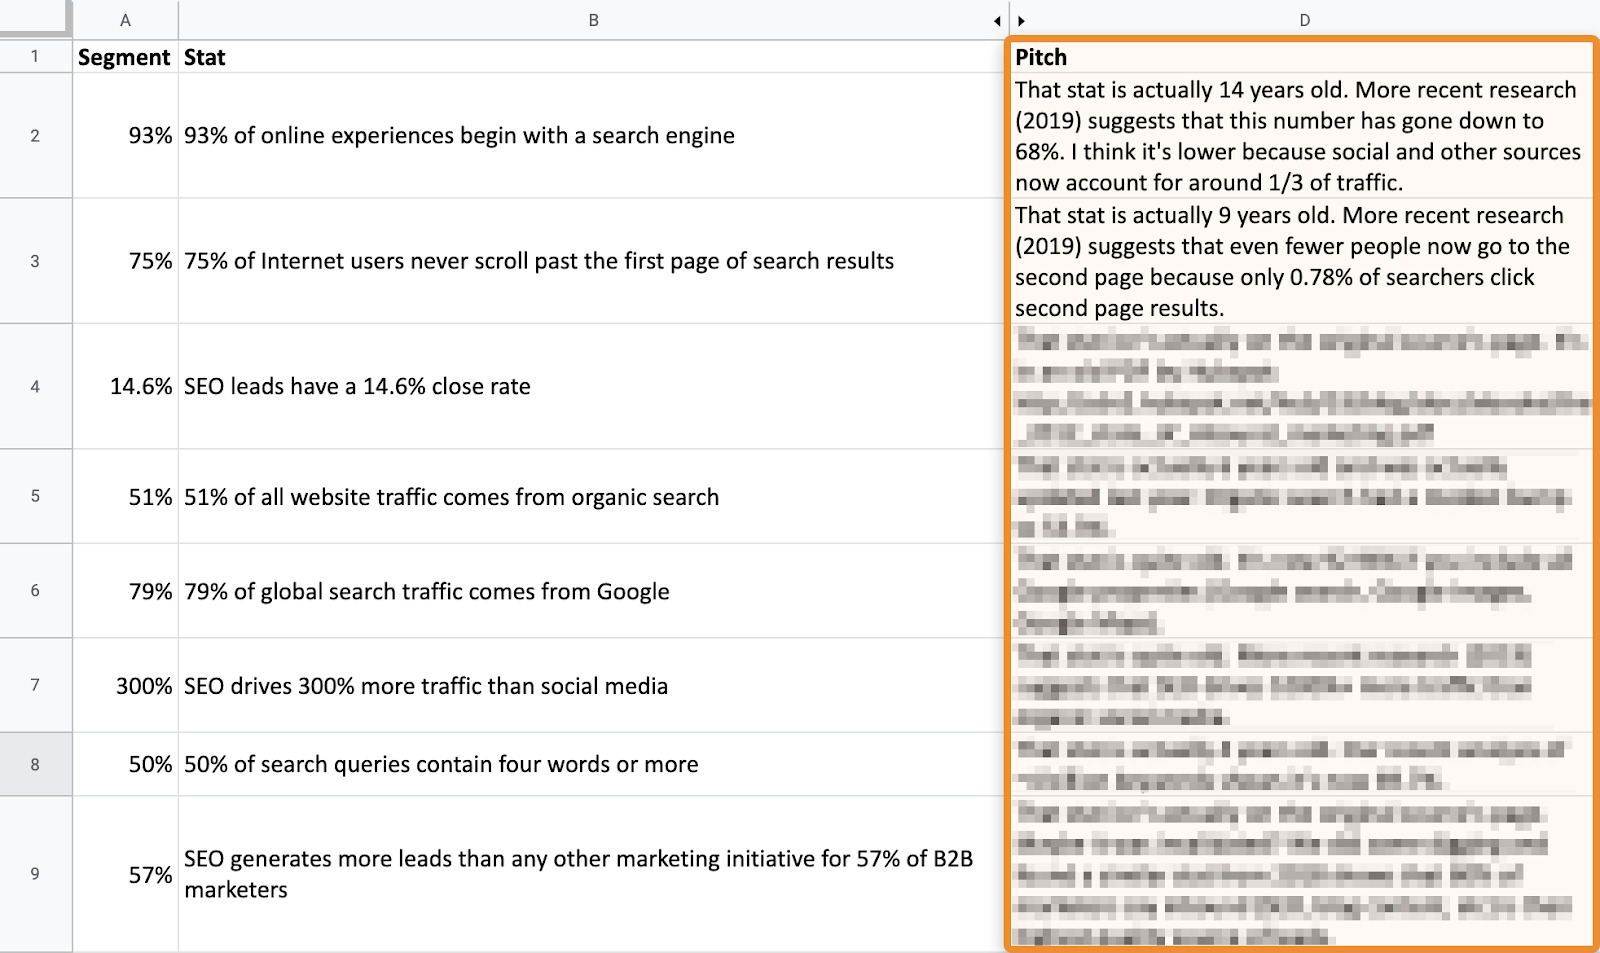
Finally, we put everything together in one sheet and imported that into our outreach tool: PitchBox. The result was a simple and personalized email for every prospect.
Here’s an example of the final result:
Hi Josh,
I saw you mentioned how 93% of online experiences begin with a search engine on your page about ecommerce SEO.
That stat is actually 14 years old. More recent research (2019) suggests that this number has gone down to 68%. I think it’s lower because social and other sources now account for around 1/3 of traffic.
We published this and a few other fresh SEO stats here: https://ahrefs.com/blog/57-seo-statistics-for-2020/.
Not sure if you’re actively editing posts, but might be worth an update if you are? No pressure 🙂
Cheers,
Vlad
Now all that was left to do was hit send.
In total, we sent 515 emails. 473 were delivered, and 42 bounced.
Based on deliverable emails, that puts our conversion rate at 5.71%, meaning that 27 of the websites we contacted linked to us.
However, two other cool things happened:
- We got links from five sites that we didn’t contact. This is likely because some people found our post from others that linked to us and from the odd social shares. In total, we had 19 shares on Facebook and two on Twitter.
- Some websites linked more than once. This was from both new and old pages.
If we take those things into account, our campaign brought us a grand total of 36 editorial links from 32 unique websites.
But, of course, quantity is only half the game. What about quality?
Let’s break things down by Domain Rating:
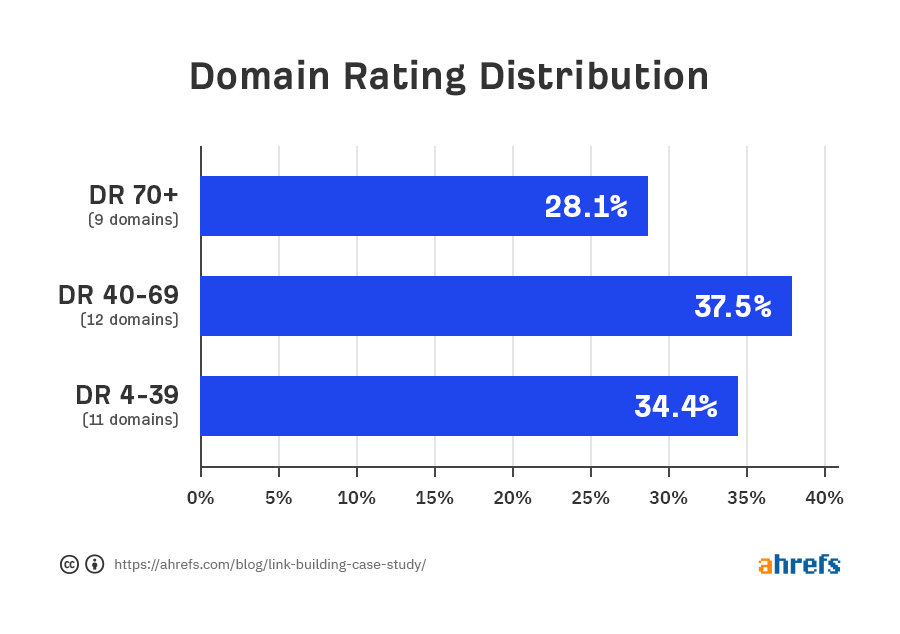
9 of the 32 referring domains had a DR of 70 or greater. 12 had a DR of 40 to 69. And the remaining 11 had DR values of 4 to 39.
If we do the same for estimated organic traffic, here’s what we get:
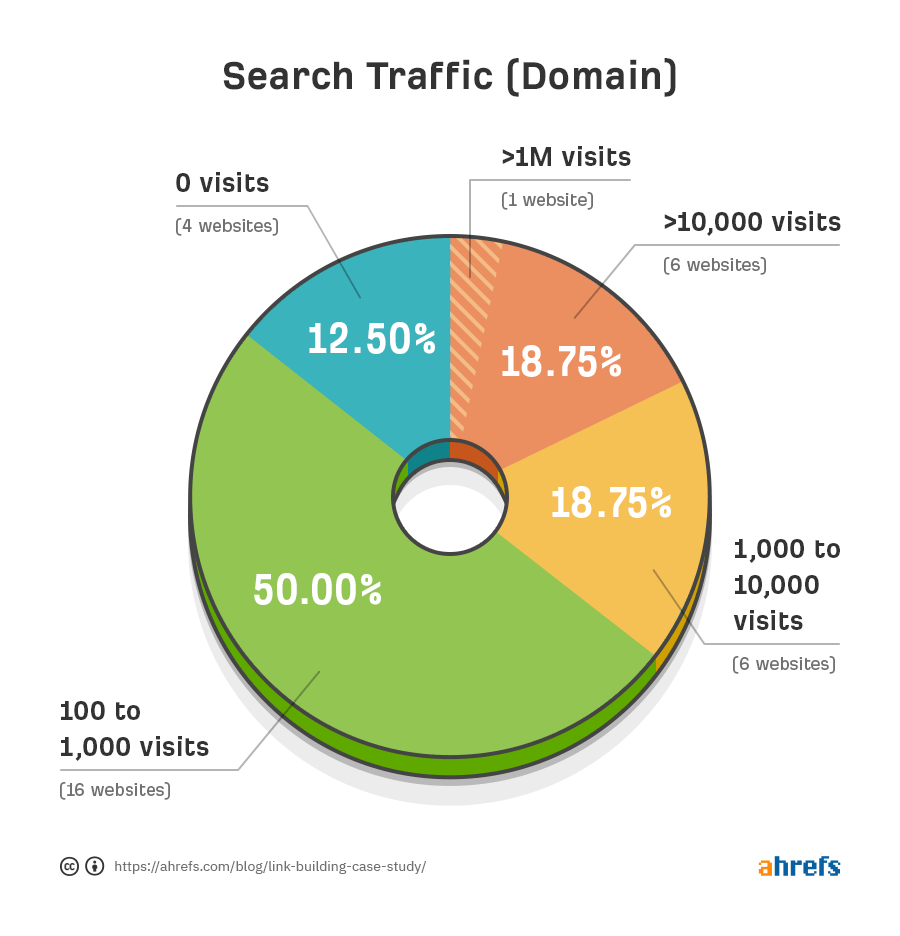
1 website gets over 1,000,000 monthly search visits. 6 get between 10,000 and 1,000,000. 6 get between 1,000 to 9,999. 16 get between 100 to 999. And 4 get no search traffic.
Judging by conventional SEO metrics, then, most of the links we got were high-quality. Of course, metrics like these aren’t foolproof, but having checked every link we earned by hand, I would echo this conclusion.
Despite having success with this campaign, some might argue that a 5.71% conversion rate is nothing special.
Five years ago, that might have been the case, but outreach is getting harder and more people are asking for money or something else in return.
That said, there are two ways we could almost certainly have increased our conversion rate.
1. Negotiate with prospects
The conversion rate for our campaign was 5.71%, but the reply rate was 17.55%. That means 83 people responded to our email, but only 27 linked to us (plus two people we didn’t reach out to).
While some of these were “thanks, but no thanks” type responses, many were requests for link exchanges and other things.
Here’s a quick breakdown:
- 8 people requested a link exchange;
- 6 people requested something else in return (e.g., free Ahrefs account, to share their content on social media, etc.);
- 3 people asked for money
Buying links is against Google’s Webmaster Guidelines, so it’s not something we would ever do or recommend to others. But even if we exclude those people, there were still 14 people who seemed willing to negotiate. With a bit of back and forth, we likely could have come to a mutually beneficial agreement and convinced these folks to link to us. That would have brought our referring domains count to 41, which is an 8.7% conversion rate.
2. Send follow-ups
According to Authority Hacker’s study of over 600,000 outreach emails, sending three follow-ups at least doubled their results. However, we didn’t send any automated follow-ups because we didn’t want to bother people.
That will sound crazy to most link builders, but we only ran this campaign to test our tactic. Our goal wasn’t to get as many links as humanly possible. That’s why we only followed up with people who said they’d link to us but didn’t do so within two weeks.
If we followed Authority Hacker’s advice and sent three follow-ups, our link acquisition rate would likely have been at least 11.42%.
Final thoughts
Given that we put a lot of effort into this campaign and only came away with backlinks from 32 websites, you might question whether blogger outreach is still worth the effort. Luckily, the answer to this question is simple: of course it is.
Backlinks are still an important ranking signal, and there’s just no other way to build high-quality white-hat links without outreach. Although we executed this campaign over a few weeks, it’s also worth noting that it wasn’t all that complicated to set up. If we were to do it again, assuming that we had someone vetting prospects and finding contact information, we think we could set up the entire campaign in one working day.
Got questions? Ping me on Twitter.