While it would be ideal if just one or two tools could cover all your analytics needs, the reality is more complex. That’s why I’ve put together this list of the best tools for each type of data, plus a few others that stand out for their overall value. Here’s my guide to the top marketing analytics tools for 2025:
| Tool | What it’s for | Standout feature | Pricing |
|---|---|---|---|
| Google Analytics 4 | General web analytics: website traffic, user behavior, conversions. | Explorations tool for custom reports and in-depth analysis. | Free (premium version available as part of Google Marketing Platform) |
| Ahrefs | SEO analytics: keyword research, rank tracking, backlink analysis, site audits, robust reporting. | Comprehensive SEO toolset with a massive data index. | Free tools available; Premium plans start at $29/month. |
| Google Search Console | Monitoring website presence in Google search results; identifying SEO issues. | Direct access to Google’s search data, including clicks, impressions, and ranking positions. | Free |
| Mixpanel | Product and user behavior analytics for SaaS, mobile apps, and e-commerce. | Impact report for measuring the effects of new product features. | Free plan available; Premium plans start at $24/month. |
| Microsoft Clarity | Website visitor behavior analytics: heatmaps, session recordings. | Free and easy-to-use tool for visualizing user behavior and identifying UX issues. | Free |
| Visual Website Optimizer | A/B testing and website optimization. | “Plan” feature for organizing and documenting experiments. | Free plan available; Premium plans start at $190/month. |
| Brand24 | Media monitoring and social listening. | Brand comparison and performance tracking over time. | Premium plans start at $149/month; 14-day free trial. |
| Klipfolio | Creating and sharing dashboards with data from various sources. | Powerful data transformation and automation features. | Free plan available; Premium plans start at $90/month. |
| ProfitWell | Subscription management and revenue optimization for SaaS and subscription businesses. | MRR growth rate tracking and churn analysis. | Free. |
| vidIQ | YouTube analytics and optimization. | Channel audit for identifying top-performing videos and areas for improvement. | Free plan available; Premium plans start at $16.58/month. |
| HubSpot | All-in-one marketing, sales, and support platform with integrated analytics. | Unified platform for customer-centric teams with collaborative dashboards. | Free plan available; Premium plans start at $20/month. |
| ChatGPT | AI-powered insights and analysis; understanding data and finding solutions. | Ability to analyze data, provide explanations, and suggest solutions based on complex queries. | Free plan available; ChatGPT Plus plan costs $20/month. |
If you want to learn more about how I’ve chosen the tools and my experience using them, read on!
Who is this for?
This guide is designed for solopreneurs, as well as small and medium-sized businesses. Drawing from my experience working with companies like yours throughout my career, this product guide aims to help you identify your best-performing tactics and content, so you can focus on what truly works.
If you’re shopping for a larger team, you’ll still find top-tier tools for data sourcing, including SEO tools, along with some excellent dashboard app options. Although I generally avoided pricier tools, I’ve included a few noteworthy ones so you don’t leave empty-handed.
- Qlik: A business intelligence and data visualization platform that enables users to create interactive dashboards and perform in-depth data analysis.
- CaliberMind: A B2B marketing analytics and attribution platform designed to unify data from various sources, providing insights into customer journeys and campaign effectiveness.
- Adobe Marketing Cloud: A suite of digital marketing solutions offering tools for analytics, content management, advertising, and campaign orchestration to enhance customer experiences.
- Terminus: An account-based marketing platform that helps businesses target key accounts, engage stakeholders, and measure the impact of their marketing efforts.
- Tableau: A data visualization and business intelligence tool that allows users to create interactive and shareable dashboards, facilitating the exploration and analysis of data. By the way, I was blown away by their recent keynote, showing what’s possible with AI now. I strongly recommend watching this.
How I created the list
While I aim for objectivity, this list reflects my personal experience and recommendations after over 10 years in marketing across various roles and industries. I’ve rigorously tested numerous tools, and these stand out as the best.
My selection criteria? Transparent and affordable pricing, a proven track record, user-friendly interfaces, robust analytics, seamless data integration and export, and scalability.
This article is regularly updated because the marketing technology landscape is constantly evolving. Expect to find new features, pricing changes, and noteworthy new tools in this refresh.
Google Analytics 4
Google Analytics 4 (GA4) comes with almost everything you need to see how many people visit your website, where they come from, and what pages they visit.
I’ve used Google Analytics extensively, and it’s often a solid starting point. However, the analytics landscape has exploded with specialized tools that excel in specific areas (like those at the end of this section).
Think of it like this: GA4 is a reliable family car — great for everyday tasks. But sometimes you need a sports car for the thrill, a truck for hauling, or an off-road vehicle for adventure. If you have unique needs or prioritize specific values (like data privacy), explore those specialized tools. They might be a better fit.
Key use cases
- Track results of specific campaigns using the UTM tags.
- Measure conversions on important pages such as form completions or transactions.
- Use the Explorations tool to uncover trends and patterns in user behavior.
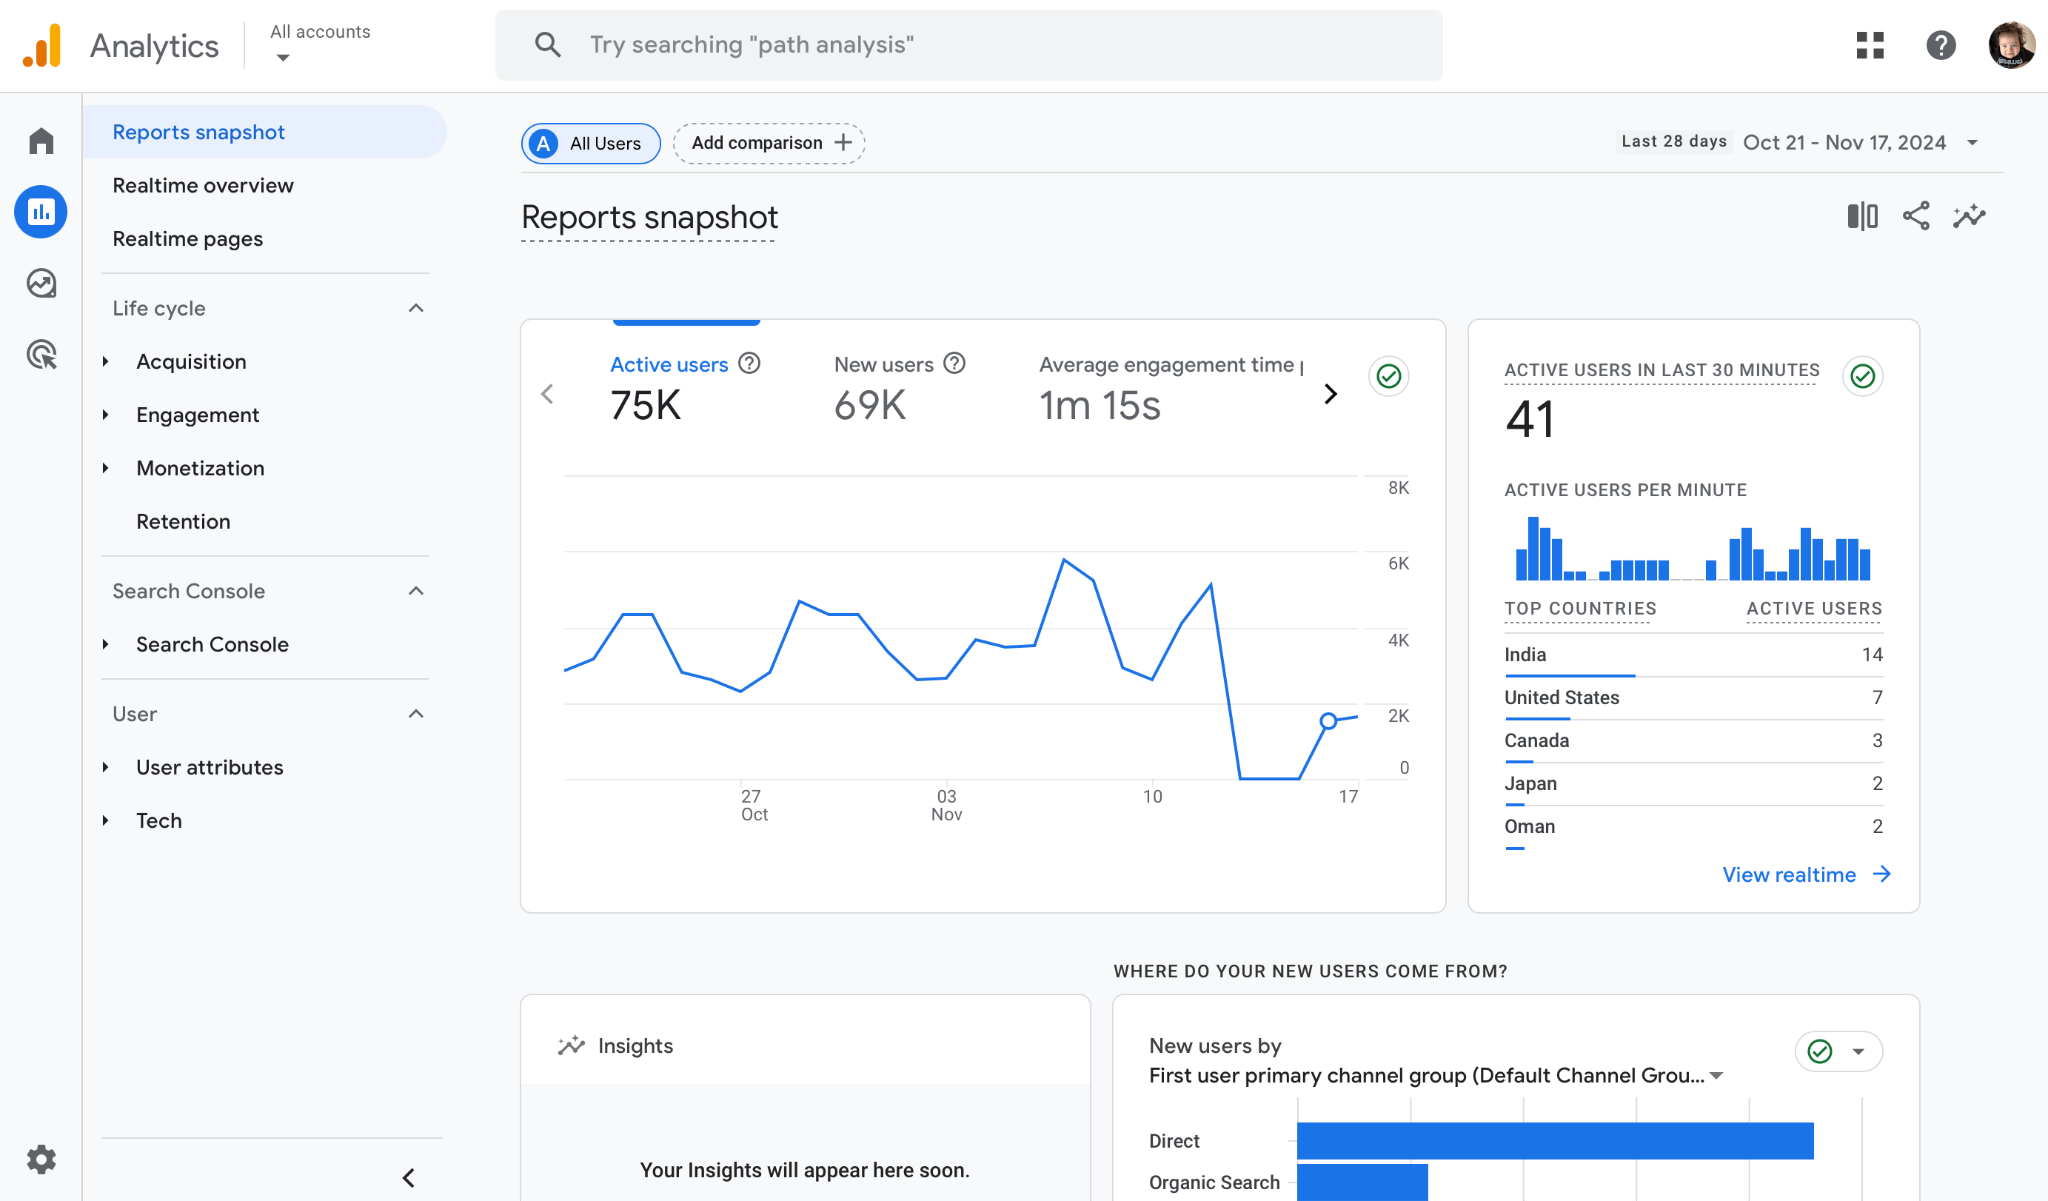
Standout feature: Explorations
The Explorations tool is like your own research lab for web analytics.
It allows you to create custom reports that go beyond the information provided by GA4’s standard reports. So if there’s a question bugging you and standard reports don’t cut it, you will likely find your answer in Explorations.
You can then share your reports with other people or export them.
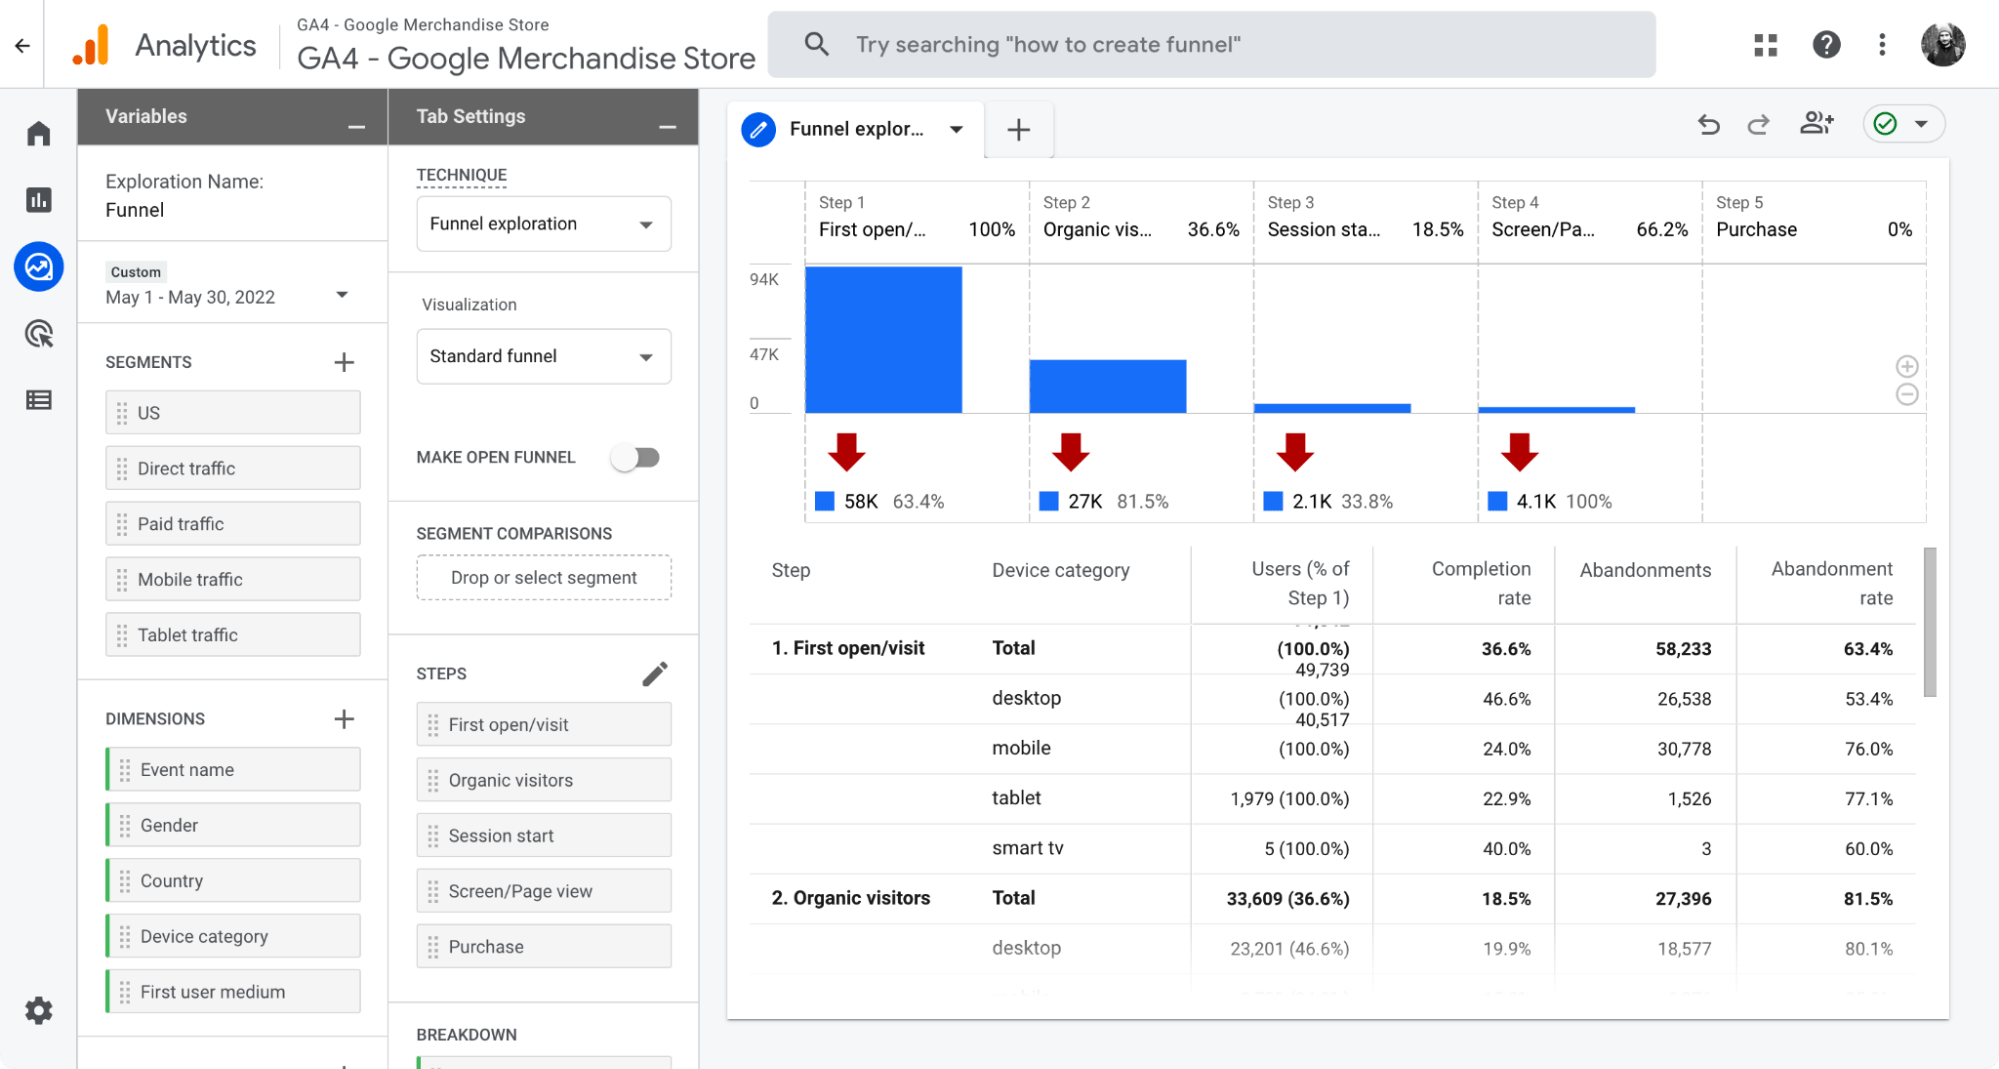
Below, an example of a funnel report. Google has revamped funnels in its GA4. It tracks everything as events now, so most of the time, you won’t need to create custom events to create funnels.
What’s more, you can create open funnels (the user can enter at any point) and closed funnels (the user can only enter in the first step). Closed funnels are the default option, but you can change it to track non-linear user paths.
Pricing
Free.
There’s also a premium, paid version as part of the Google Marketing Platform (a solution for enterprises).
Runner ups
For those prioritizing data privacy or operating in regions where Google Analytics faces legal restrictions (like certain parts of Europe), Matomo presents a robust alternative.
Additionally, many of the tools on this list include web analytics features. HubSpot, for instance, offers its own web analytics and integrates seamlessly with GA4, so there’s no downside to using a free tool to collect and analyze your data.
Recently, Mixpanel added a more sophisticated option web analytics option with enhanced marketing attribution capabilities while Ahrefs is just about to release simple, privacy-friendly analytics.
Moreover, it recently came to my attention that attribution models within GA4 and native ad platforms (such as Meta Ads and Google Ads) may have serious limitations. If precise ad tracking and understanding the user journey are crucial for your business, consider exploring specialized tools like Segmetrics, Clickmagic, or Hyros.
Ahrefs
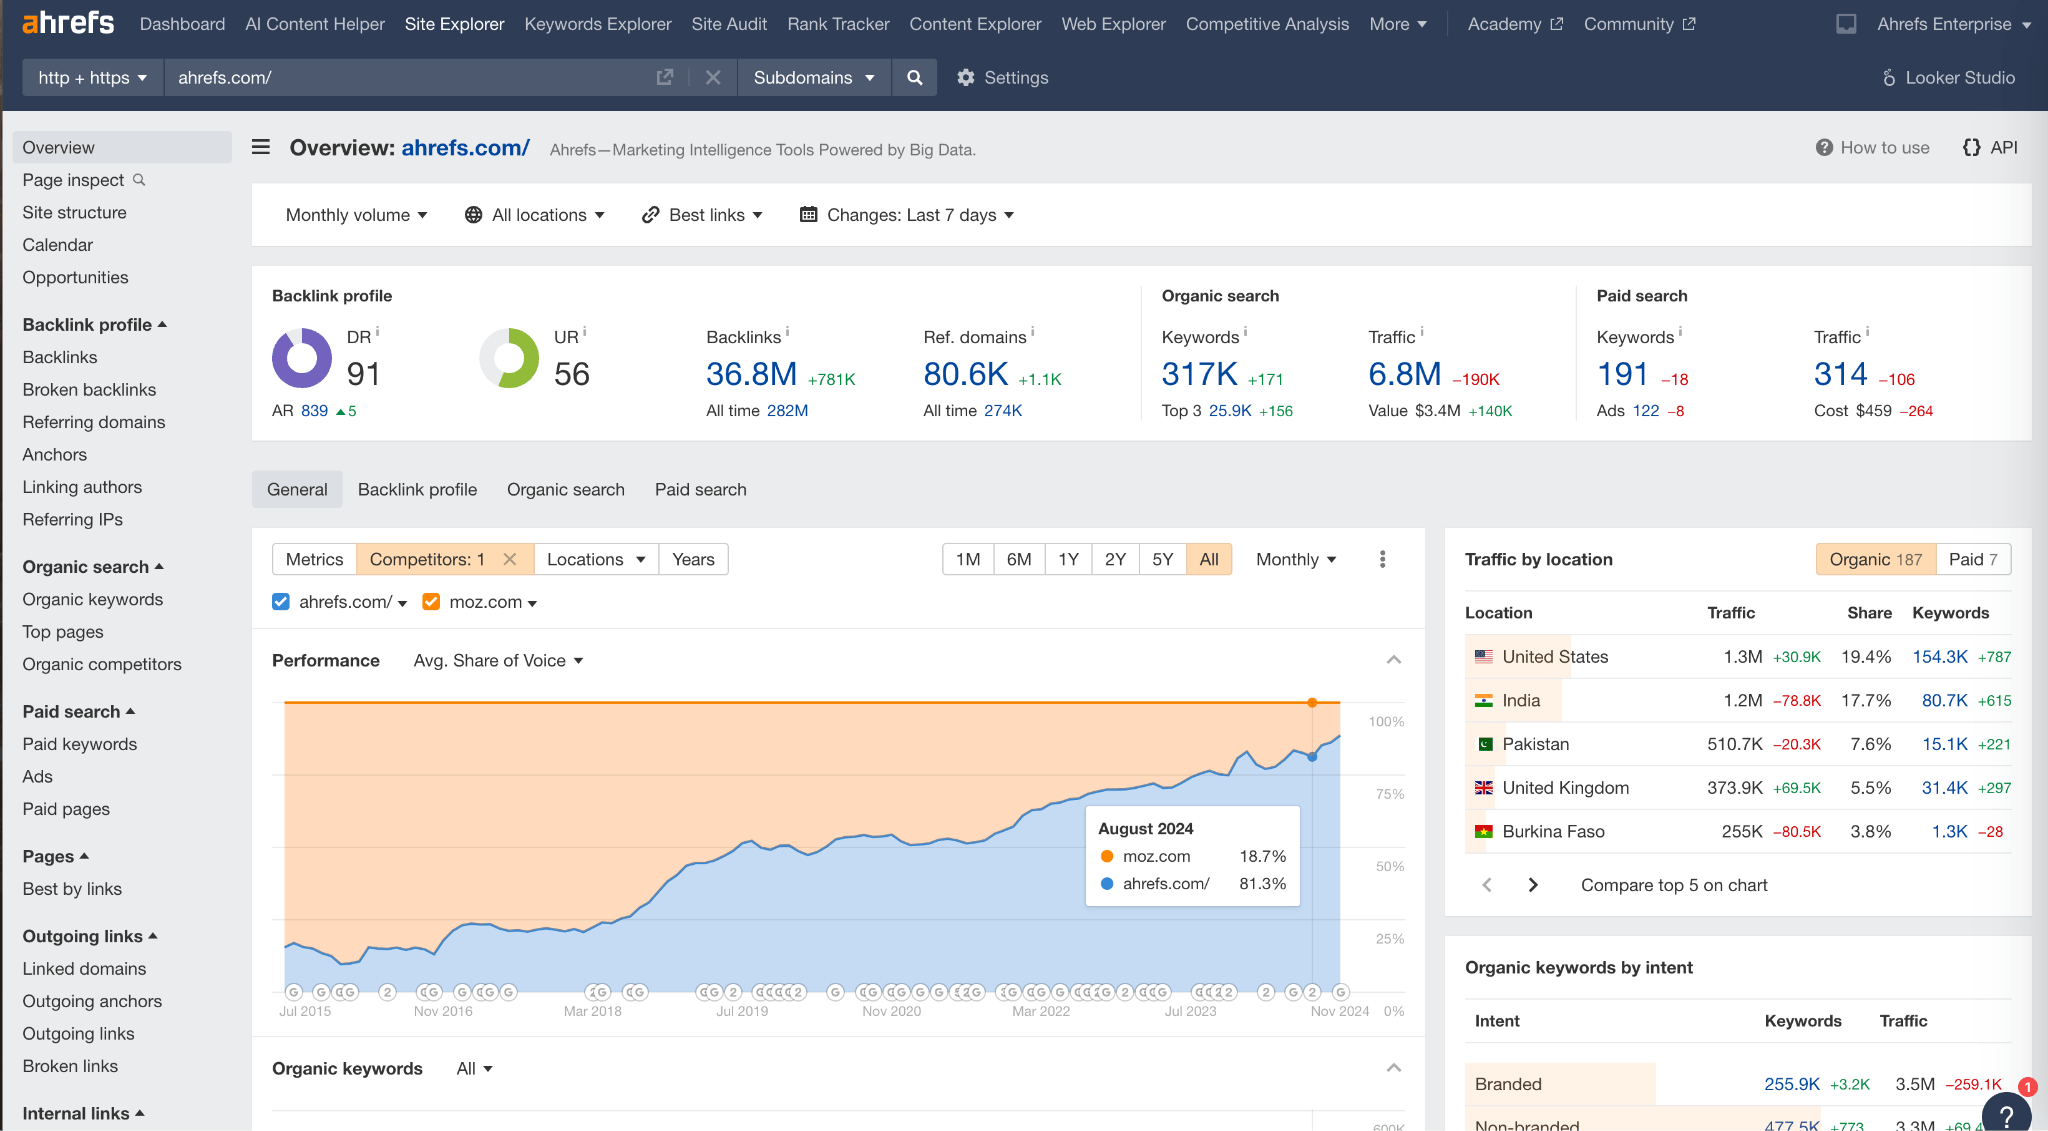
Ahrefs is an all-in-one SEO toolset. It’s the kind of tool you absolutely need if you want more visibility into your performance on Google Search.
I’ll admit, I use Ahrefs every single day. You might think that makes me biased, but I’m not alone. Thousands of marketers rave about Ahrefs online and at industry events.
Sure, most SEO tools offer similar features like keyword research and rank tracking. But Ahrefs has invested heavily in building a truly unique dataset which is the heart and soul of an SEO tool.
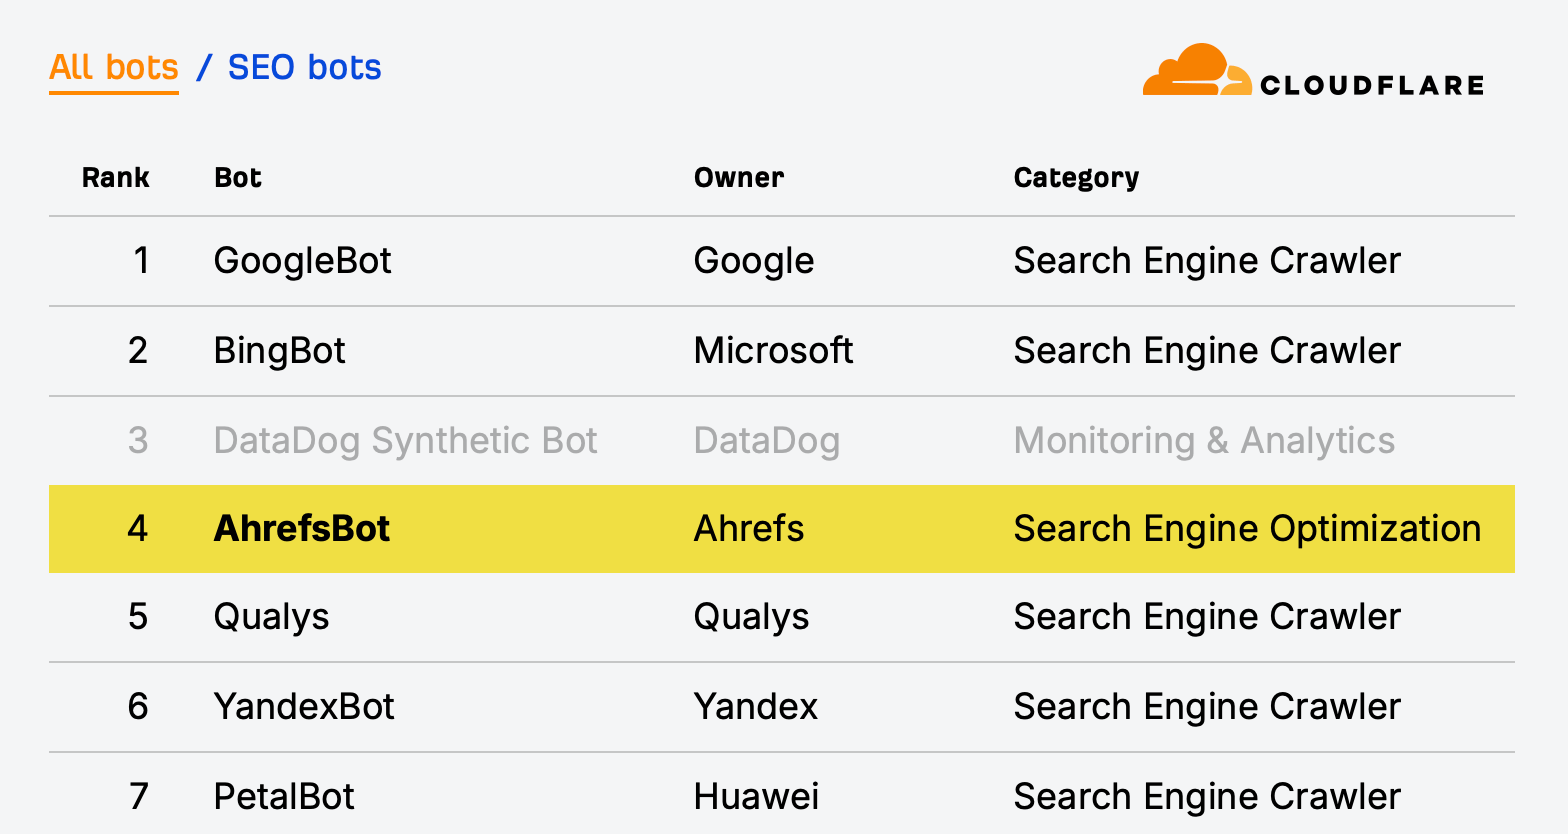
We’re talking the largest keyword and link index out there, powered by a custom-built supercomputer (true story) that crawls the web faster than any competitor. That’s the kind of commitment to data that translates into powerful insights for users like me.
Key use cases
- Audit your site and fix SEO issues that hold you back.
- Do an SEO competitor analysis to fill content gaps, see your competitor’s top content, and discover where and how they get backlinks.
- Monitor your ranking performance on Google to know whether your SEO tactics are working.
- Use of the many reporting options: build custom report apps right inside the tool with the new Reports Builder, use a Looker Studio connector, or connect with other tools via the API.
Standout feature: Opportunities
A great way to start with Ahefs is the Opportunities report. It’s a report consisting of the top opportunities the tool identifies after analyzing your site.
It’s a bit like hiring an SEO consultant to show you where to start with search engine optimization.
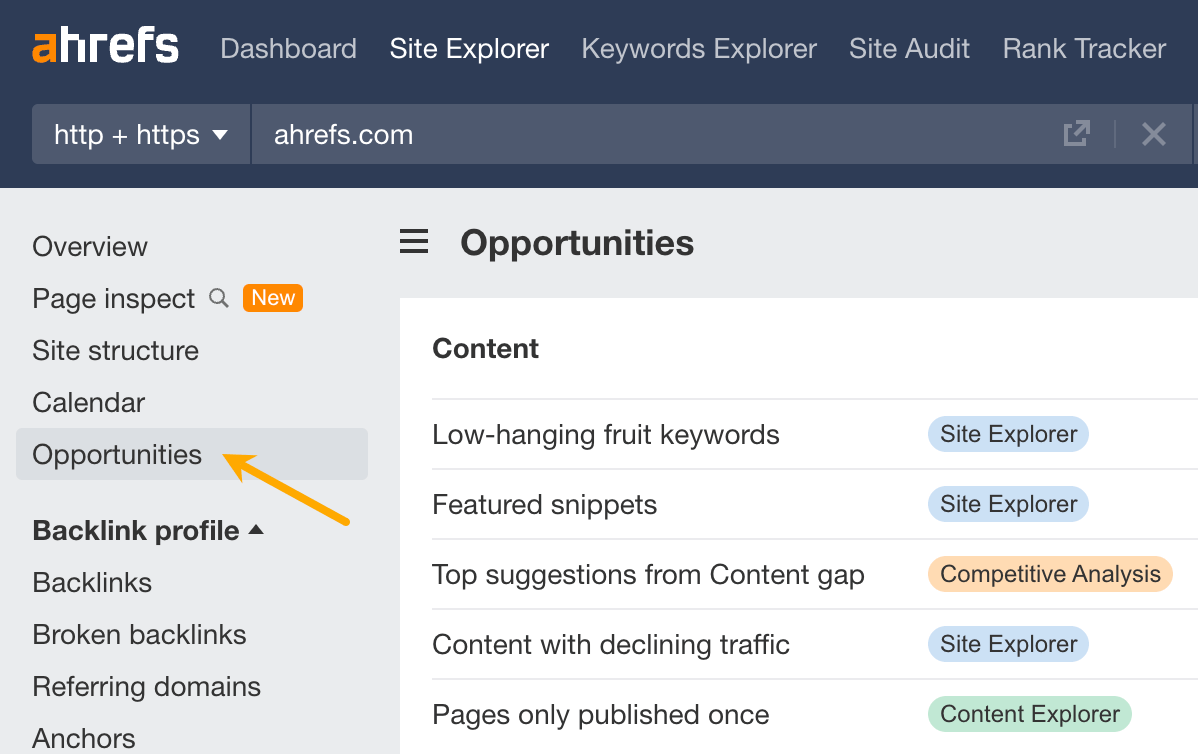
You’ll find three categories of opportunities here. They reflect three key areas you need to cover to increase visibility on Google:
- Content: this section is all about keyword analysis. You can see keywords that are relatively easy to improve on, keywords that your competitor ranks for but you don’t, pages that have declined in traffic in the last six months, and more.
- Links: focuses on link analysis. You can discover new internal links you should build, unlinked brand mentions, pages that link to your competitors but not to you, and more.
- Technical: a technical SEO analysis ready to take action on. You’ll discover critical SEO issues that could undermine your visibility on Google.
Pricing
Ahrefs offers quite a collection of free SEO tools. You should definitely check out Ahrefs Webmaster Tools: It uncovers all of your organic keywords and backlinks and monitors your website’s SEO health for free. Plus, you can use it for all of the websites you own.
If you want to get the most out of SEO, check out our premium plans. Ahrefs recently introduced a new cheaper plan for as low as $29 per month.
Google Search Console
Google Search Console (GSC) is a tool that helps you monitor and troubleshoot your website’s appearance in Google’s search results.
GSC is the only tool that features search performance data straight from Google (although limited). Marketers use it to learn the exact amount of organic traffic they’re getting from that search engine.
Key use cases
- See the traffic you get from Google’s web, image, video, news results, and Google Discover.
- Use the CTR metric to see how page title optimizations contribute to clicks.
- See if Google indexes your site without issues.
Standout feature: Click-through rate data
With GSC, it is quite easy to spot pages that rank high but don’t get as many clicks as you expect.
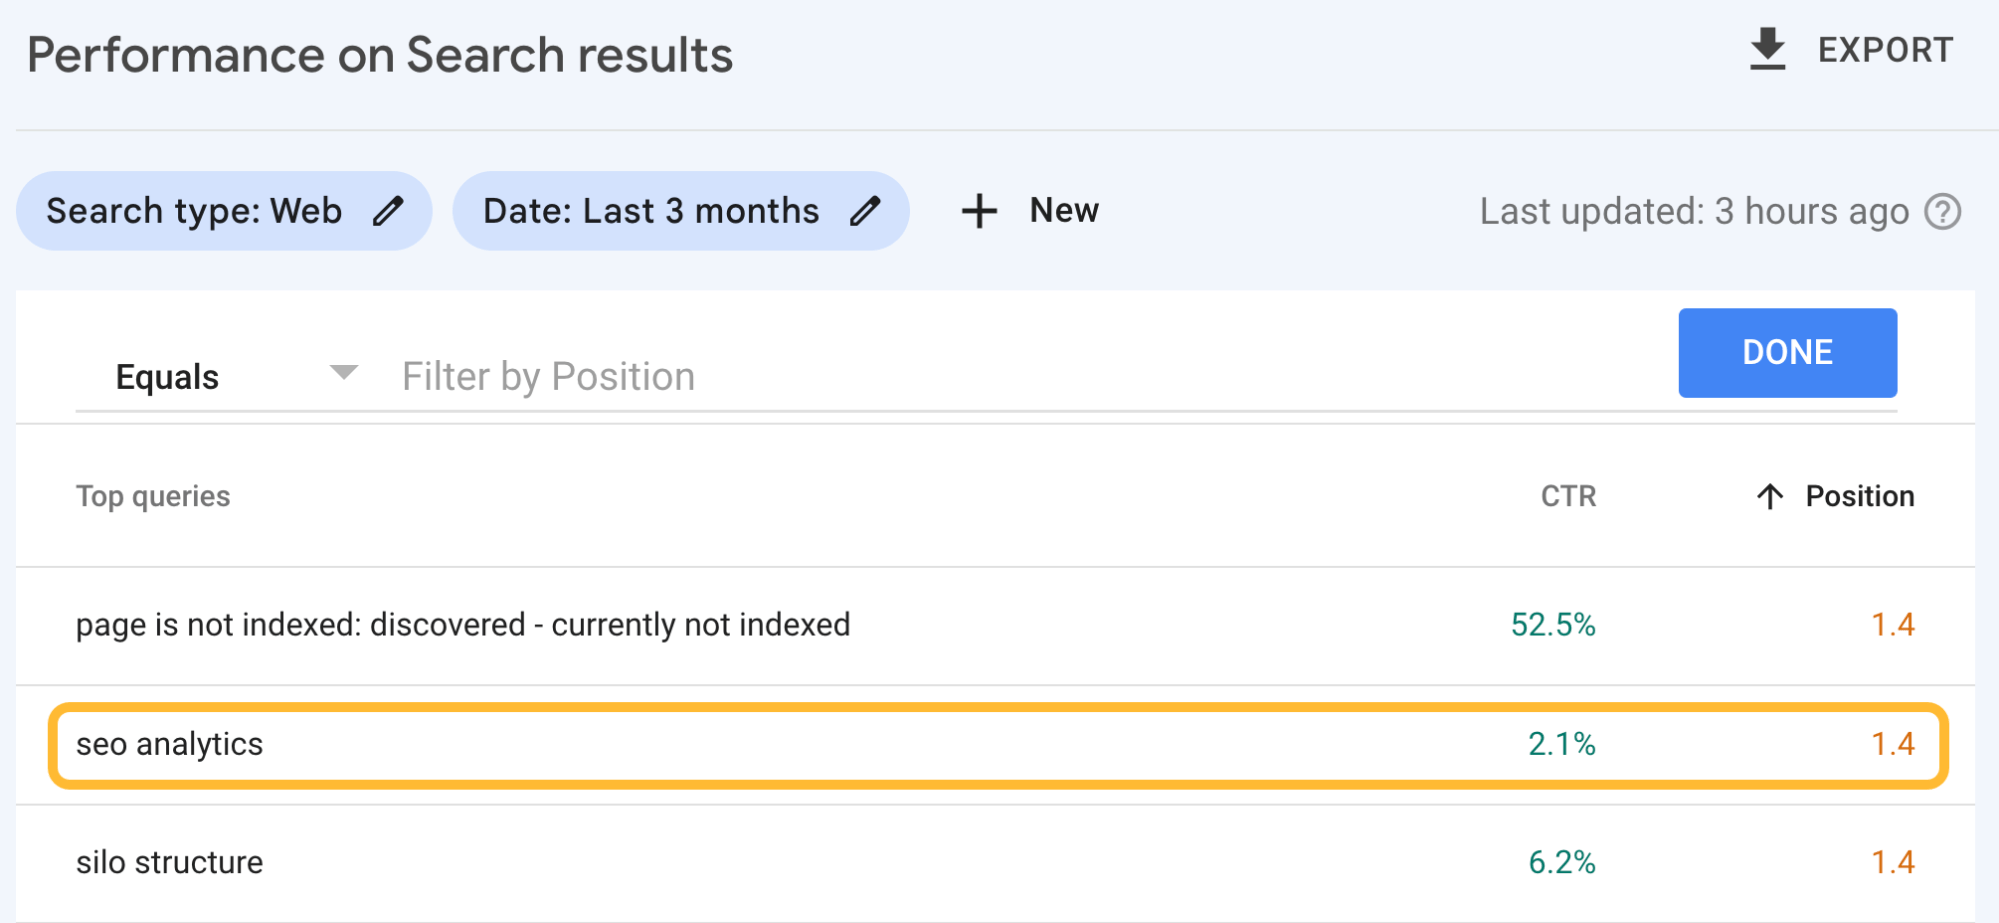
GSC has a handy metric for this: CTR (click-through rate). You can find it in the Performance tab; just make sure to tick the “Average CTR” and “Average position” first.
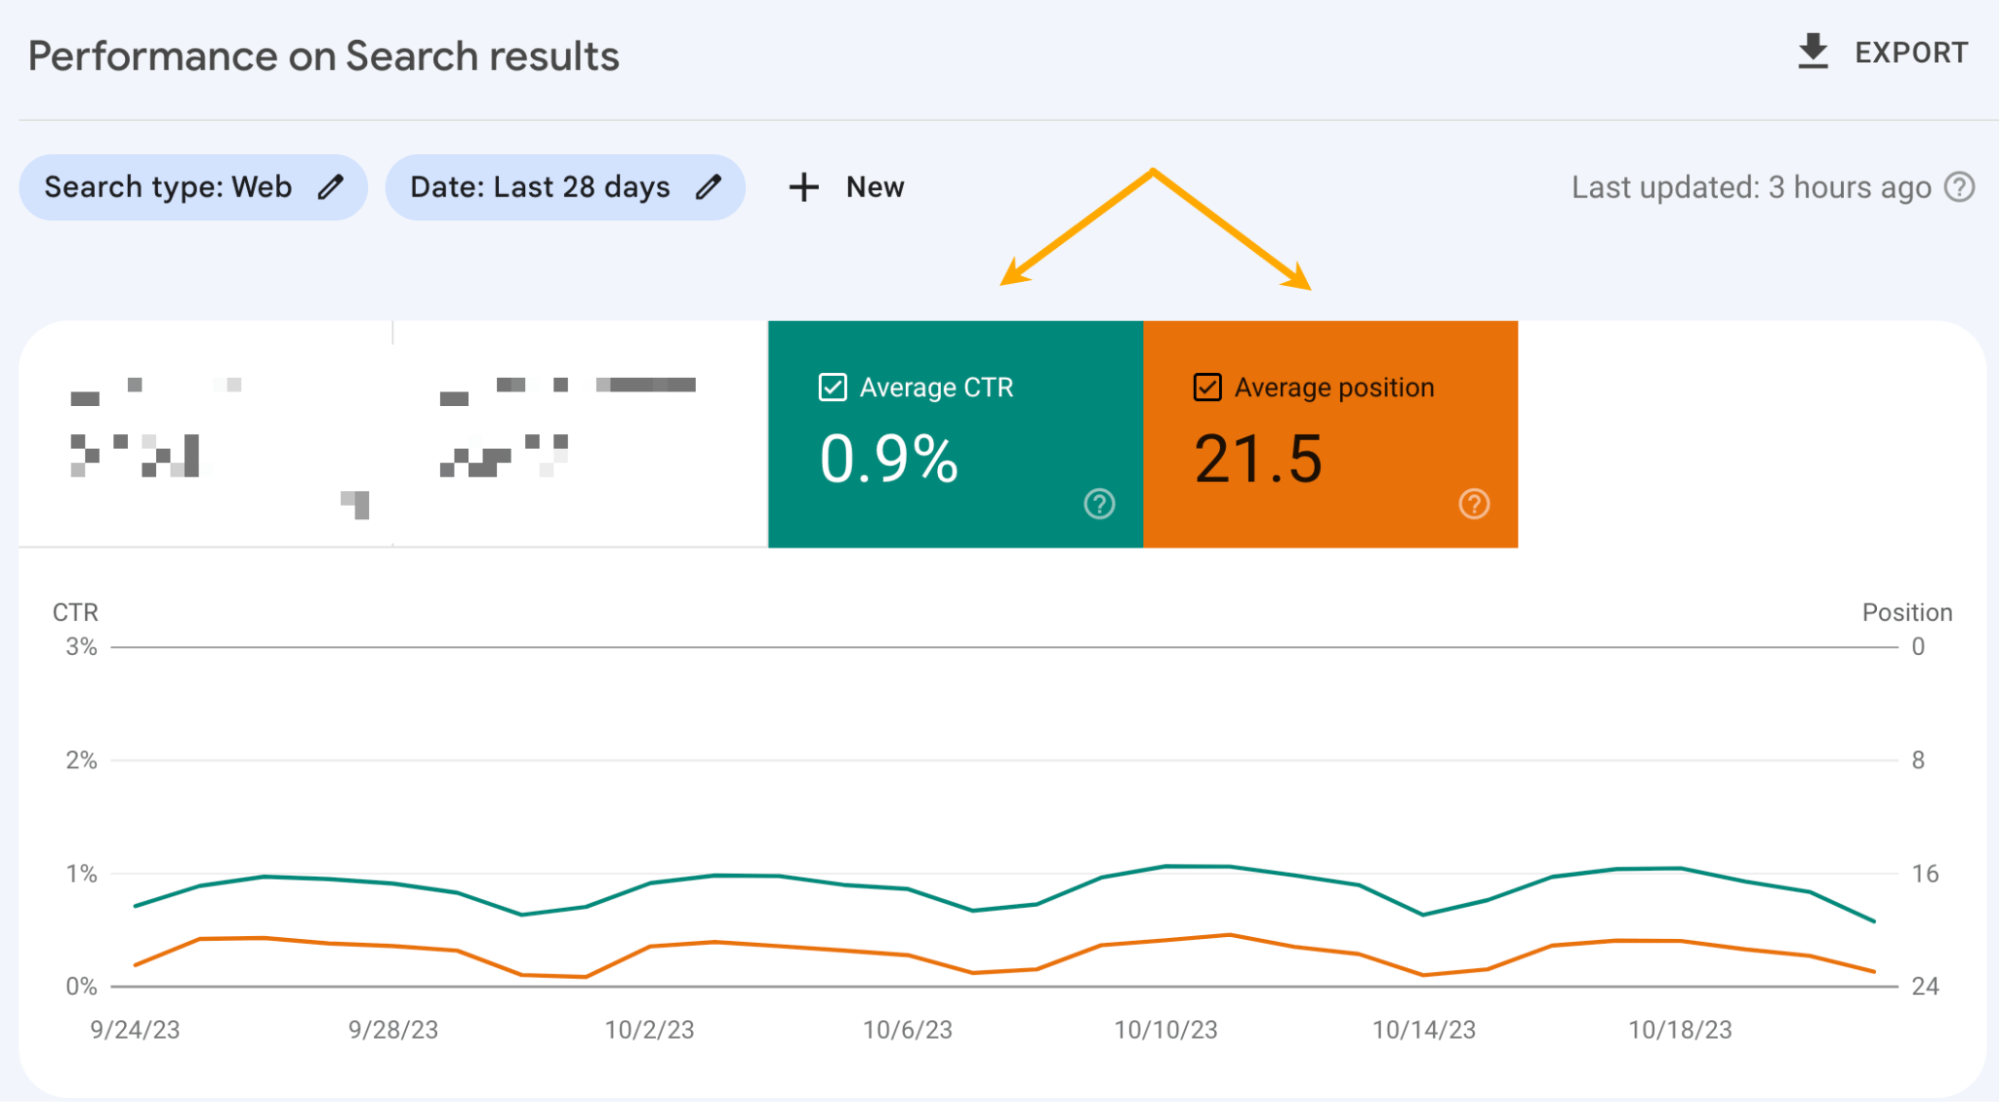
For instance, this is an interesting case. The keyword “seo analytics” has only 2.1% CTR, while it ranks at 1.4 on average. A page ranking so high should likely have more engagement on Google SERPs, so the title of that post (and perhaps the description, too) could be something to improve on.
Pricing
Free.
Mixpanel
Mixpanel is a product analytics tool. It’s a bit like Google Analytics but designed especially for measuring user behavior in SaaS products, mobile apps, and e-commerce platforms.
Mixpanel can be a game-changer for your company. I’ve seen it firsthand. In a previous role, the tool helped us identify our ideal customer profile and significantly increase revenue. It revealed key patterns in user behavior, highlighting our most active and loyal customers. We realized that instead of targeting small businesses, we should focus on enterprise clients. This shift even prompted us to build a dedicated sales team from the ground up.
Key use cases
- See which features people interact with the most and which are barely touched. Popular features can be highlighted in campaigns, while less popular ones may need more educational materials or updating.
- Understand the impact of newly launched features on product adoption and sales.
- Study the paths users take after signing up for your product (or any other specific event) to uncover friction points or see how long it takes them to get to essential features.
Something I already mentioned, but make sure you also check out their latest addition, the Web Analytics introduced in May 2024.
Standout feature: Impact report
Impact report is Mixpanel’s solution to the classic problem of measuring the results of newly launched product features.
Imagine you launched new in-app tutorials. Do they encourage users to spend more time using the app, or create more projects, or churn less frequently? Mixpanel can show you the relationship between these changes and dozens of different outcomes. Your report would look something like this:
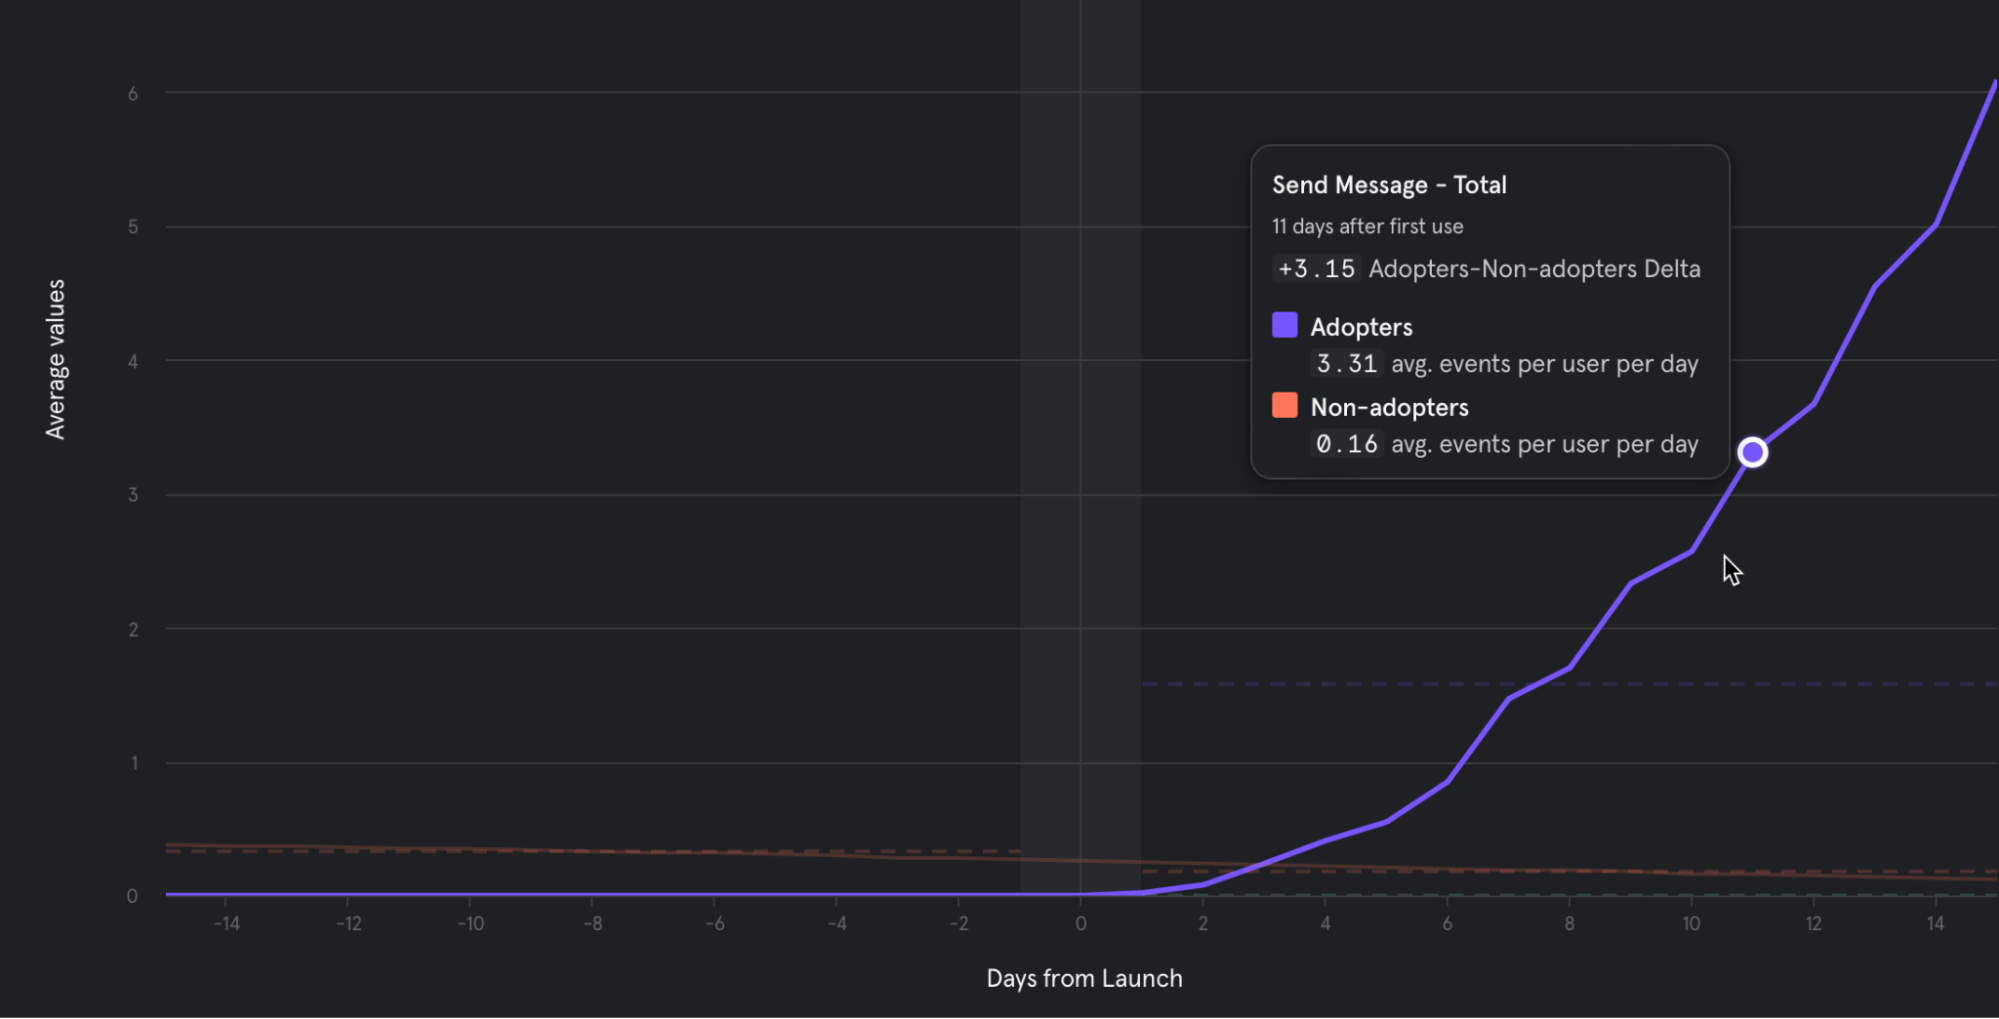 The purple line shows that people who have completed the step engage more with the feature compared to people who haven’t (orange line).
Pricing
Free plan available. Premium plans start from $24/mo.
Microsoft Clarity
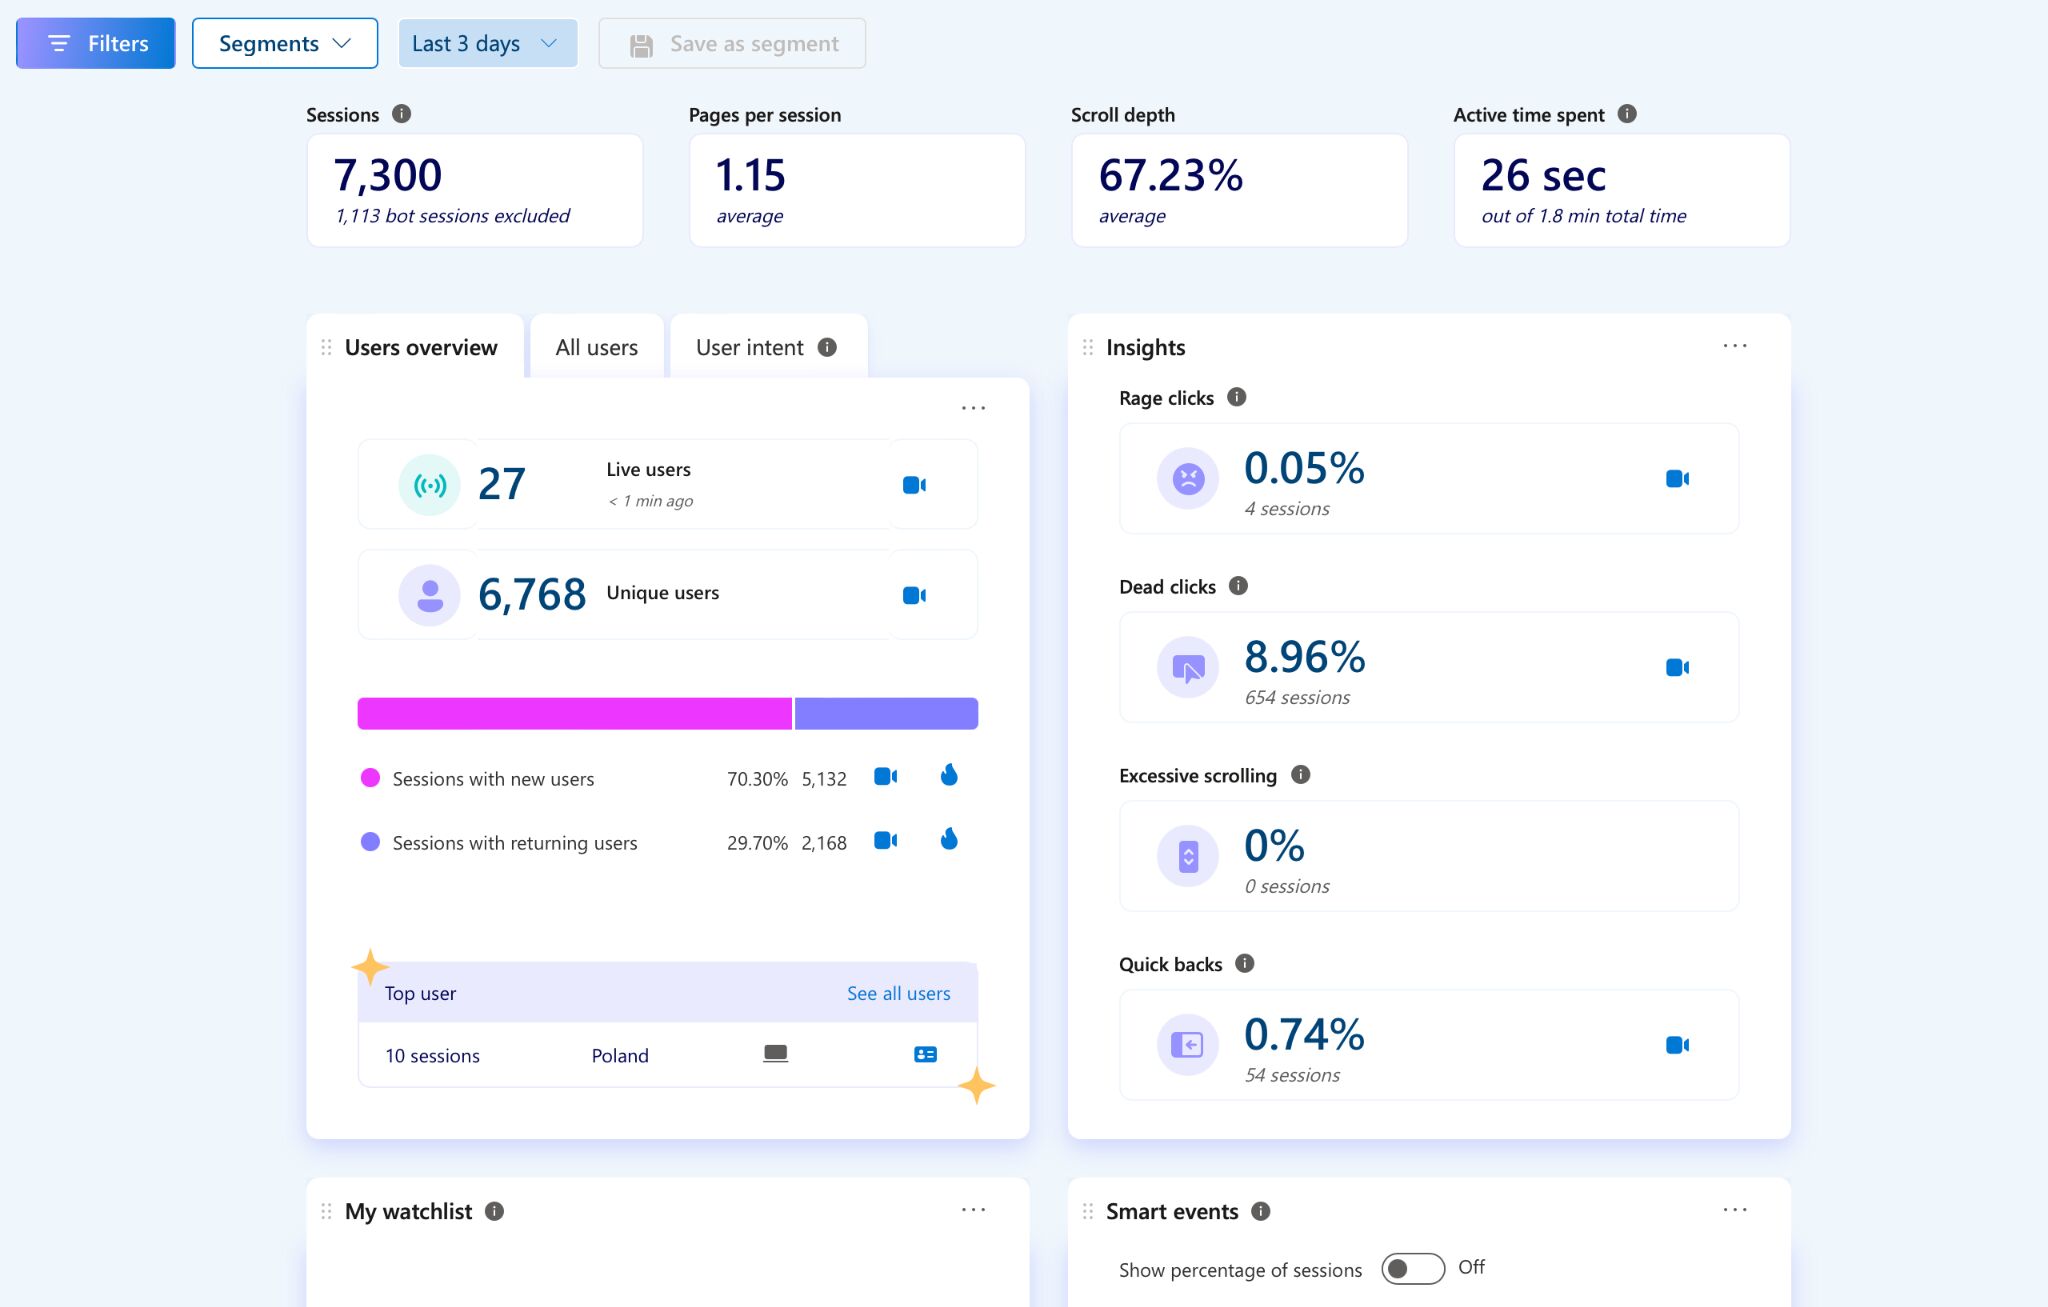
Microsoft Clarity is a behavior analytics tool that allows you to literally see how users interact with your site and spot user experience issues that can harm your performance.
You can think of it as a tool that fills the heat mapping and session recording gap in GA4. You can even integrate these two to watch recordings of user segments set up in GA4.
While more advanced tools exist, they often require dedicated resources for analysis, which might be overkill for many. Microsoft Clarity provides the essential features most businesses need: heatmaps and session recordings to understand user behavior on key pages.
It’s a perfect starting point, especially if you’re new to behavior analytics or have limited time for in-depth analysis.
Key use cases
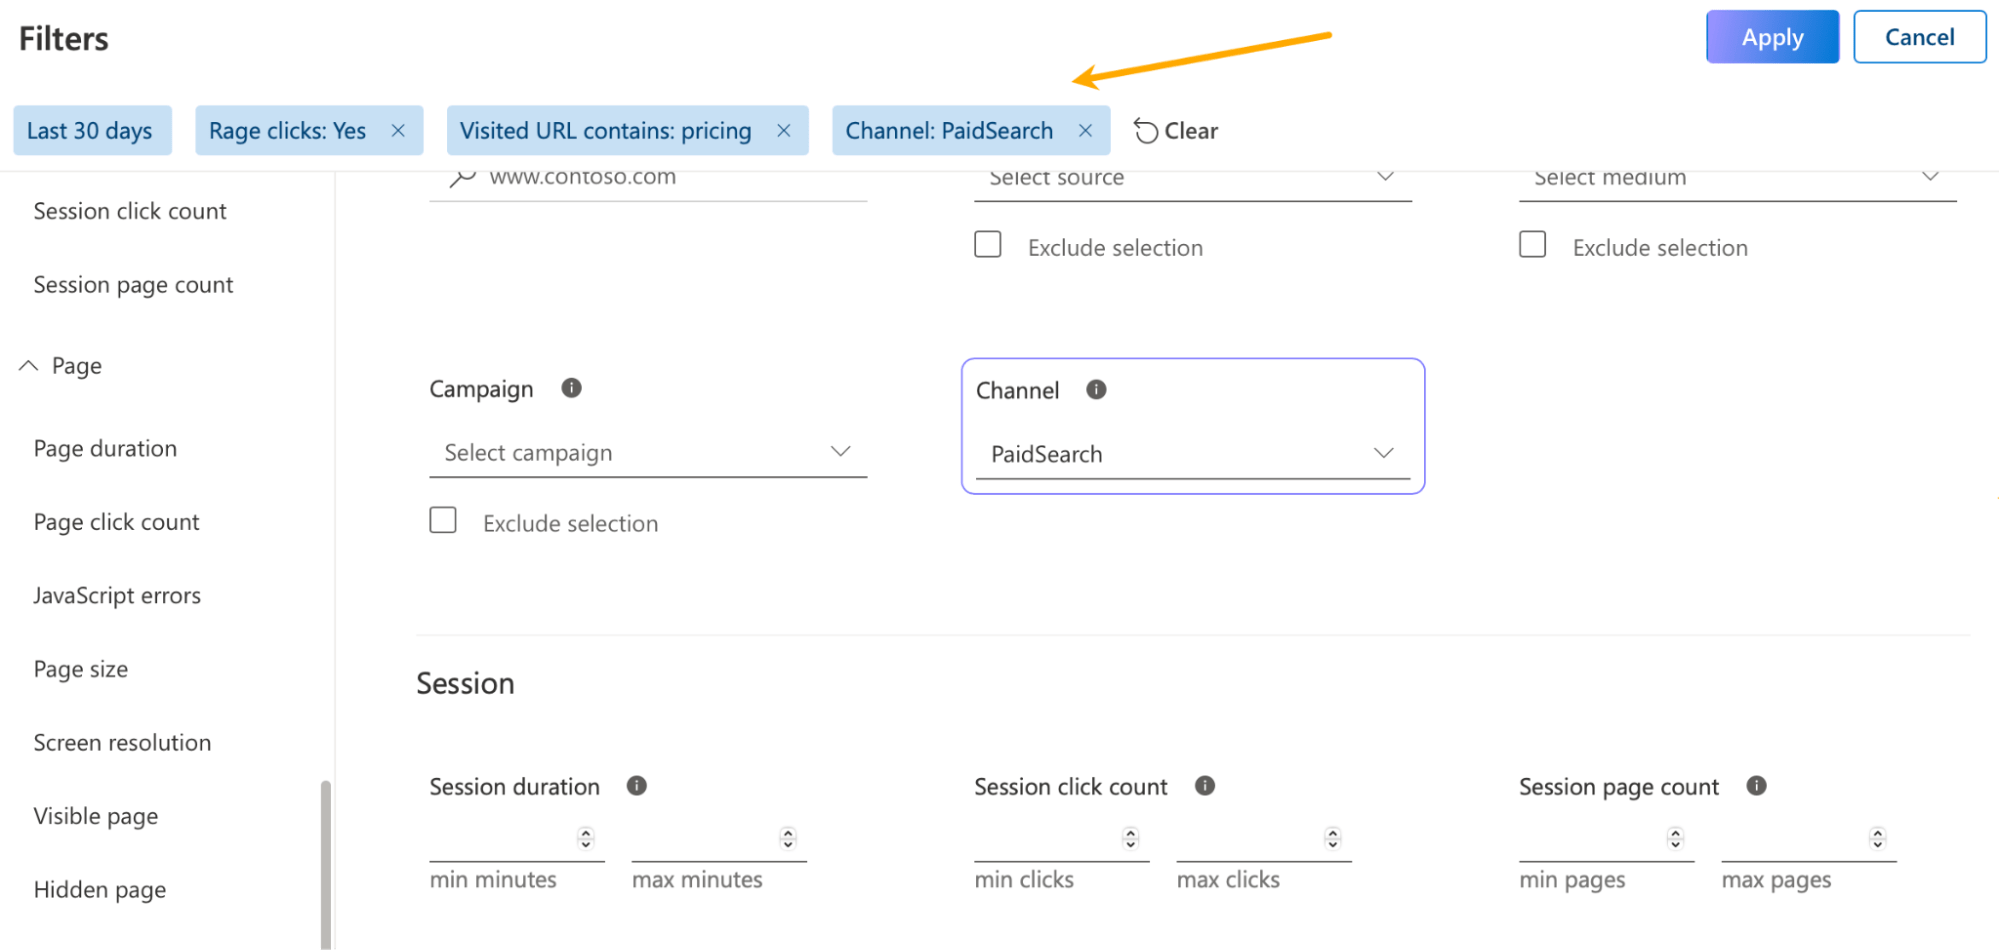
- Use heatmaps to discover user experience issues like rage clicks (rapidly clicking in an area), dead clicks (clicks with no effects), and click-backs (immediately leaving a page).
- Use session recordings to pinpoint places where users might hesitate, get stuck, focus, or skip the content.
Standout feature: Recordings
You can use session recordings to see which parts of your pages, apps or platforms are most engaging and which make you lose clicks (and potentially money). And no worries, users remain anonymous (Microsoft Clarity is GDPR- and CCPA-compliant).
The recording feature looks like this. The thin orange line indicates cursor movement, and the blue circles mean that the user clicked.
Since there’s probably no use in watching all of the recordings, you’ll find the filtering and segmenting option highly useful. For example, you can watch only the sessions with rage clicks or the ones where users viewed the pricing page and entered through Google Ads.
Pricing
Free.
Visual Website Optimizer
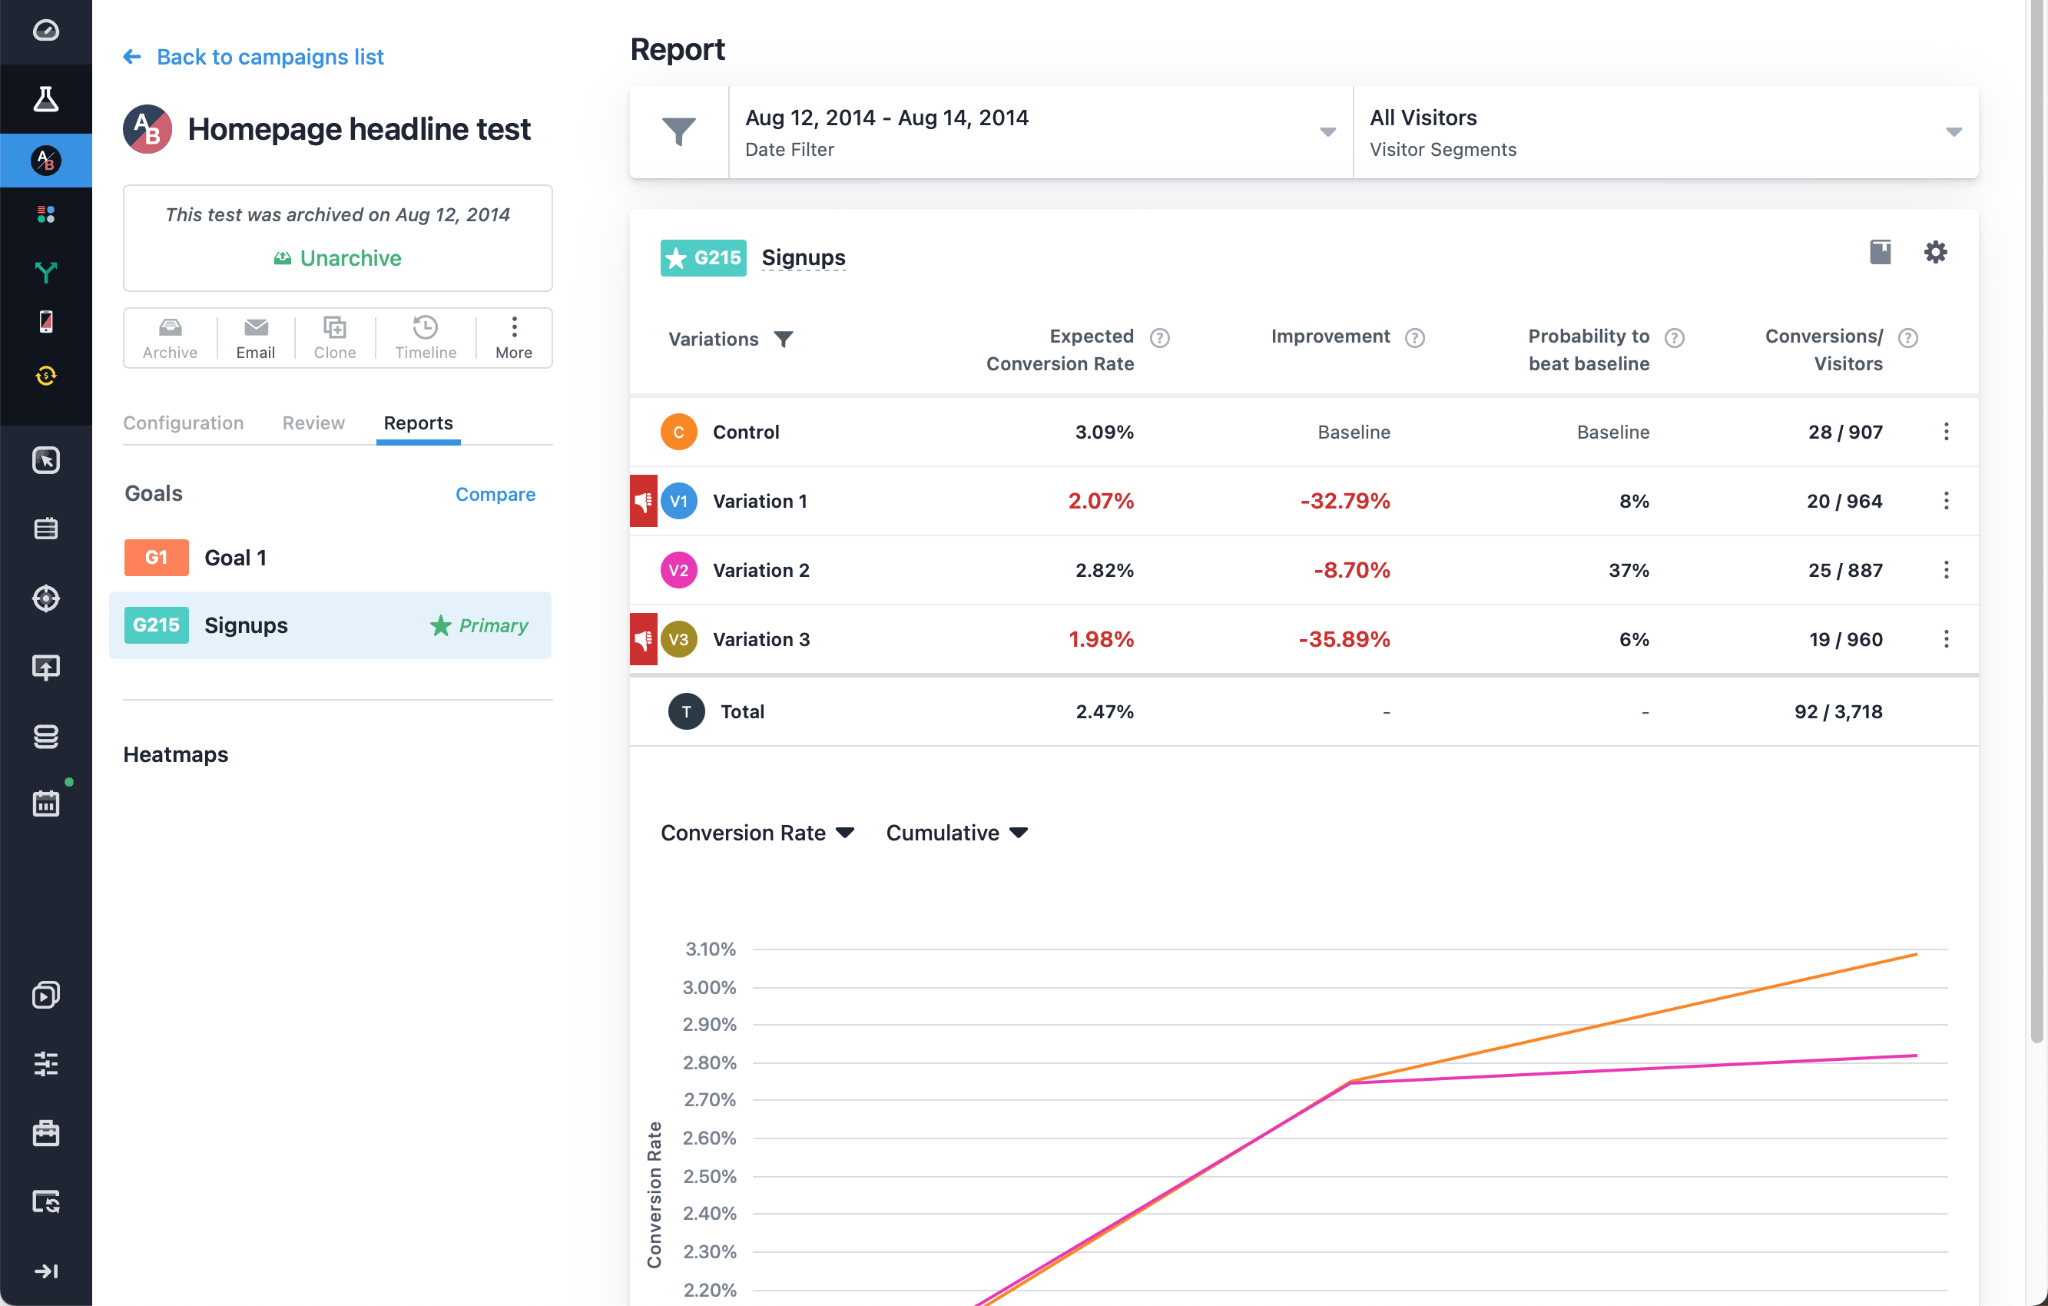
Visual Web Optimizer allows you to run experiments such as A/B testing and choose winning ideas based on data.
If you’re unfamiliar with A/B testing, it’s when you show two or more variations of a webpage to different users simultaneously to determine the best one.
Some argue that you don’t need an A/B testing tool if your website traffic is low; they suggest simply making changes to the site and reverting them if needed. However, A/B testing —and its more advanced counterpart, multivariate testing — offers significant advantages. It allows you to run experiments faster and ensures higher-quality data by testing variations simultaneously, eliminating time-based variables that could
Key use cases
- Create variations of landing pages, forms, CTA buttons, copy, etc., to improve conversions.
- Run on-site surveys to understand what kept users from purchasing a product or signing up.
- Use form analytics on your most important forms to uncover friction points and iterate on their design.
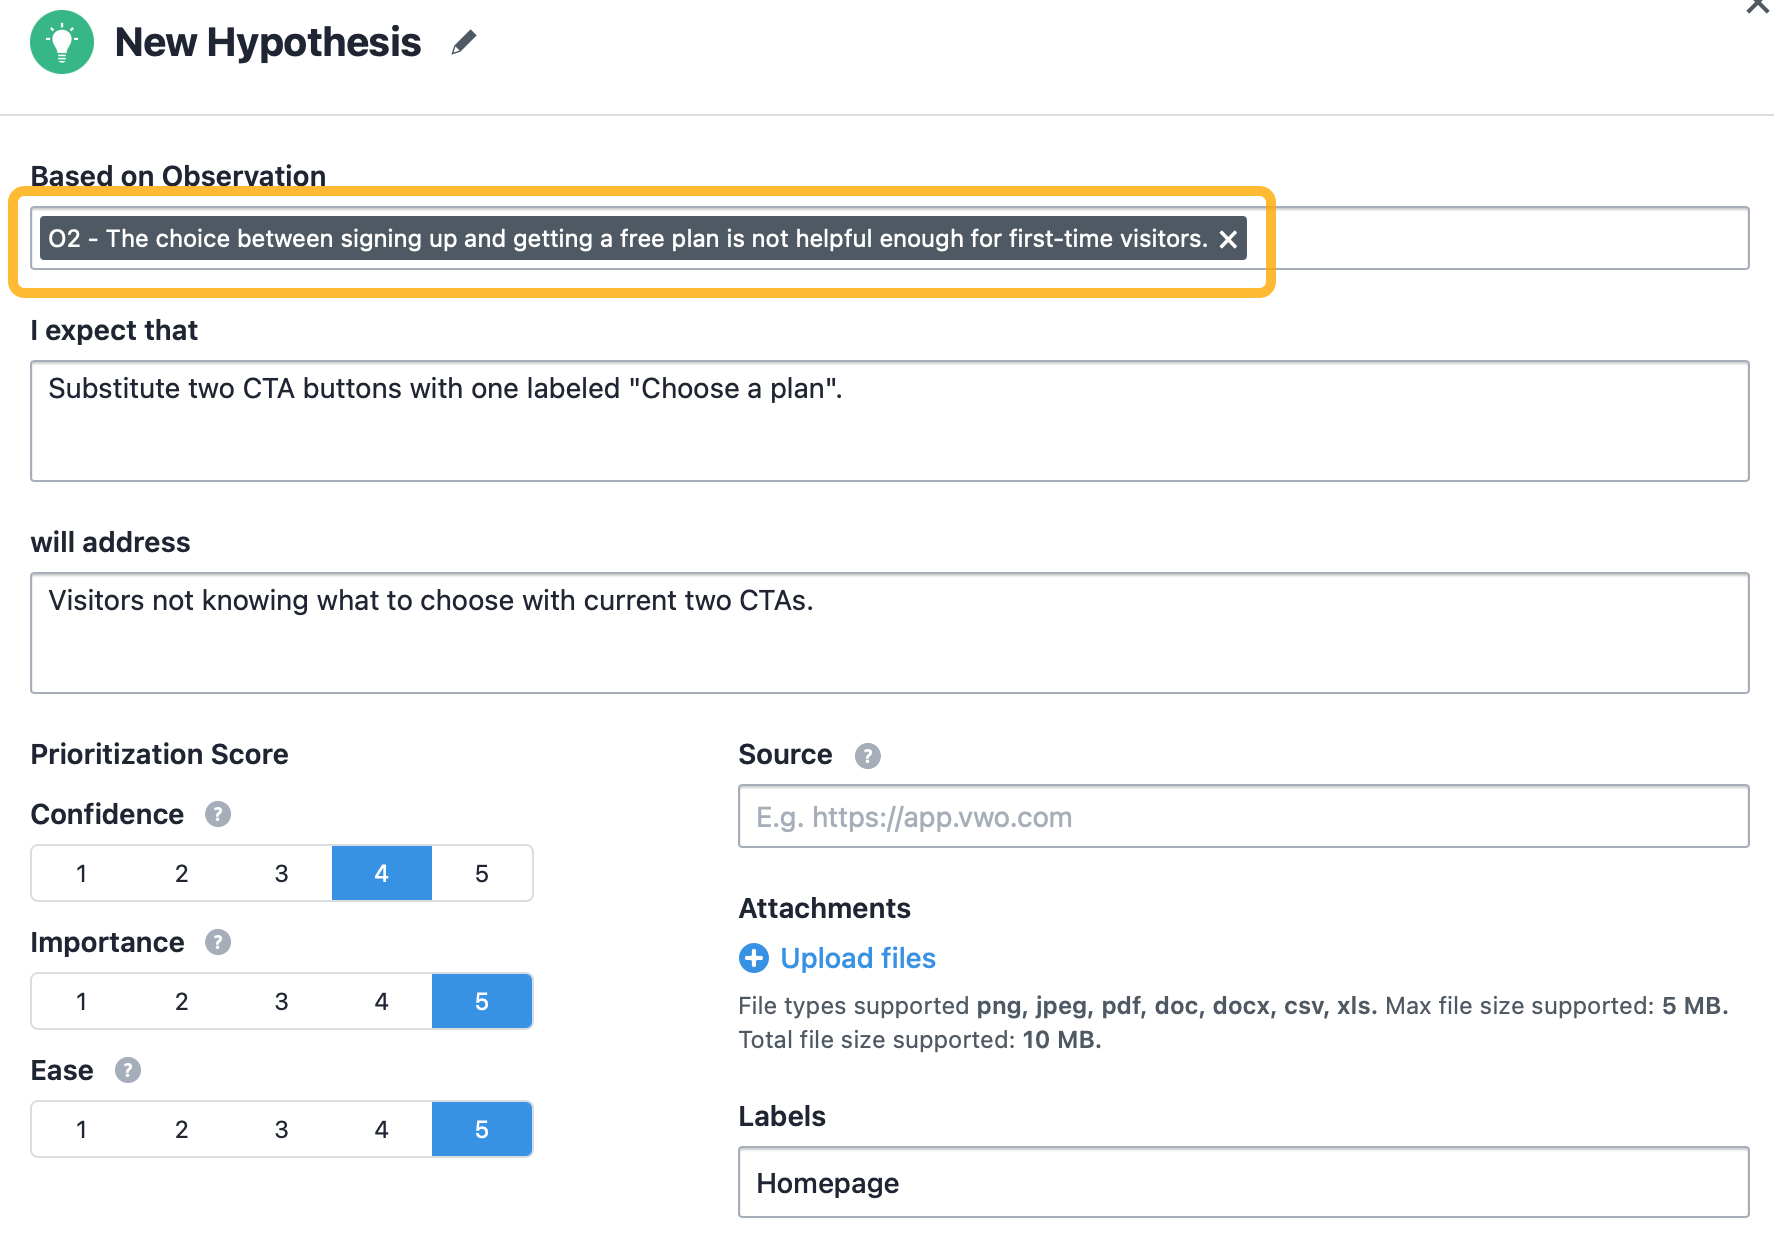
Standout feature: Plan
What I really like about this tool is how it helps you to stay organized with your experiments.
Why is this a problem in the first place? Because it’s too easy to get lost in dozens of experiments and what they really mean. This feature keeps it all organized and reminds you to plan your experiments—otherwise, you’ll be shooting in the dark.
Meet the Plan feature. It allows you to:
- Plan your experiments and document what exactly you’re testing and why.
- Collaborate by assigning tests to other team members.
- Structure your work the scientific way. Note down your observations, create hypotheses when you know what to change on your site or app, and link them to different experiments when you’re ready to act.
Pricing
Free plan available. Premium plans start at $190/month for the core tool and depend on the number of users you want to track per month and optional tools.
Runner ups
If you want to give AI a go at your user recording, try UXsniff. The tool analyzes session recordings and identifies abnormal click patterns.
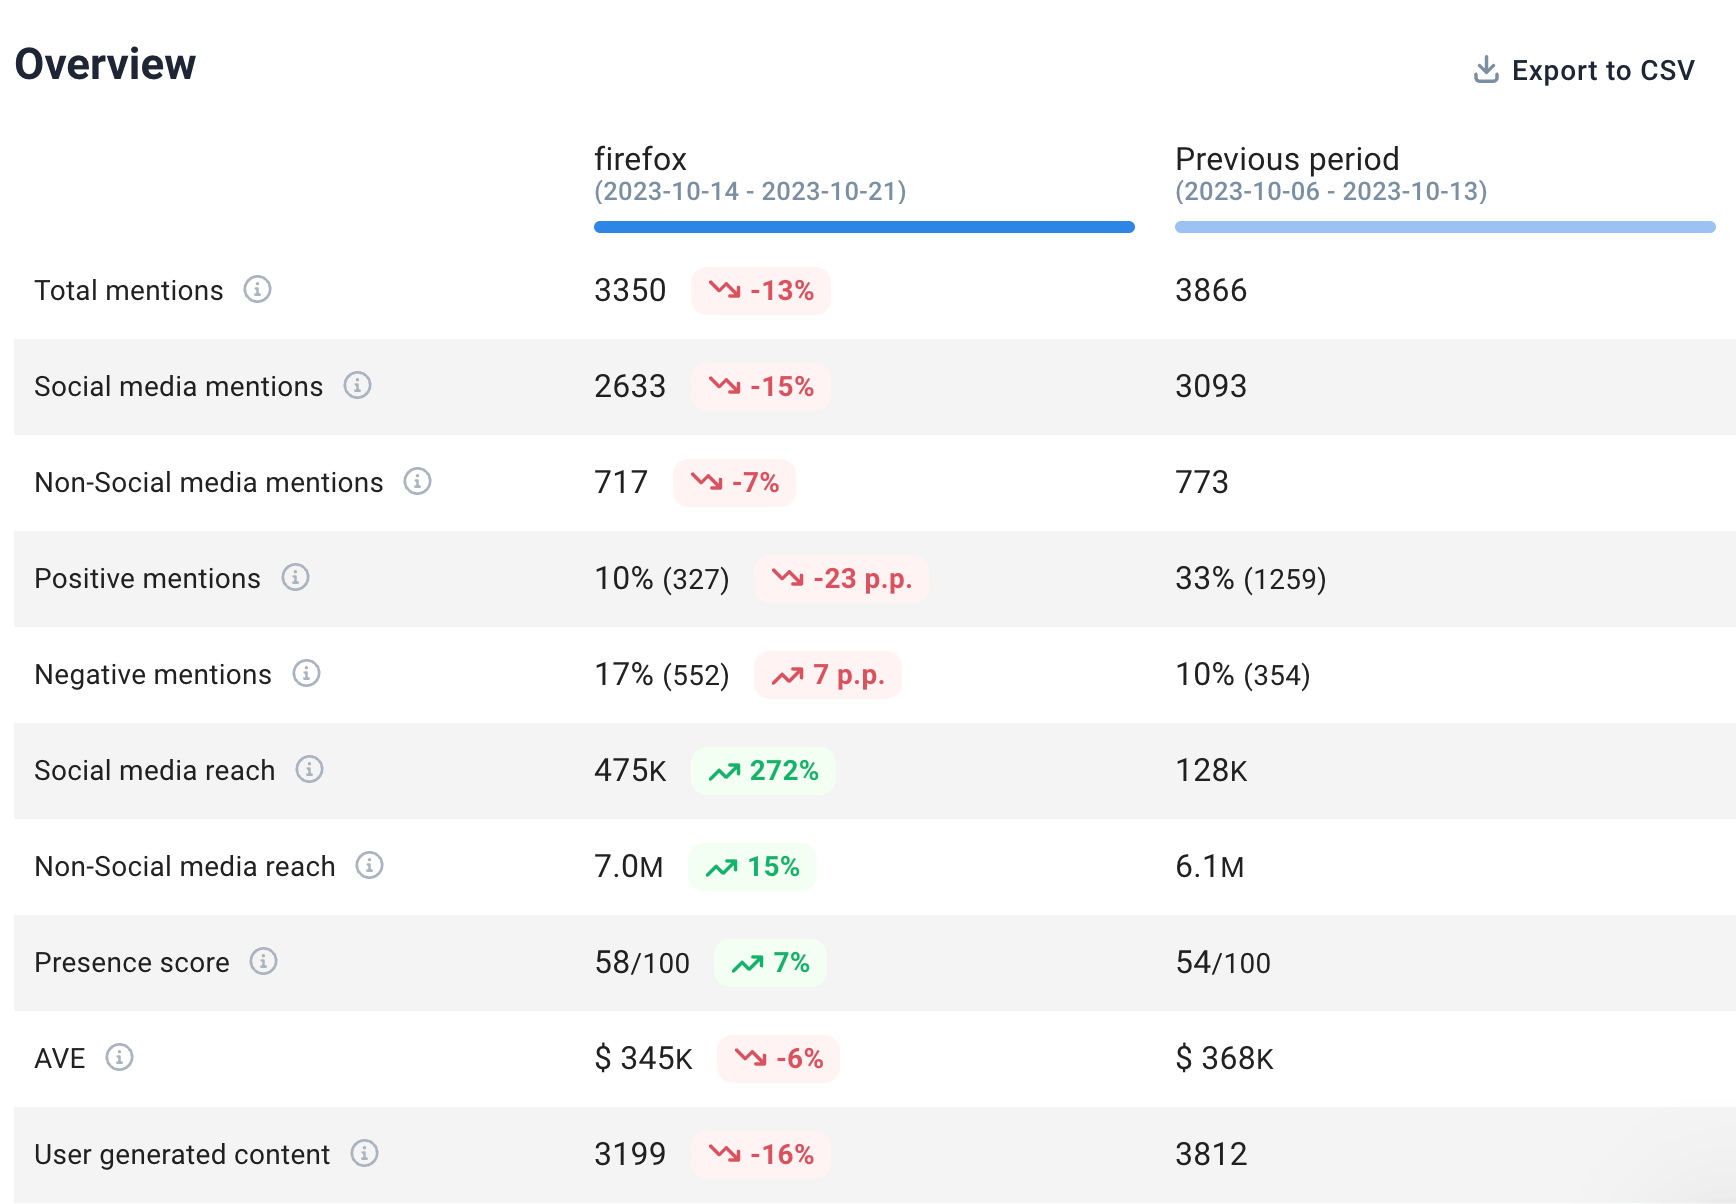
Brand24
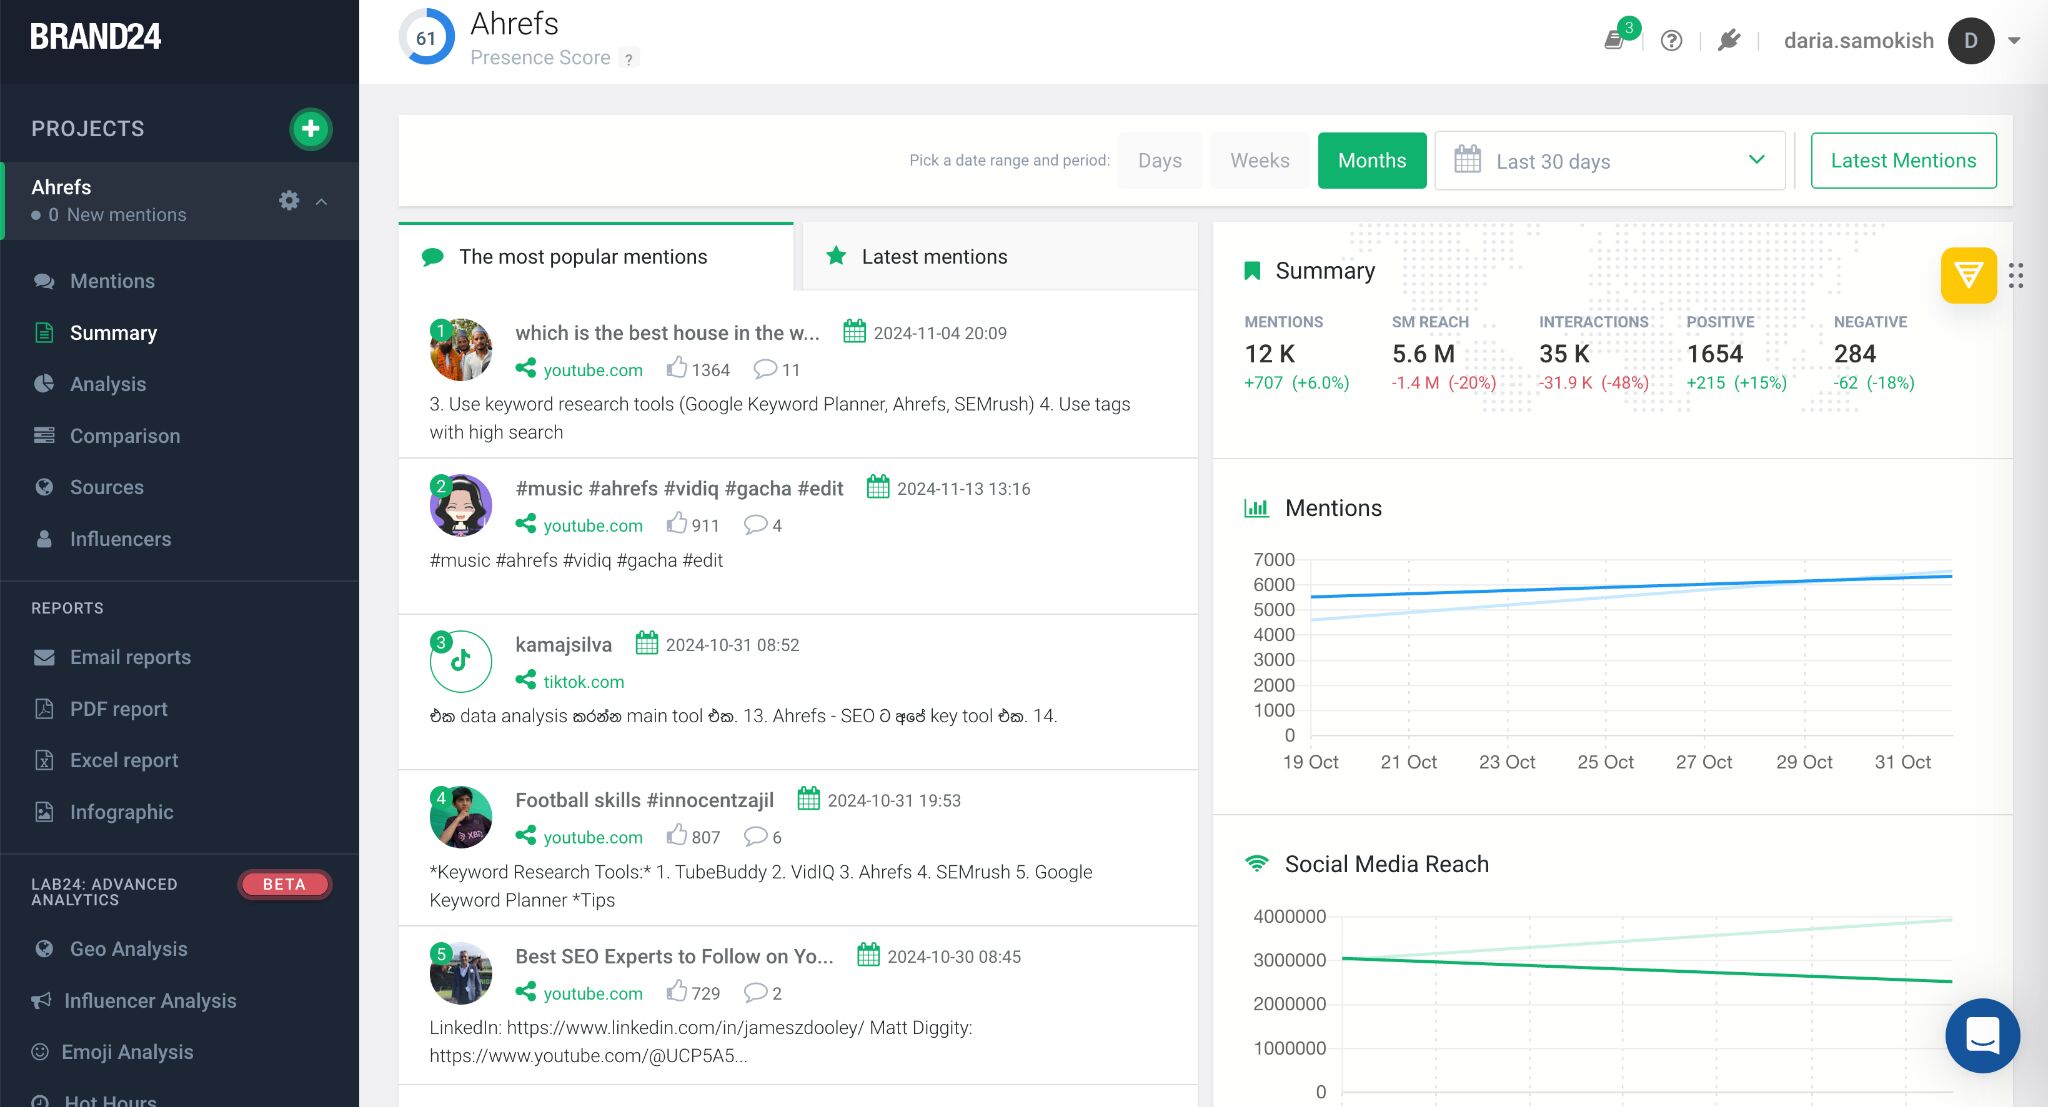
Brand24 is a media monitoring tool. Basically, it tells you what the internet thinks about you and how often it mentions your brand — and that isn’t limited to social media. It can do the same for your competitors or any other brand you want to look up.
Three of the last companies I worked for used this tool and it always delivered valuable data. I think you’ll find it hard to try to keep track of all your social media interactions, mentions, and campaigns without a centralized platform like Brand24.
Key use cases
- Analyze your social media performance by monitoring the reach of your campaigns and engagement with your content.
- Discover public opinion of your brand and your products by using sentiment analysis. In the short term, you can analyze people’s reactions to particular events (e.g., new features), while long-term analysis allows you to spot trends.
- Be the first to know when there’s a sudden spike in engagement. Jump in when there’s a crisis or when your campaigns start to take off.
Standout feature: Comparison
This feature has two aspects. The first one is for competitive analysis. It lets you compare brands to see who has a wider reach on the web and who has been mentioned more often in a positive context.
This allows you to use other brands as benchmarks and track your performance against theirs.
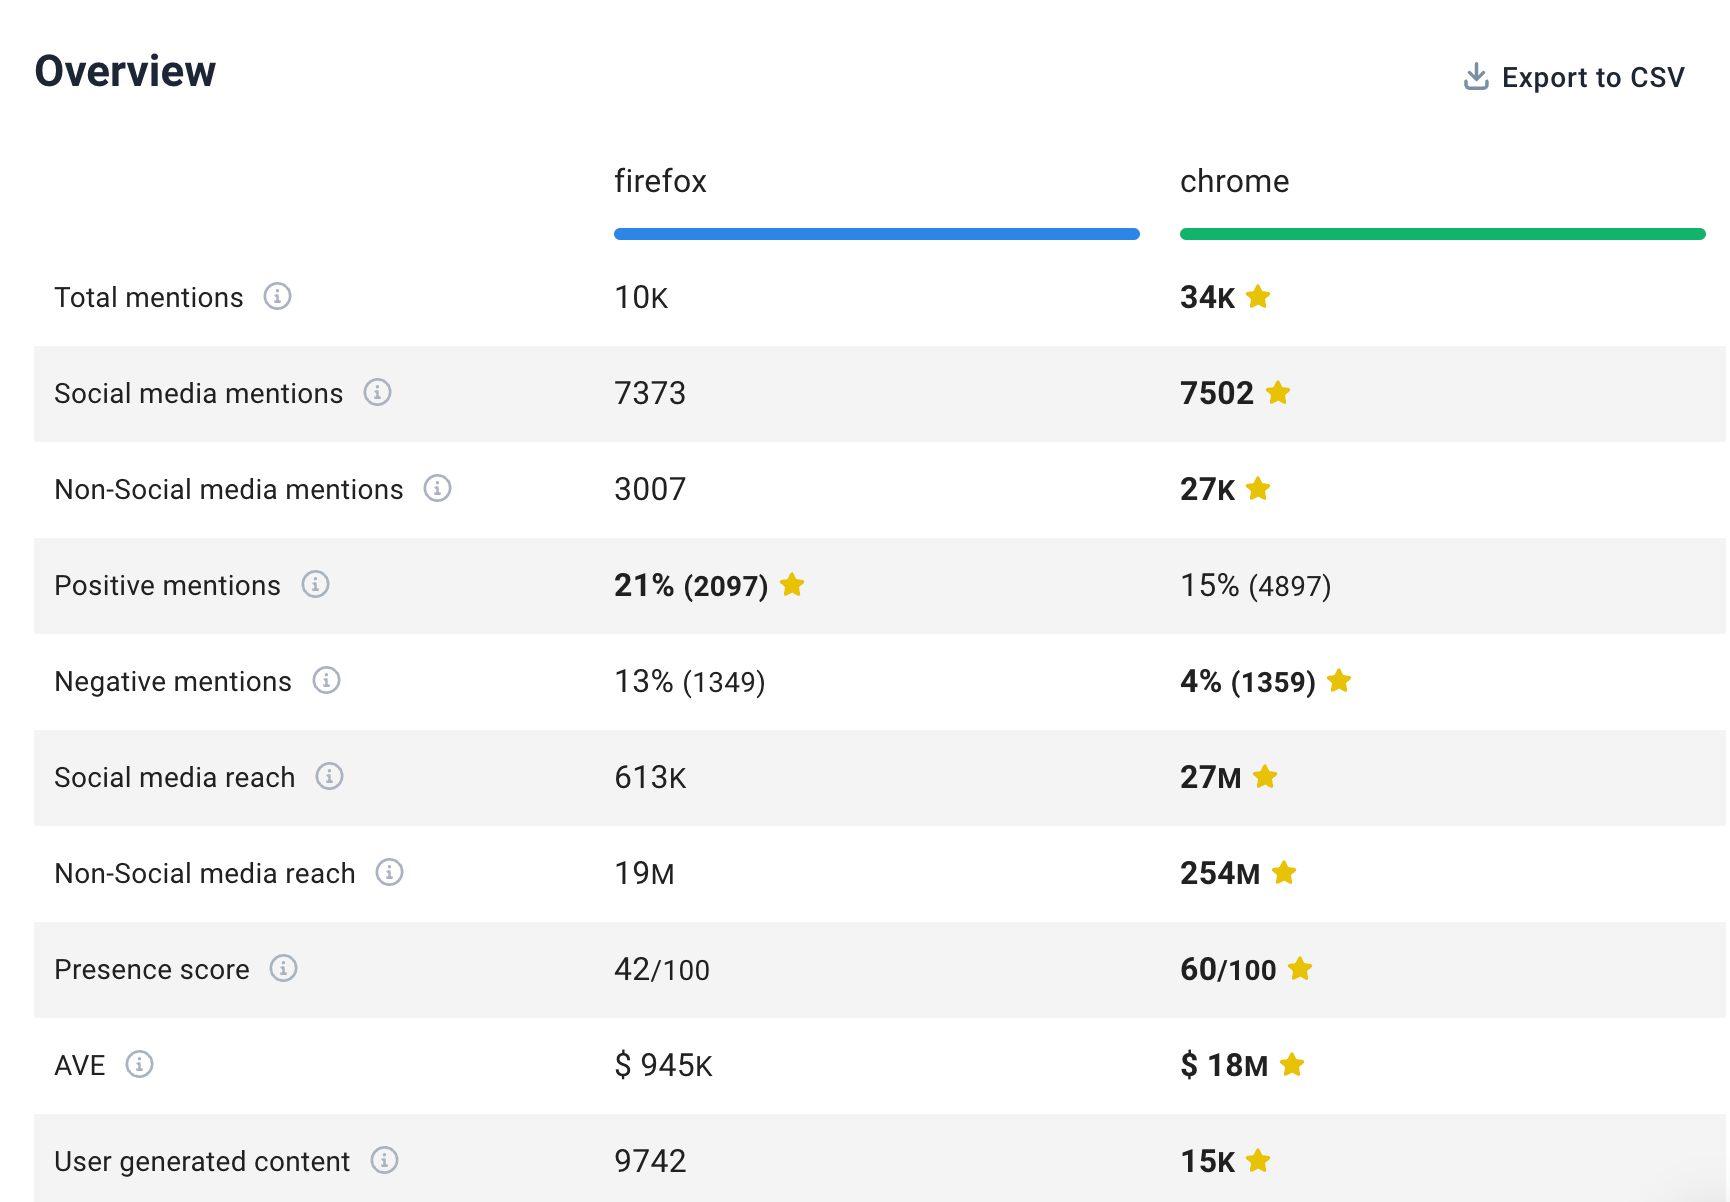
The other aspect is for comparing your performance period over period. So, for example, you can see if your efforts made you more popular on social media this quarter or see if your PR efforts changed how people feel about you.
Pricing
Premium plans start at $149 a month. You can get two months free off any plan if you pay annually.
Brand24 also offers a 14-day free trial.
Klipfolio
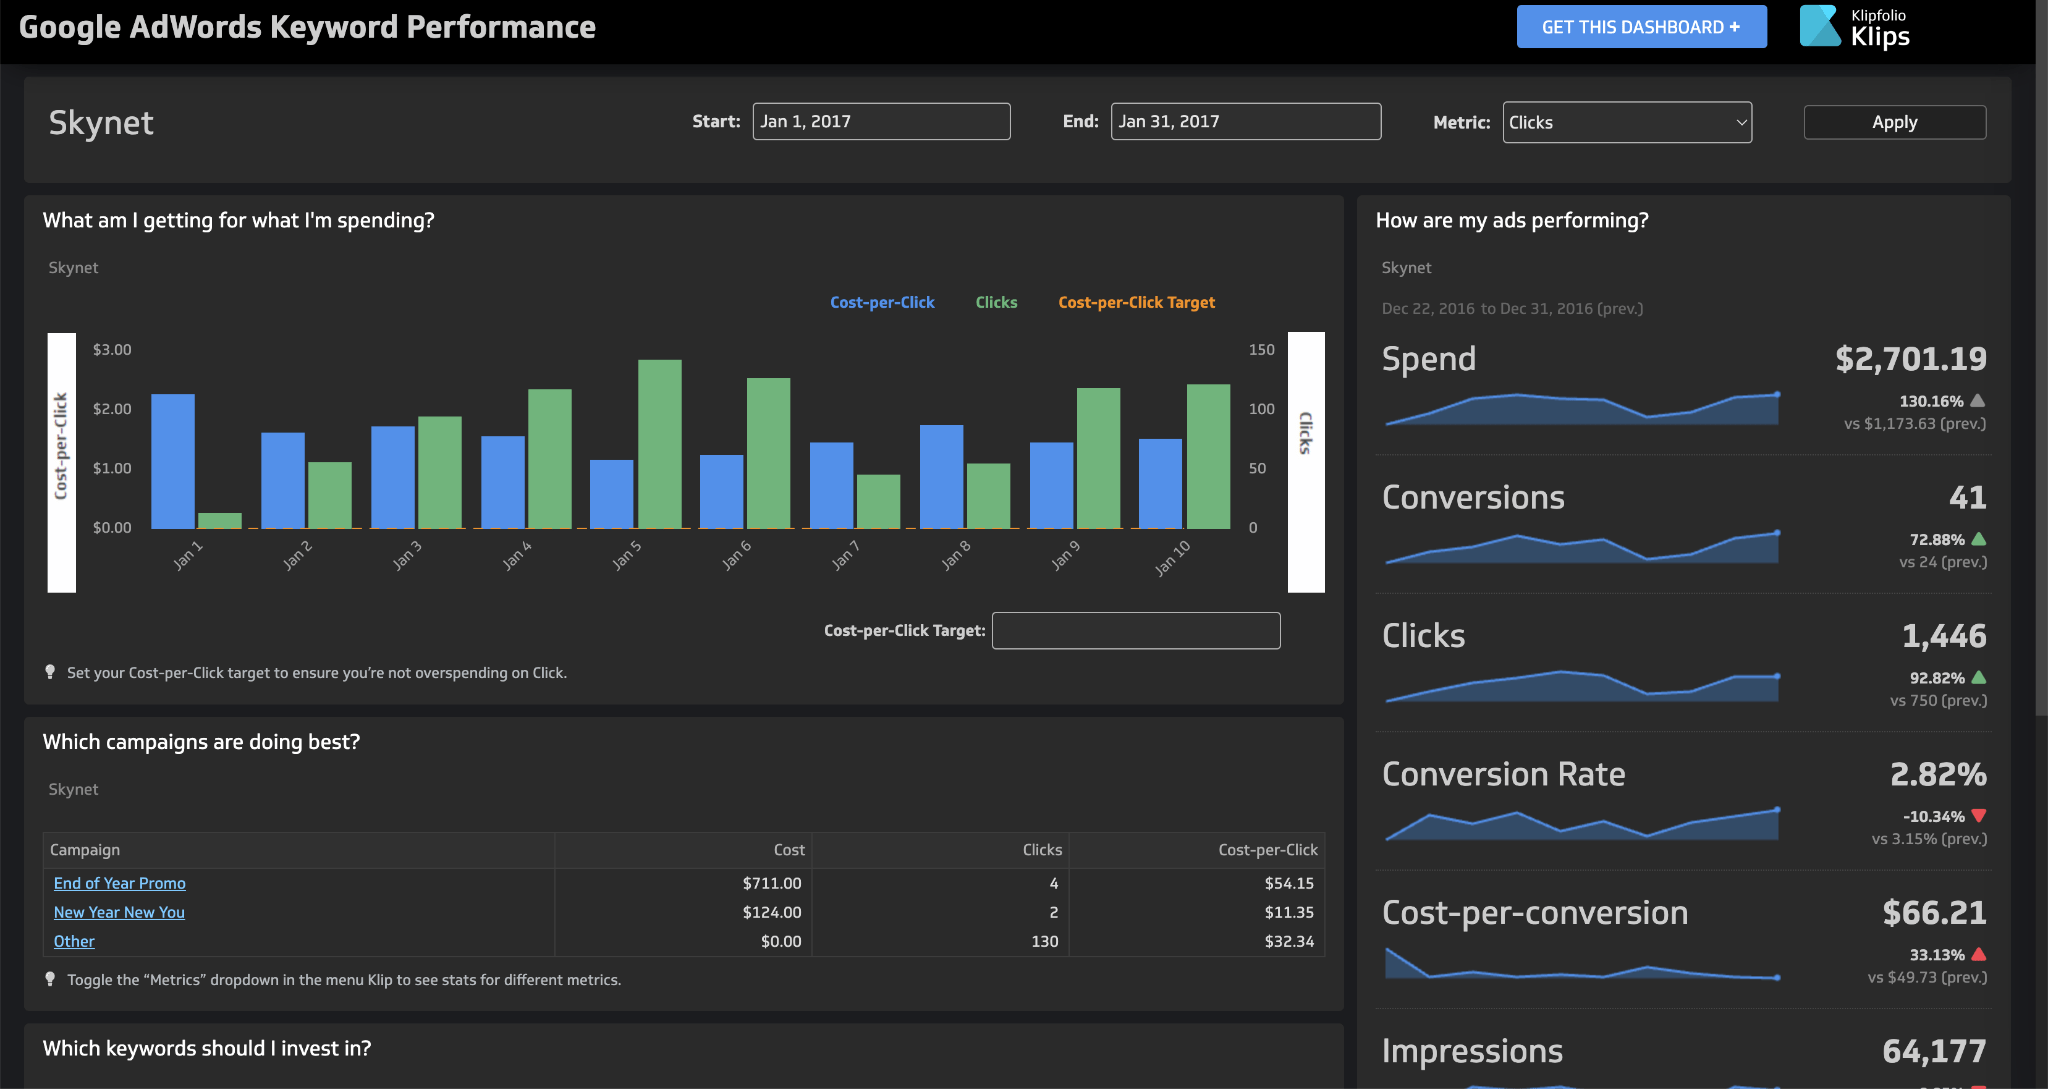
Klipfolio is a business analytics tool that allows you to gather the most important reports from other marketing analytics tools and put them on one neat dashboard that you can share online or put on a big screen in the office for everyone to see.
Klipfolio actually offers two distinct products since 2023: PowerMetrics and Klips. While PowerMetrics caters to larger enterprises, Klips is perfect for individuals, teams, and smaller businesses seeking a powerful yet flexible way to visualize their data.
I’d use Klipfolio if I wanted to create multiple dashboards for a presentation or for myself/my team to understand the data better. Or to visualize the team’s progress and impact on the company’s bottom-line metrics, combining data from different sources. In situations like these, you can’t really expect investors and management to know their way around your analytics tools.
Key use cases
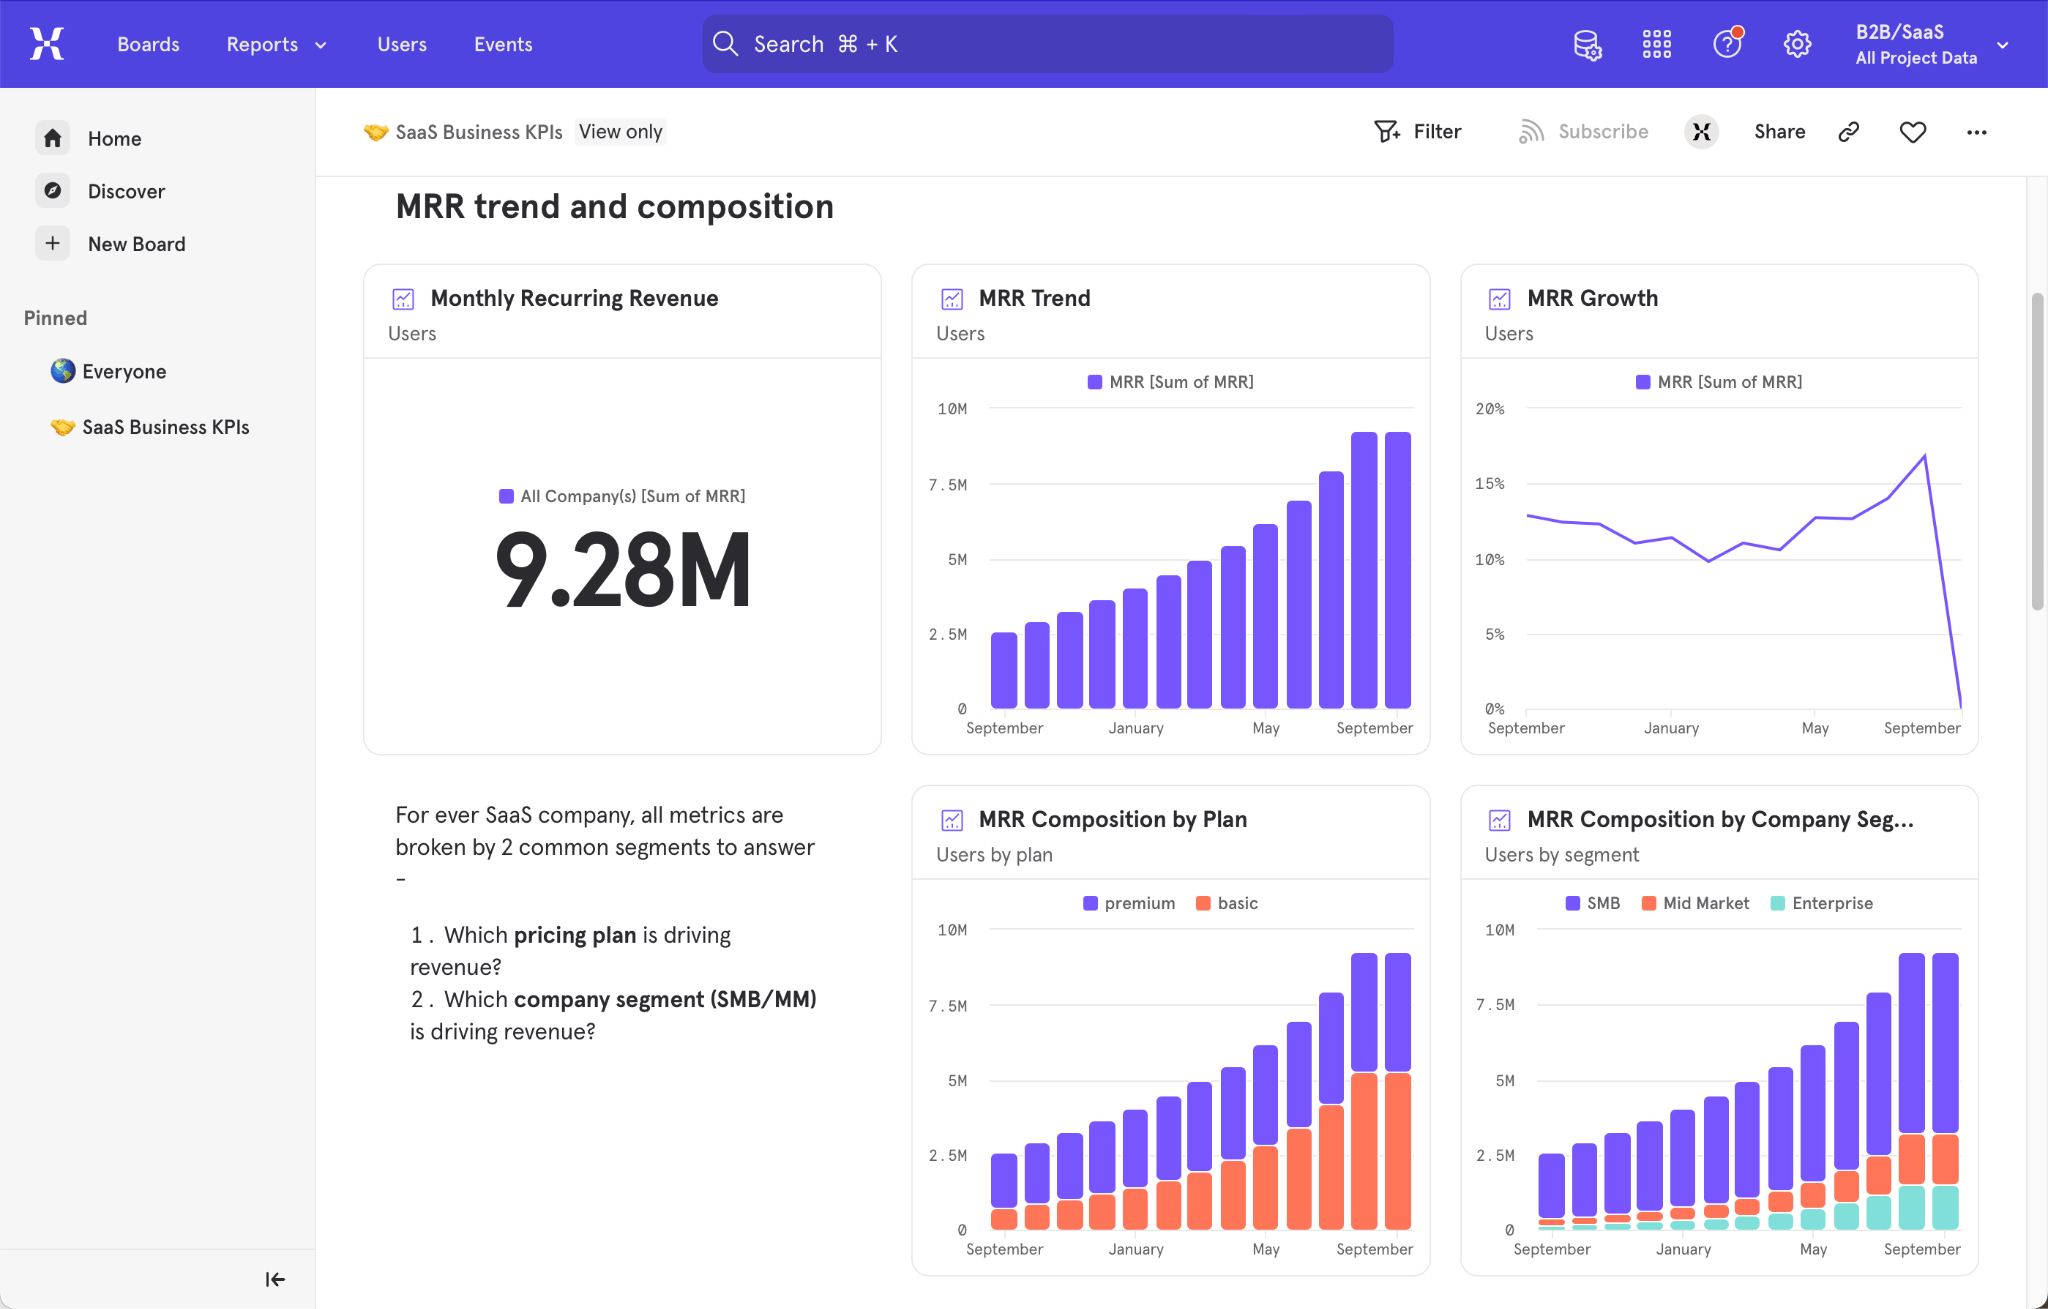
- Instead of jumping from tool to tool, you can get a glance at your most important data in one place: new leads, page views, brand mentions, goal completion rate, monthly recurring revenue (MRR), etc.
- Put data from different sources on the same chart. For example, you can see if an increase in ad spending impacts MRR.
- Share data with stakeholders who have no access to other analytics tools (or don’t know how to use them): investors, management, and other departments in the company.
If you want to get a feel of their dashboards, you can browse the gallery here.
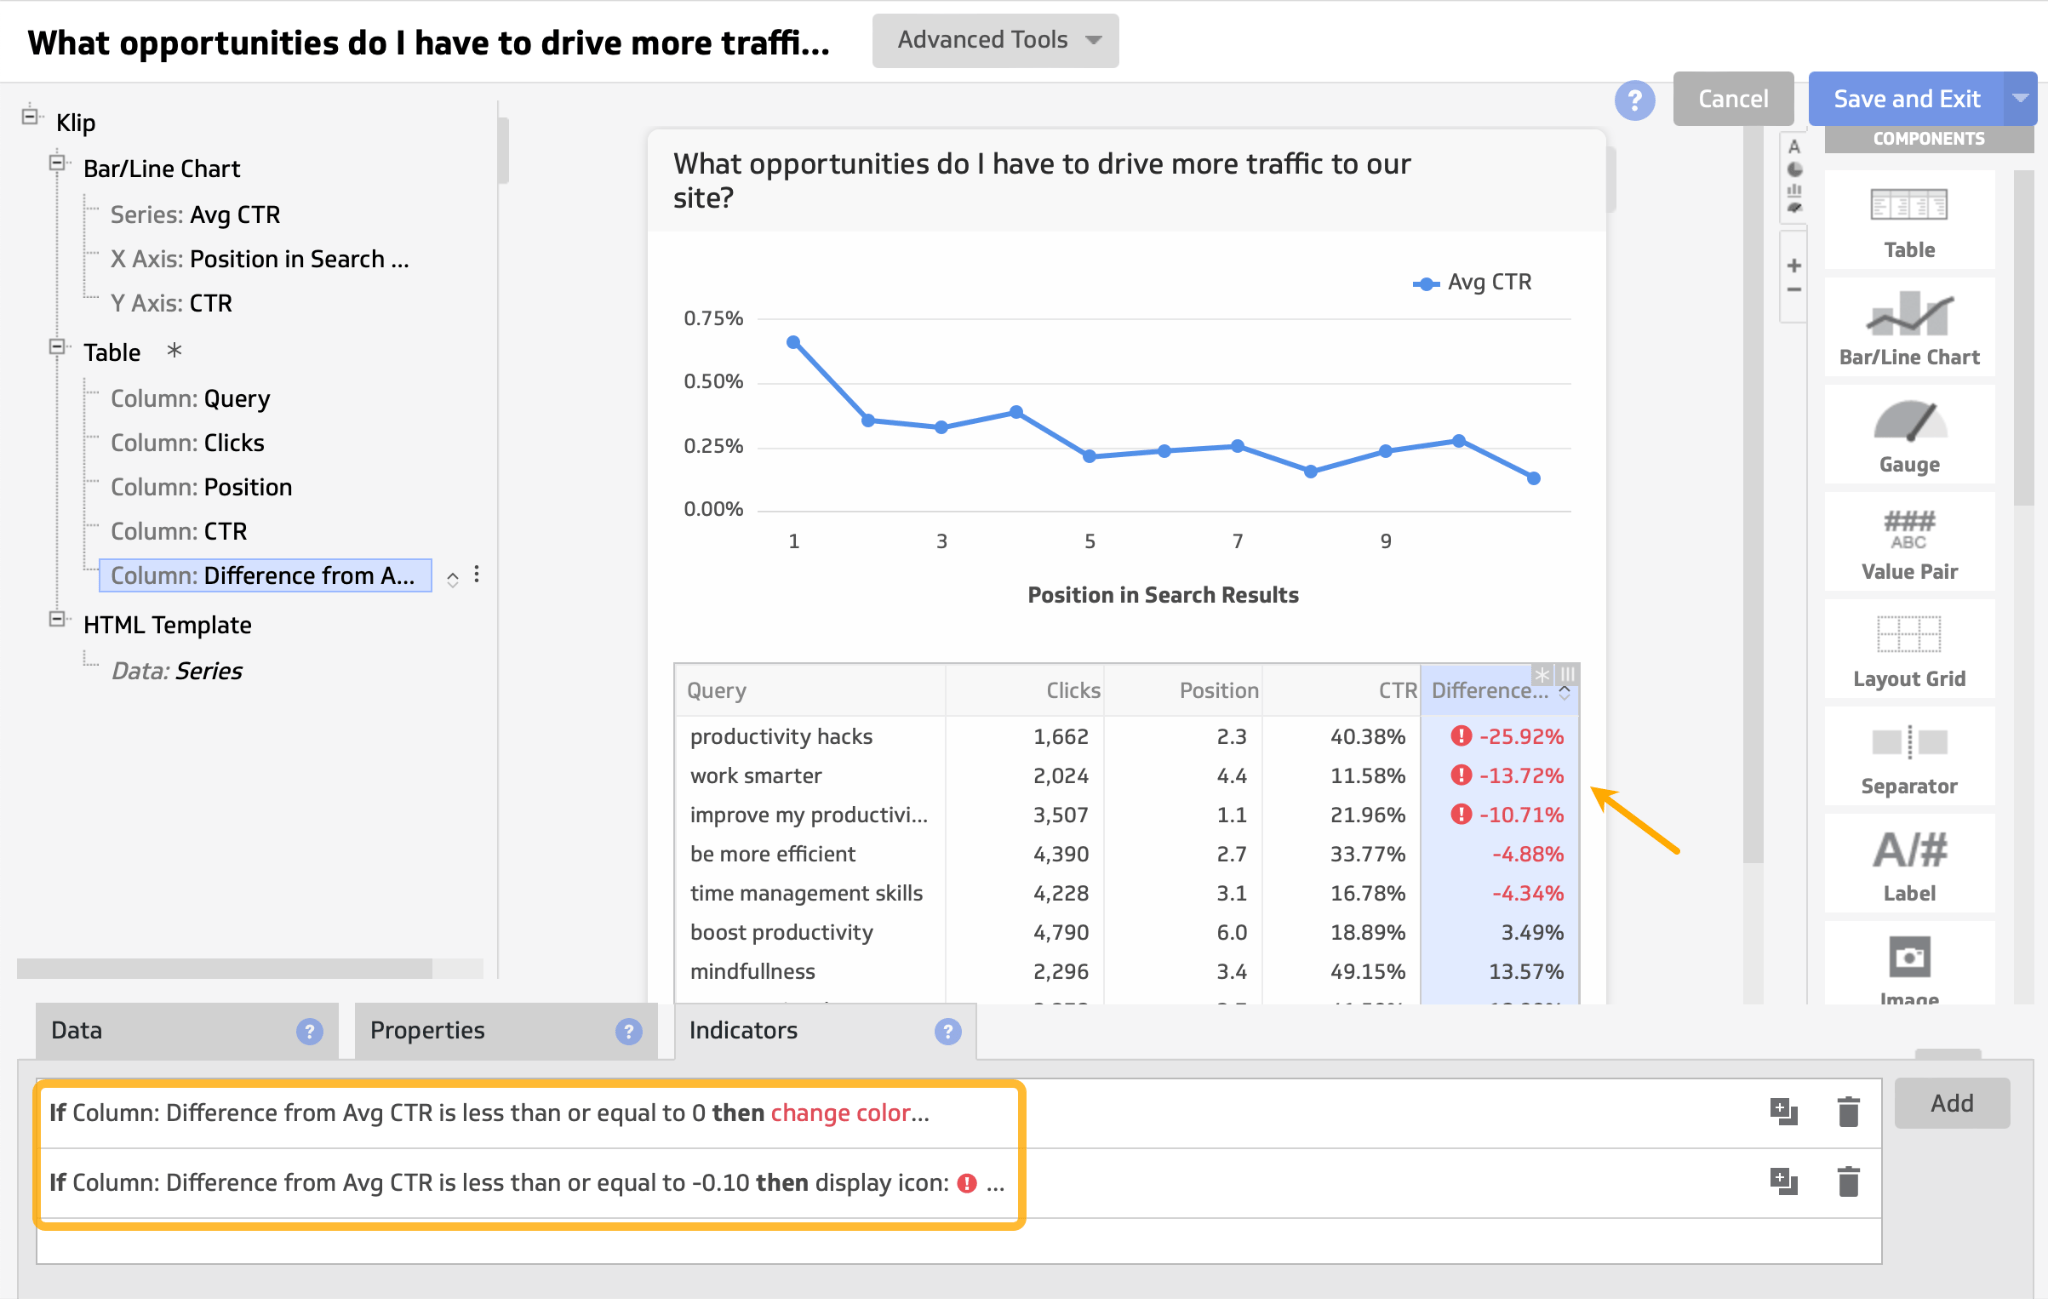
Standout feature: Data transformation
You might be wondering why would you pay for Klipfolio while you could use Google Looker Studio. One of the reasons is what Klipfolio can do with data and where can it get the data from.
Klipfolio shines when you need to bring together data from many different places. It has pre-built connections to tons of marketing platforms, databases, and other tools (more than Looker Studio).
You can also do a lot of data cleaning and manipulation right within Klipfolio, which saves you time. If you need to track complex metrics or set up automatic alerts, Klipfolio has you covered with its powerful formulas and automation features.
It’s also built for teams, with features that help you manage who has access to what data. If you ever get stuck, Klipfolio has great customer support to help you out.
For example, if your content’s clickthrough rate dips below average, the tool will automatically flag it, ensuring that no one on your team misses this insight.
Pricing
Free plan available. Premium plans start from $90/mo.
ProfitWell
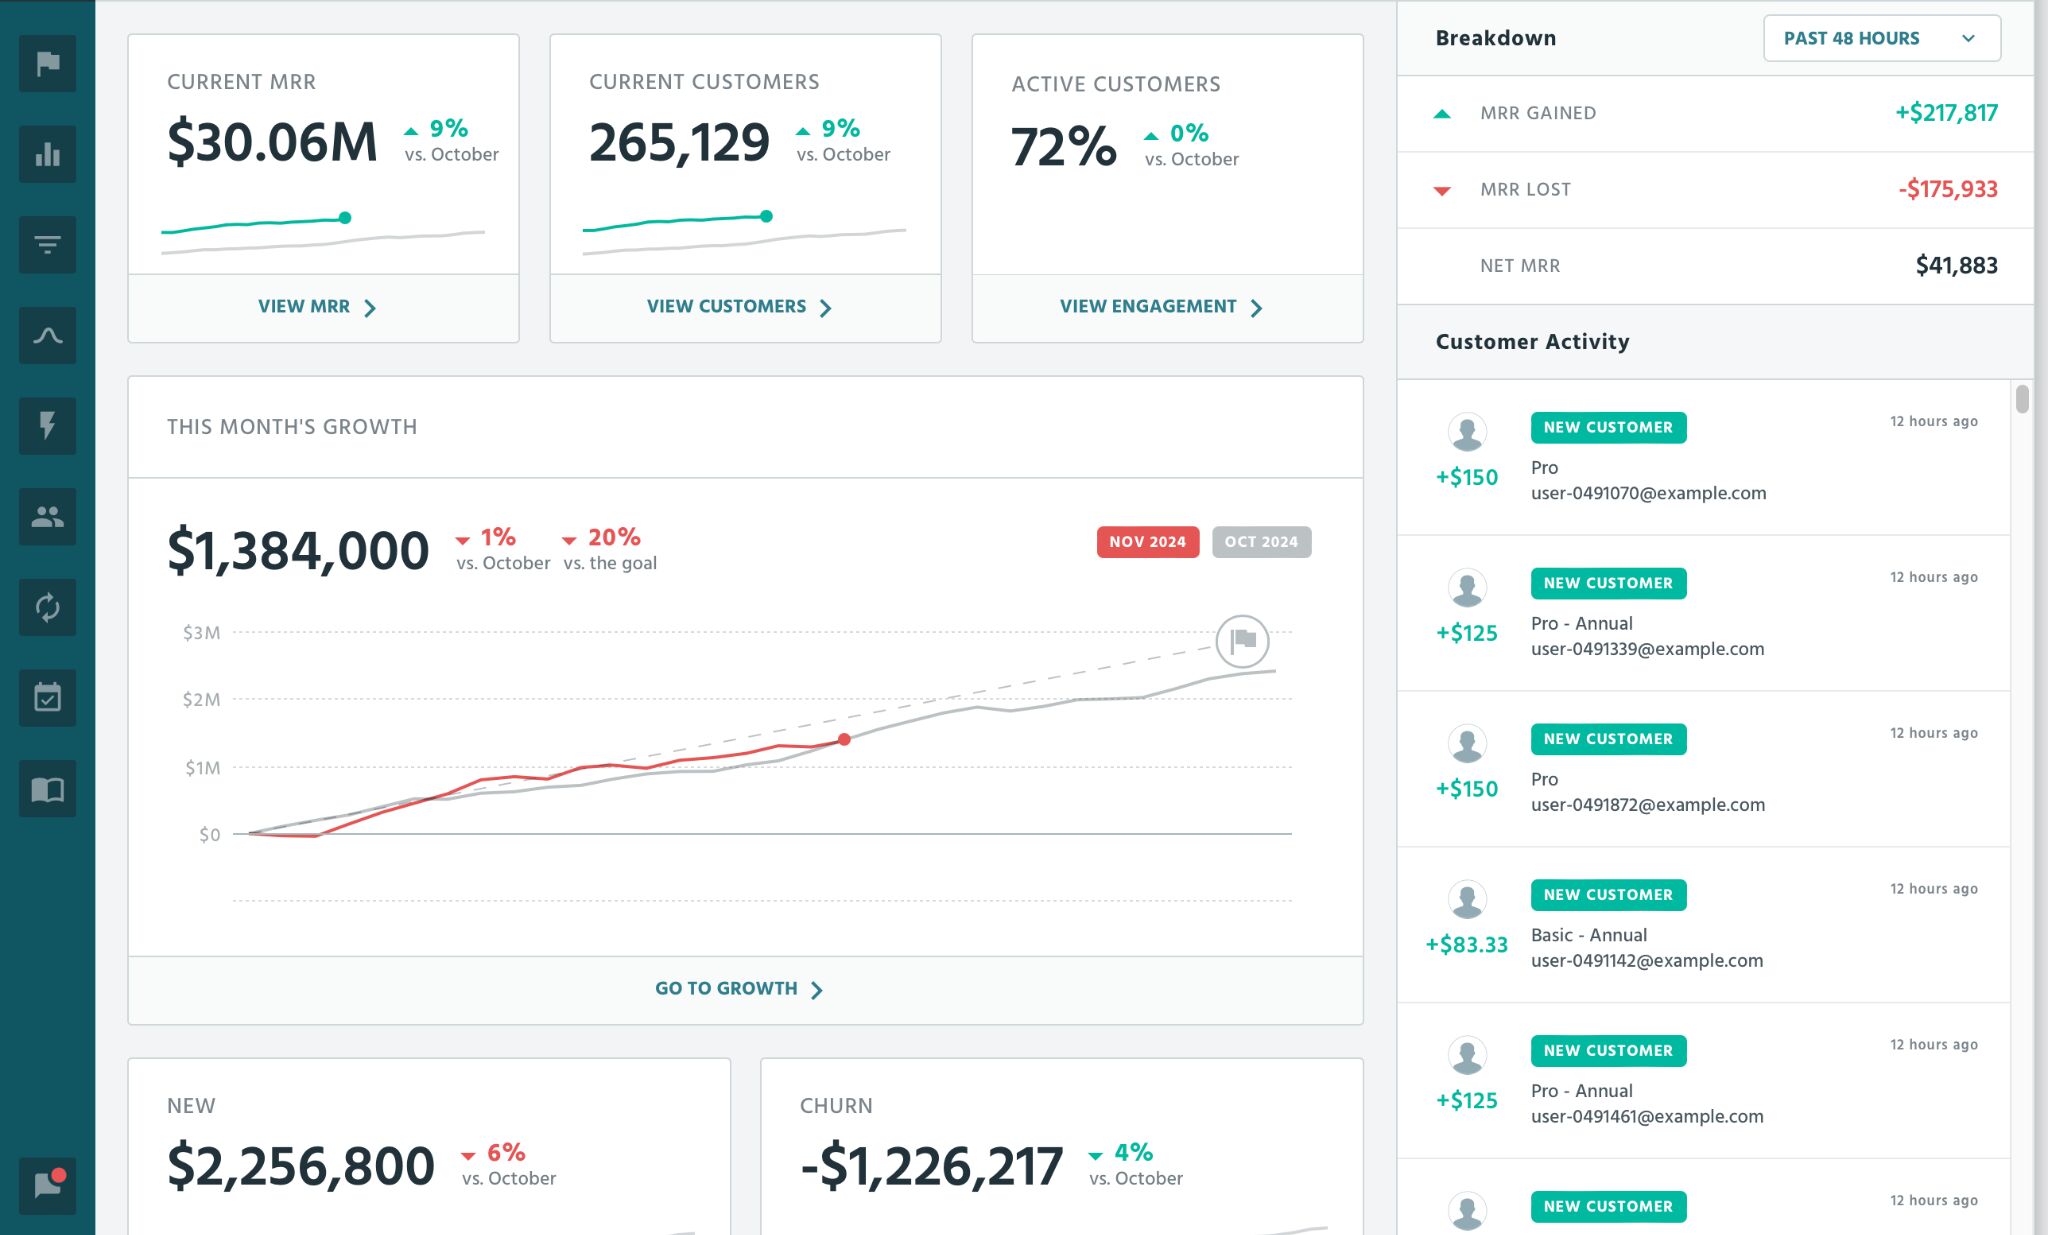
ProfitWell Metrics (part of Paddle) is a subscription management and revenue optimization platform designed for SaaS companies and subscription-based businesses. It helps you understand your revenue metrics and improve subscription retention.
While I won’t claim to be a predictable revenue guru, I do know this: you deserve better than wrestling with spreadsheets or trying to make sense of your payment data. A purpose-built tool like ProfitWell is essential for any business serious about understanding its financial health and driving sustainable growth.
Key use cases
- Gain insights into your subscription metrics, including Monthly Recurring Revenue (MRR), Churn Rate, Average Revenue Per User (ARPU), and Customer Lifetime Value (CLTV).
- Identify inactive users across all subscription plans to prevent churn.
Standout feature: Growth Rate
ProfitWell packs a few interesting features, but the one you’ll probably be using it for the most is the simplest of all — your MRR growth rate.
The tool will prepare a nice visual answer to two questions: “is the business growing?”, and “why are we losing money?”.
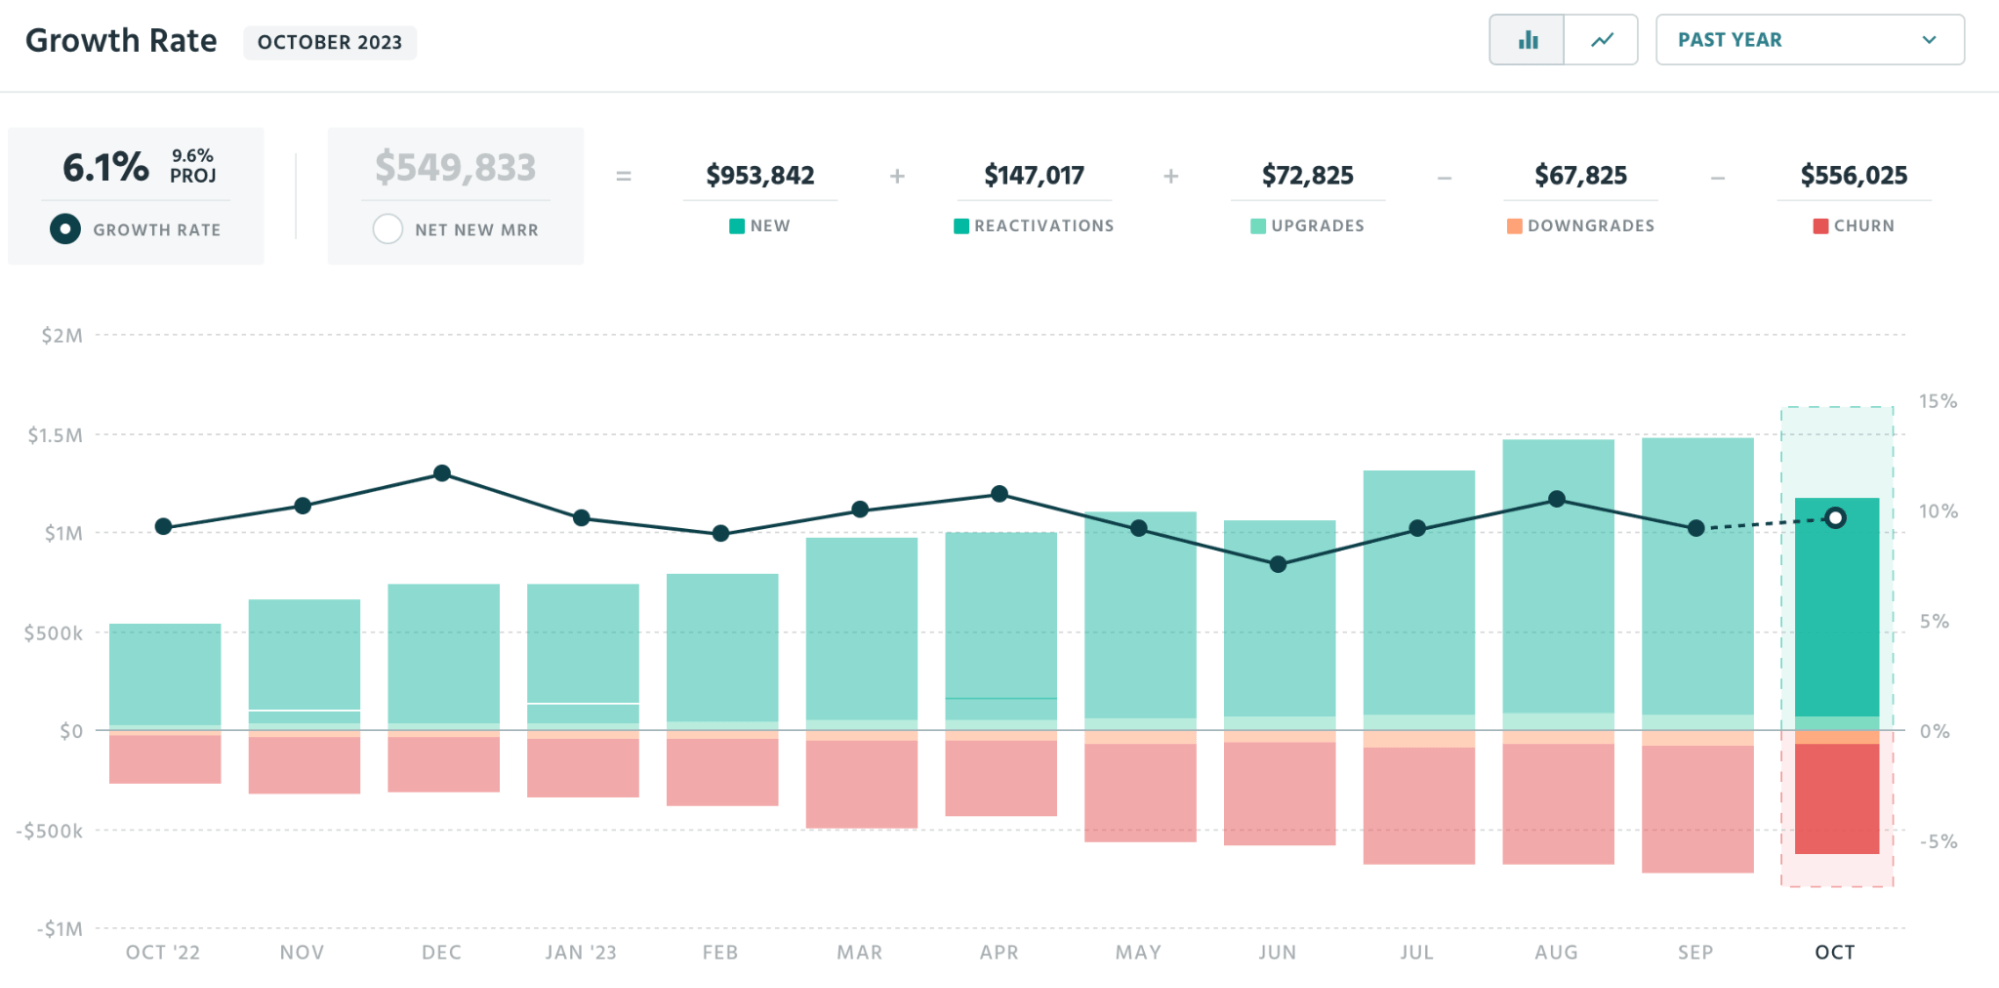
This is something you’ll definitely want to check if you want to know how your marketing tactics impact your sales. Also, this is the vital graph for determining whether your churn rate is at an acceptable level or growing.
Pricing
Free.
Runner ups
If you don’t see integration with your payment provider on the list (e.g. PayPal or App Store), consider ChartMogul or Baremetrics.
vidIQ
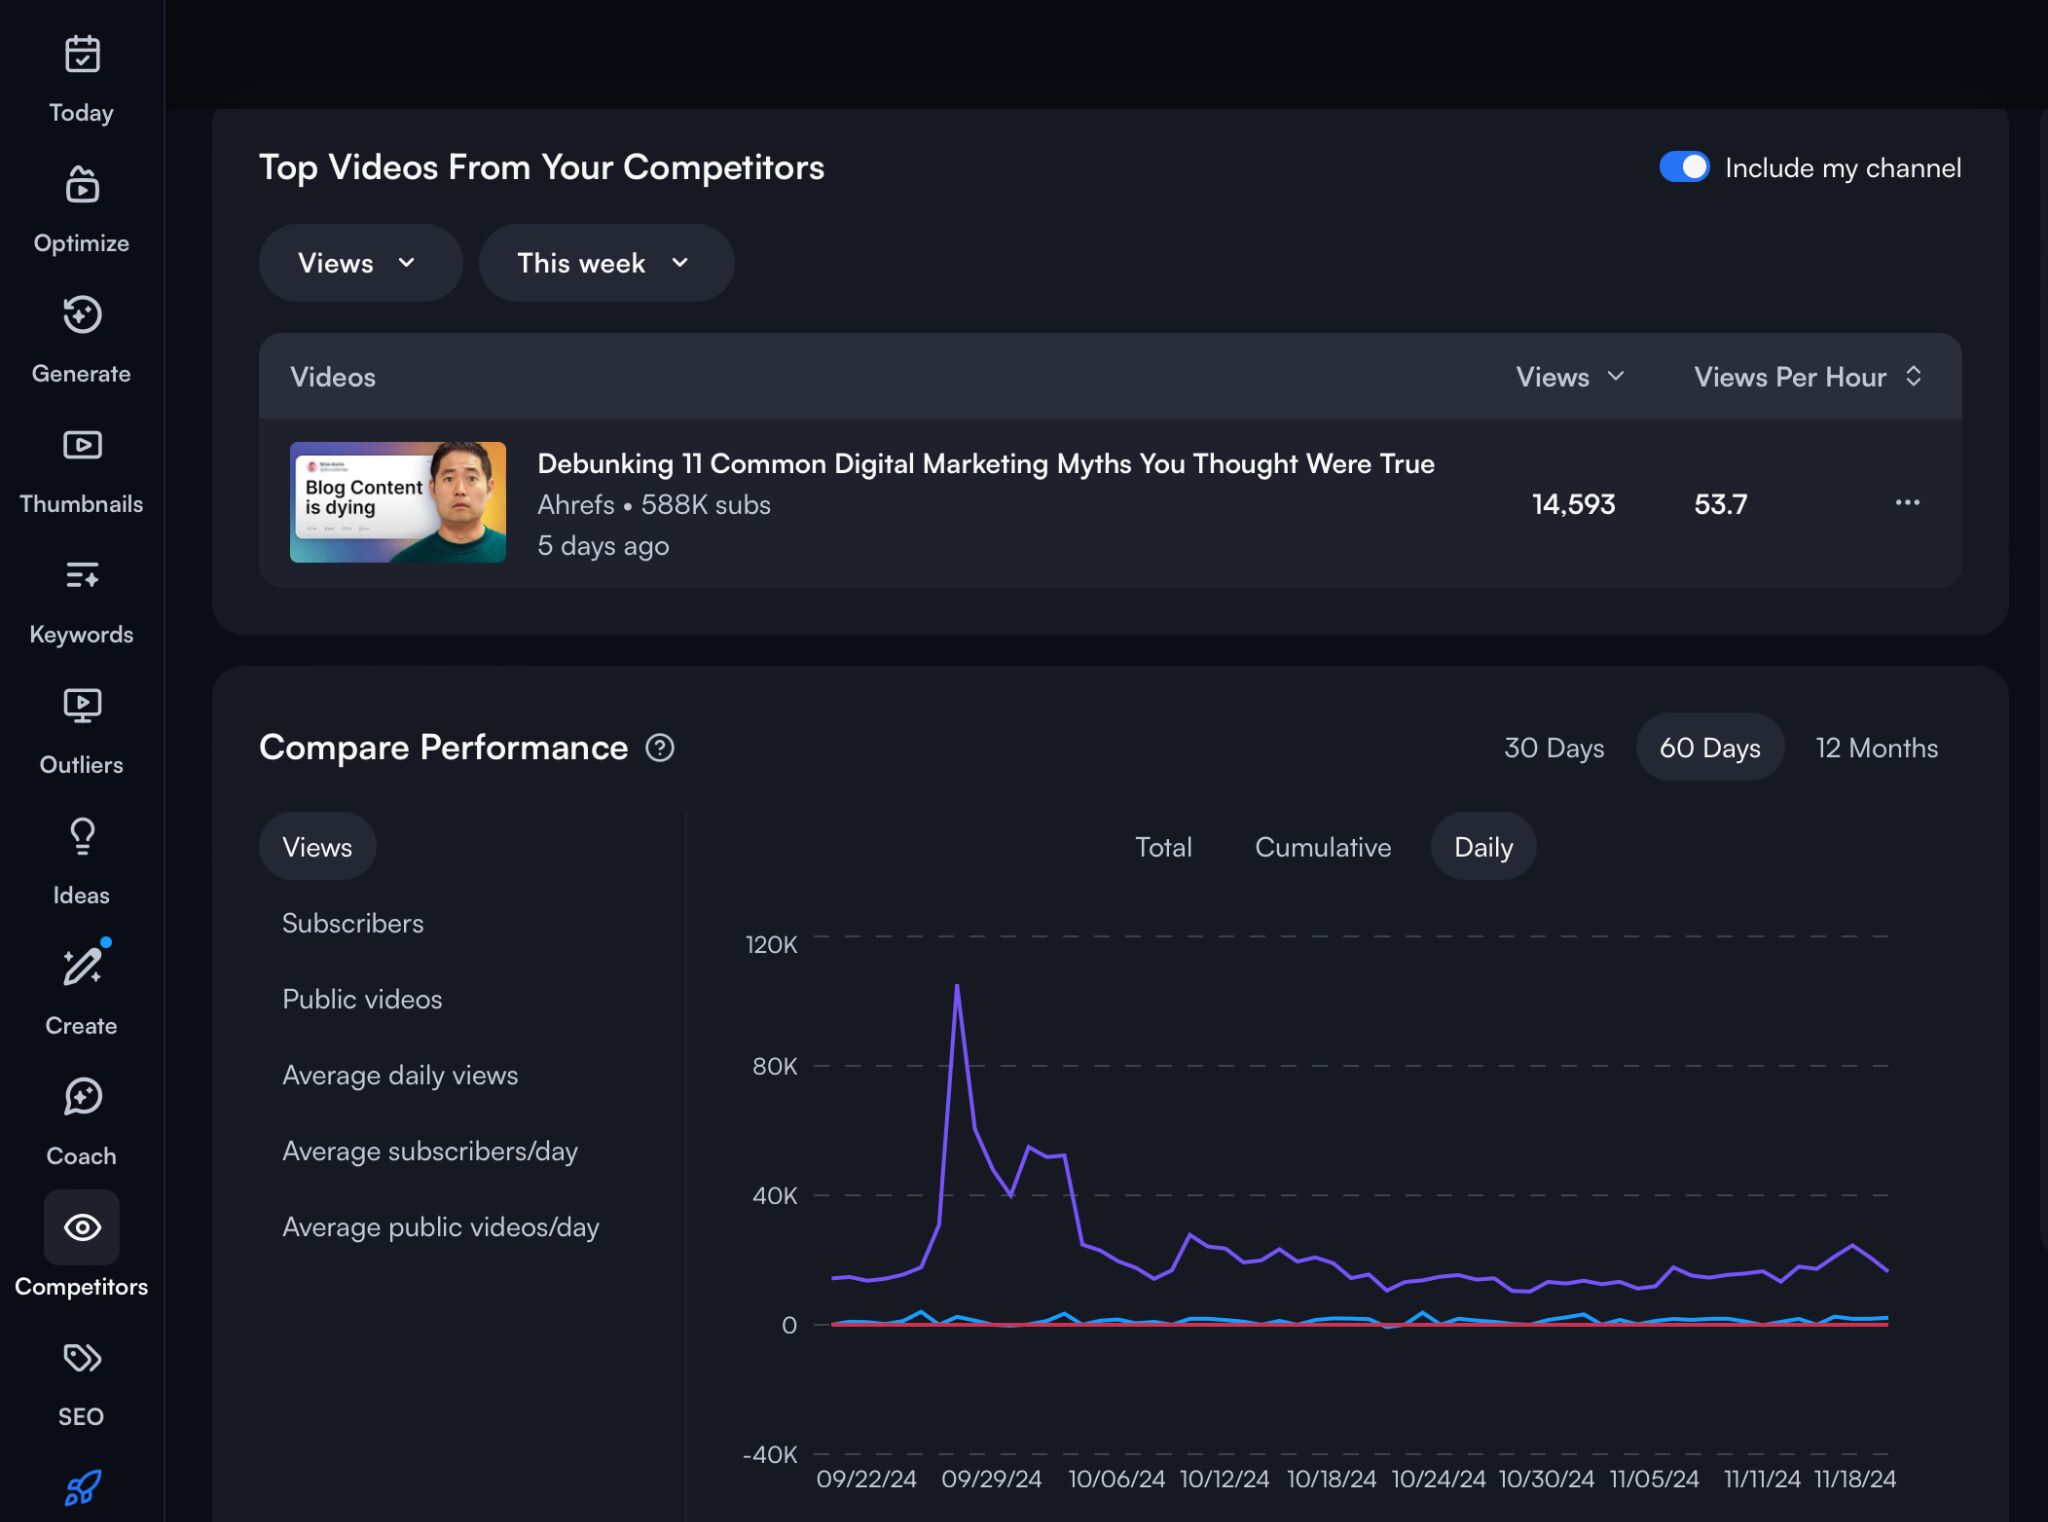
VidIQ is a tool for YouTube that provides analytics and optimization features for video content creators and marketers. It helps brands grow their channel, increase views, and improve video performance.
The tool proved helpful for us for competitive analysis and gathering data for our video experiments. If you want to see what data is available beyond the native YouTube analytics, this is the tool you’d want to try out.
Key Use Cases
- Get ideas for new content based on keywords other channels target and your competitors’ top content.
- Double down on the content that works and find what’s not working for your channel with performance metrics such as subscribers gained/lost, views per hour, engagement rate, and card click rates.
Standout feature: Channel audit
This is the best place to check if you want to see what’s been working, what to fix, and what to stop doing completely in your videos.
The tool does that by ranking your videos based on eight different performance metrics, such as views per hour, engagement rate, and subscribers gained.
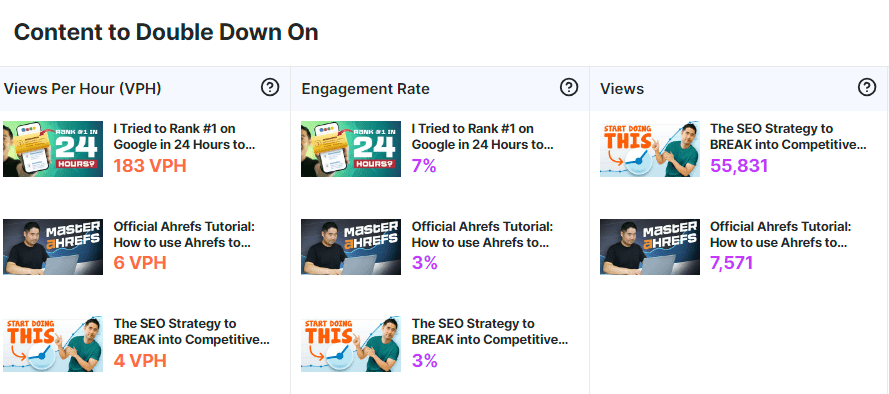
So let’s say you’ve been trying that new, experimental type of video lately, and you’re not sure your audience will still find them relevant. A good answer to that would be the “subscribers gained/lost metric”. If you’re aggressively losing subscribers on those new videos, that new content may not be working for you.
Pricing
Get started for free, premium plans start at $16.58 per month.
HubSpot
HubSpot is like a Swiss Army knife for handling marketing, sales, and support all in one spot.
While it isn’t exclusively an analytics tool, its distinctive advantage is its ability to unify these customer-centric teams, allowing them to collaborate.
HubSpot is the kind of tool you’d definitely want to check out as your customer base grows and you’re considering growing your sales team. Keeping track of interactions, deals, and contact information in spreadsheets or basic tools becomes chaotic fast.
Key use cases
- Bring multiple marketing operations (e.g., lead generation, email marketing) under one roof for easier management and seamless data.
- Create dashboards to connect the dots between different marketing channels and campaigns.
Standout feature: Dashboards
Dashboards are essential for marketers who use multiple channels, providing a quick overview of their performance. I’m sure you’ve seen a dashboard before, but here’s how they look in Hubspot.
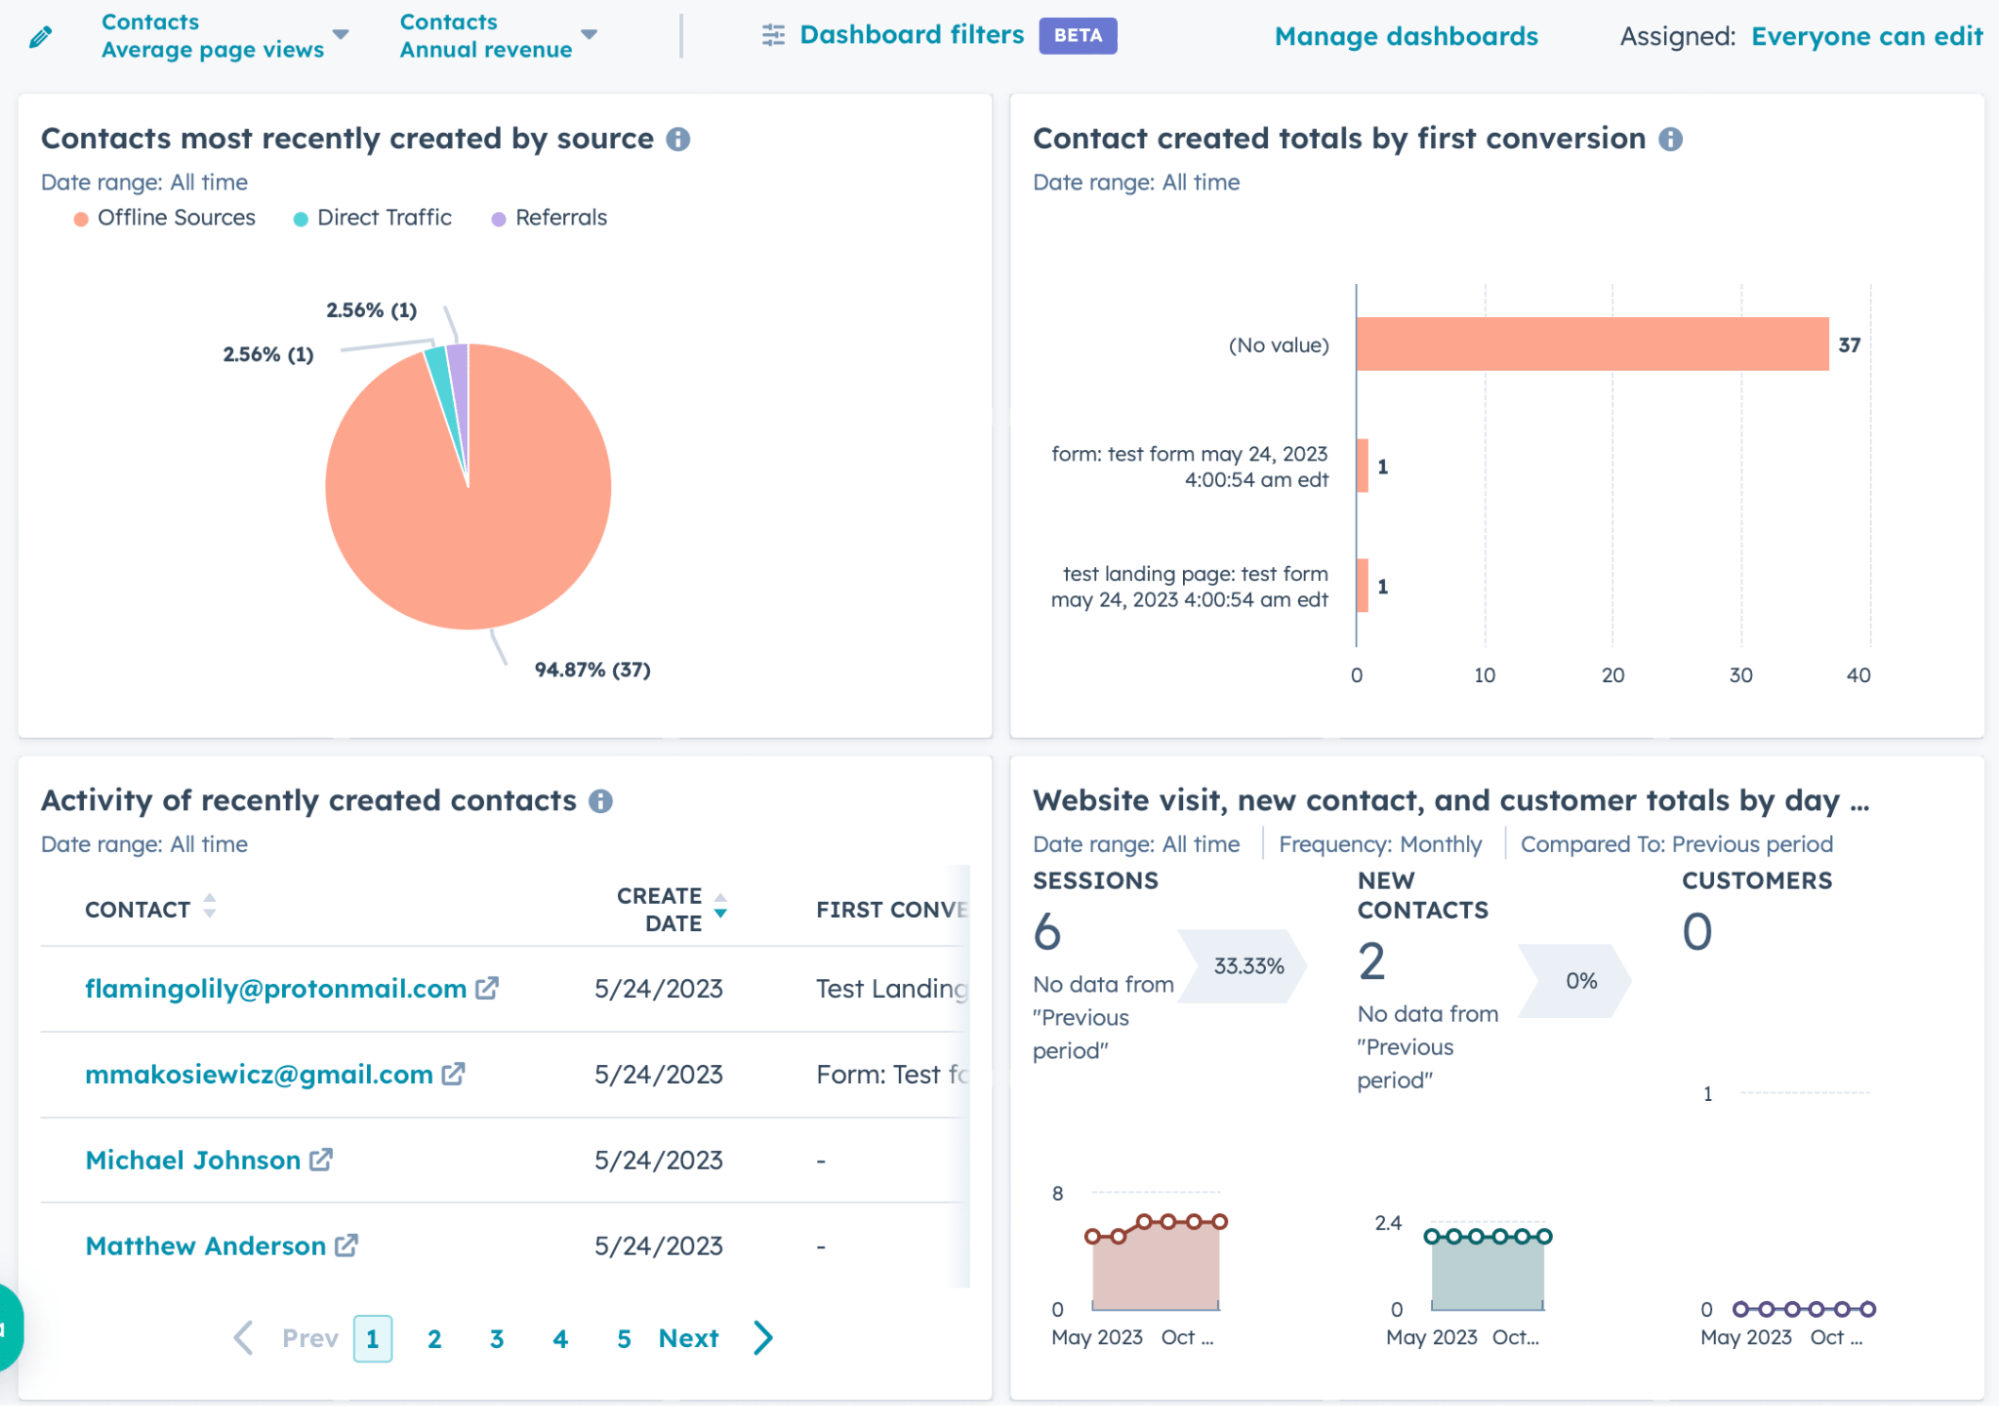
For example, you can easily create a quarterly performance dashboard that combines KPIs for your blog, email campaigns, and lead generation.
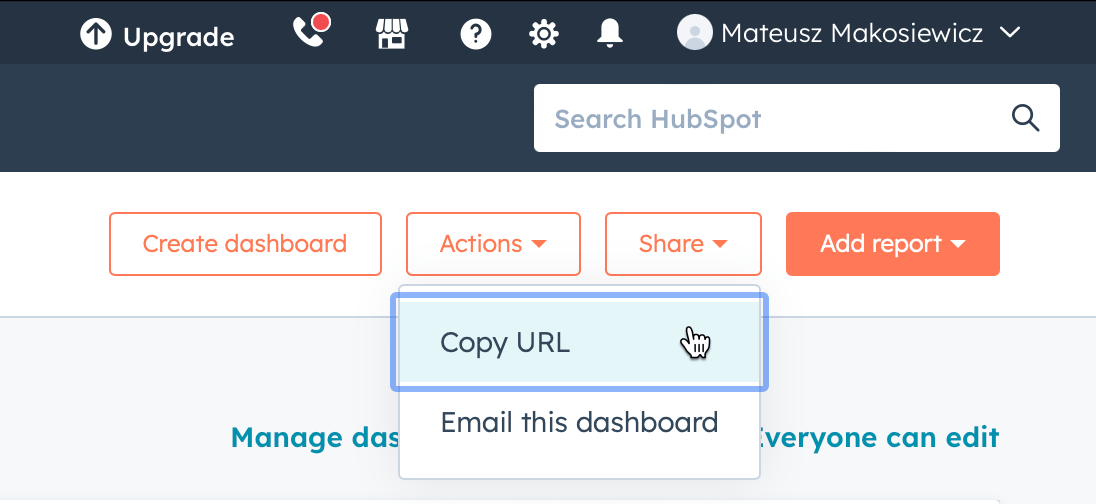
Marketing teams will enjoy this feature’s collaboration feature. Any team member can create their own dashboards and send a link to them or email them instead of taking dozens of screenshots.
Another noteworthy aspect of HubSpot is its ongoing experimentation with AI, which has led to the introduction of several promising features. While these features are still in beta, automated lead enrichment and intent analysis show significant potential for enhancing productivity and decision-making.
Pricing
HubSpot offers quite a generous free plan (you can even play with their AI copilot), premium plans start at $20 per month. See full pricing.
Runner ups
If you’re looking for a more affordable email marketing and automation solution at scale, and the rest of HubSpot’s functionality is an overkill for you, consider Brevo.
ChatGPT
Obviously, ChatGPT is very different from all other tools on the list. It doesn’t collect any data from your site or products, and it doesn’t create nice visual reports you can access anytime.
However, there are different types of analysis. What we’ve covered so far are tools for descriptive analysis — the what-happened analysis.
For that to be useful, you still need to answer questions like why that happened, what you should do next, and what could happen if you take a certain action.
Could ChatGPT help with all that? Let’s ask it.

And it said:
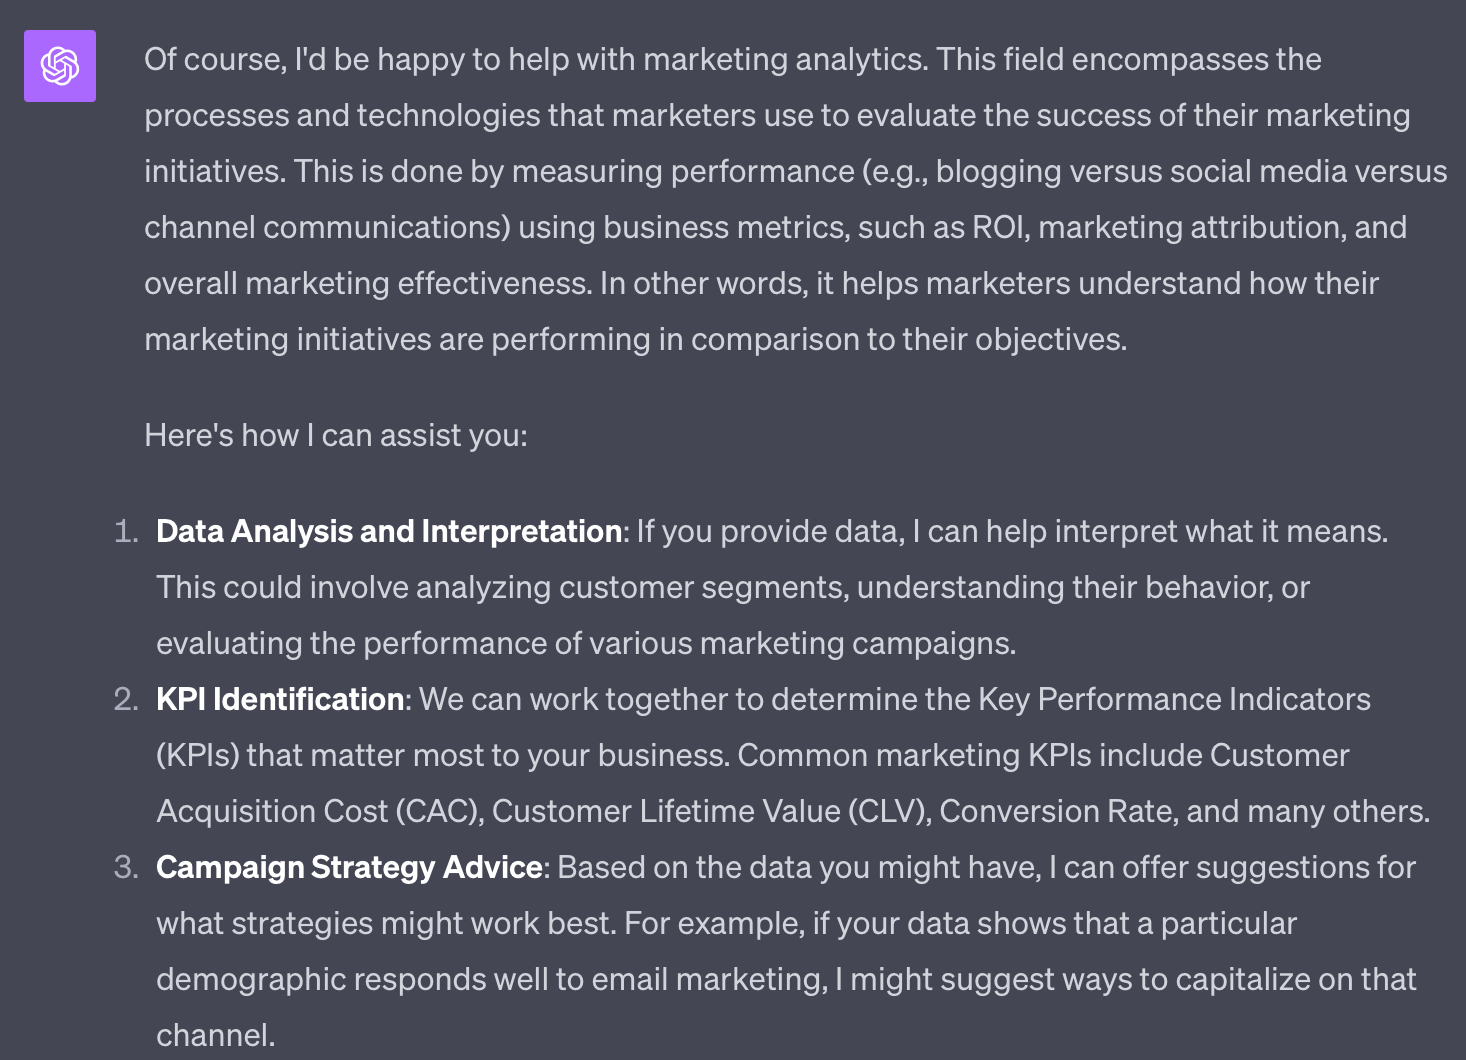
So it looks like ChatGPT is quite confident about its skills. All in all, I got 10 surprisingly convincing use cases. Here are some interesting ones.
- I can provide explanations and guidance on various analytics.
- I can guide you on setting up reports that make sense for your business.
- We can discuss how you might use predictive analytics in your marketing efforts, using historical data to predict future outcomes.
- By analyzing customer data, you can gain insights into customer behavior, preferences, and trends that can drive marketing strategy.
Standout feature: Understanding data and looking for solutions
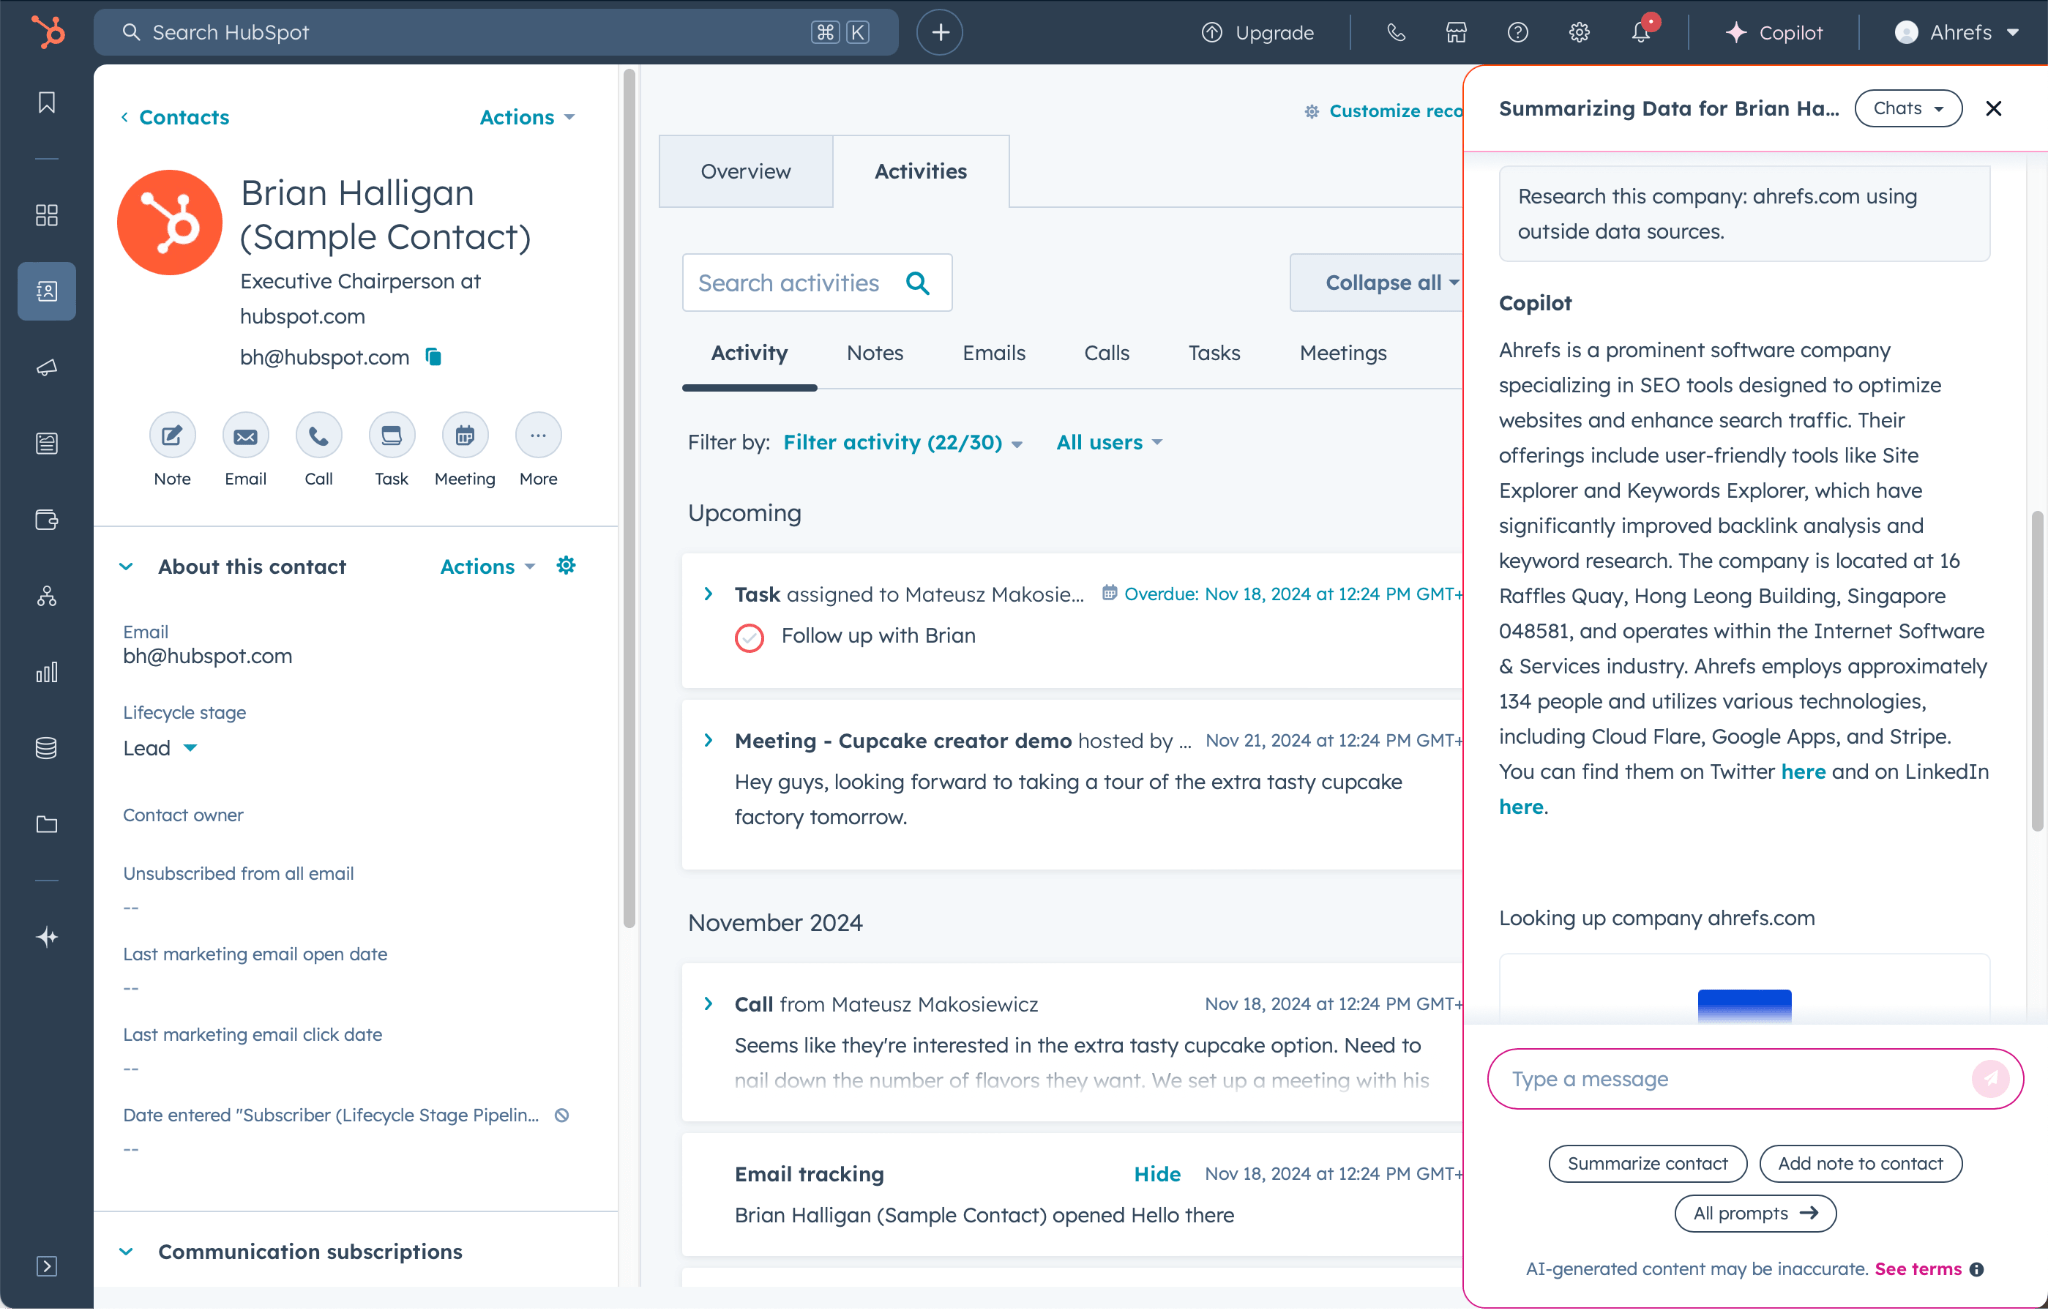
Let’s give ChatGPT a specific problem and see what it spits back. Now that the tool supports image-based prompts, this should be quite interesting.
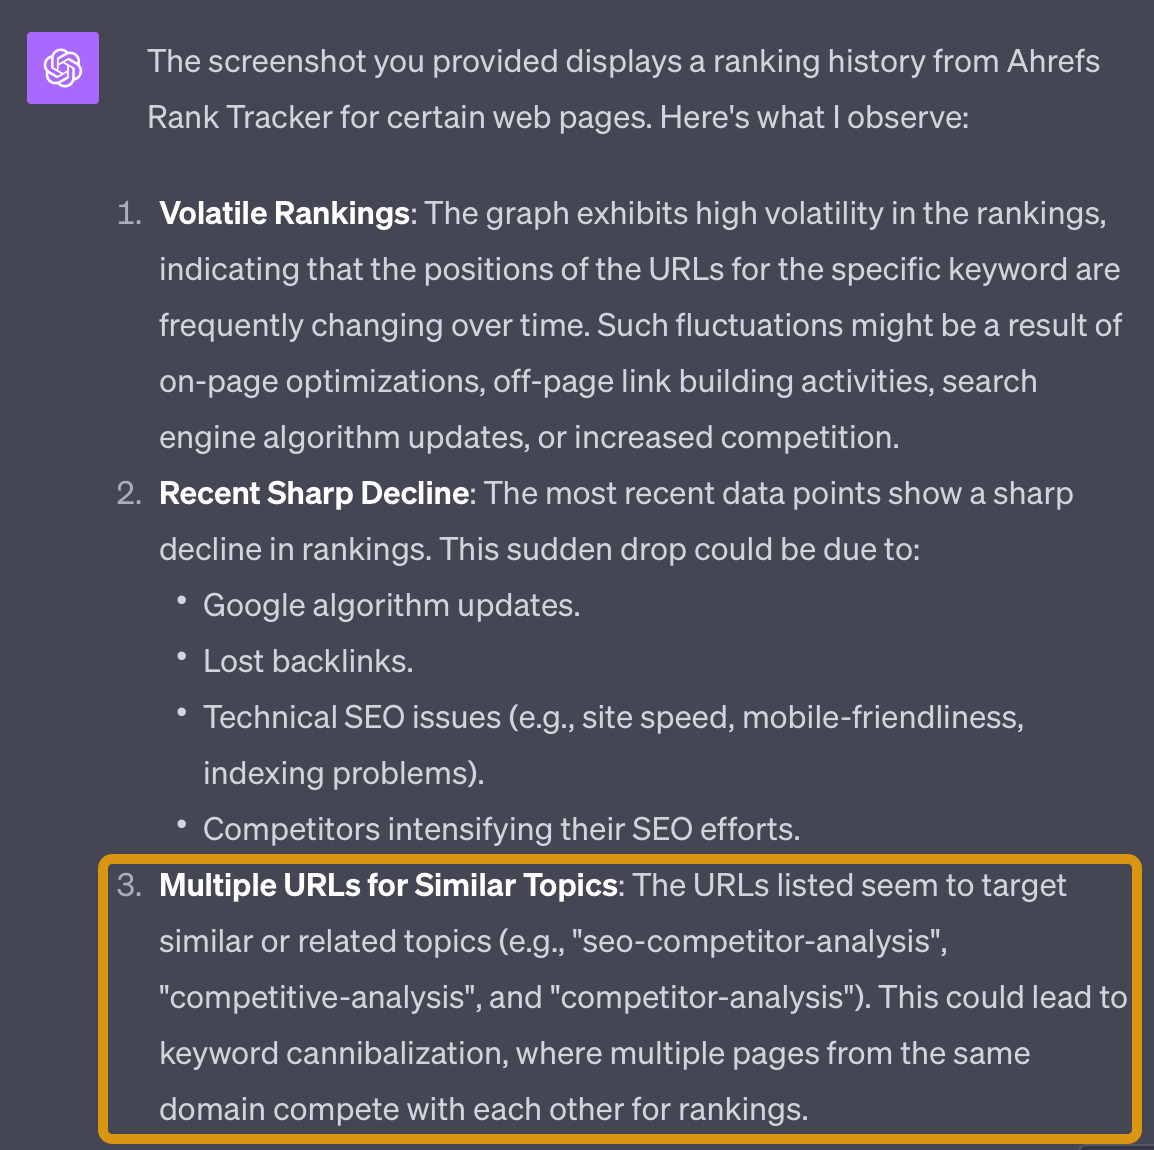
So here’s my question; it’s based on an SEO problem I was actually working on. To make things harder for AI, I have given absolutely no thought to the prompt, pretending to be a total beginner in both ChatGPT and my analytics tool (Ahrefs).
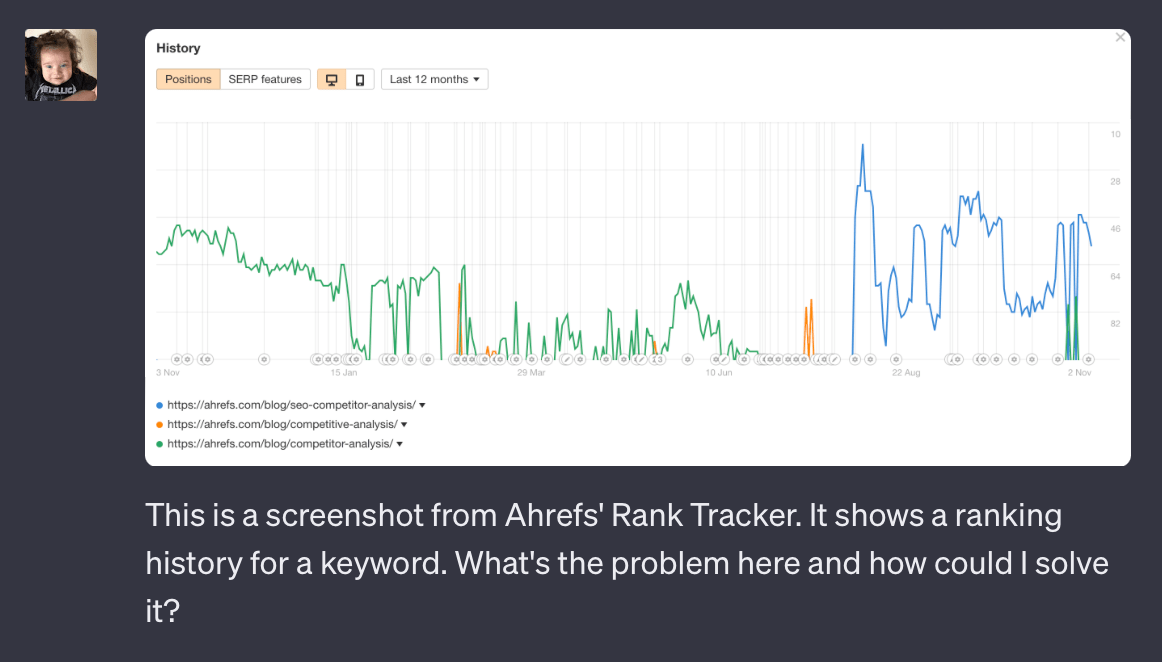
And here’s the answer. I have to admit, I was blown away. That highlighted part is a correct analysis of the problem and exactly the thing I was trying to fix.
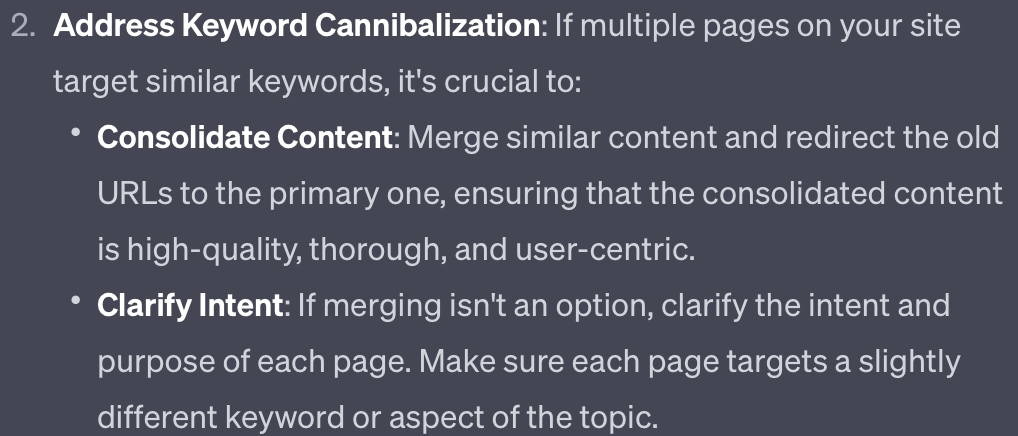
I also got a decent hint on how to solve it:
So there you have it. If your analytics tools give you data you’re not sure what to do about, ask ChatGPT. At the very least, it will provide a good starting point.
Pricing
ChatGPT Plus plan costs $20 a month, As of November 2024, the most powerful model, gpt-4, costs $0.03 per 1,000 tokens for prompt tokens and $0.06 per 1,000 tokens for completion tokens. You’d need the API to use the tool’s functionality in other apps, for example, crunch data in Google Docs.
Free plan available.
Runner ups
Since the first version of this roundup, I’ve tested a few other big LLMs. I had very good results with writing and data analysis jobs with Claude. If you’re ok with the fact that Claude doesn’t support live web search (like ChatGPT does now), give it a try as well.
Final thoughts
The more you rely on a specific channel — like organic search, social media, or ads — and the more your team needs access to the data, the more advanced your tools should be. It’s all about finding the right balance between your investment, your team’s needs, and the capabilities of the tool you choose.
Got questions or comments? Find me on LinkedIn.