
Enter Google Analytics.
Google Analytics turns on your website’s metaphorical lights to reveal who’s visiting it, how they’re finding it, and what they’re doing there. You can then use this data to confidently put one foot in front of the other to improve your website.
In this guide, you’ll learn:
- What Google Analytics is
- Why you should use Google Analytics
- How to set up Google Analytics
- How to use Google Analytics
- How to improve your website with Google Analytics
Ahrefs Web Analytics is a simple Google Analytics alternative. Fast, privacy-friendly, and free for up to 1 million events per month per site.
Google Analytics 4 (GA4) is a web analytics tool from Google that lets you track and measure user traffic and behavior on your website for free. It’s used by an estimated 28.8 million websites, giving it an estimated 85.9% share of the web analytics market.
Here’s what it looks like:
You started your website to inform potential customers of your products or services and convert them into loyal customers. To do this effectively, you need to know where visitors come from, what they’re most interested in, and which touchpoints help turn them into customers.
Recording and analyzing your data with GA4 will help you build digital marketing strategies to attract more visitors and make more money.
Is Google Analytics free?
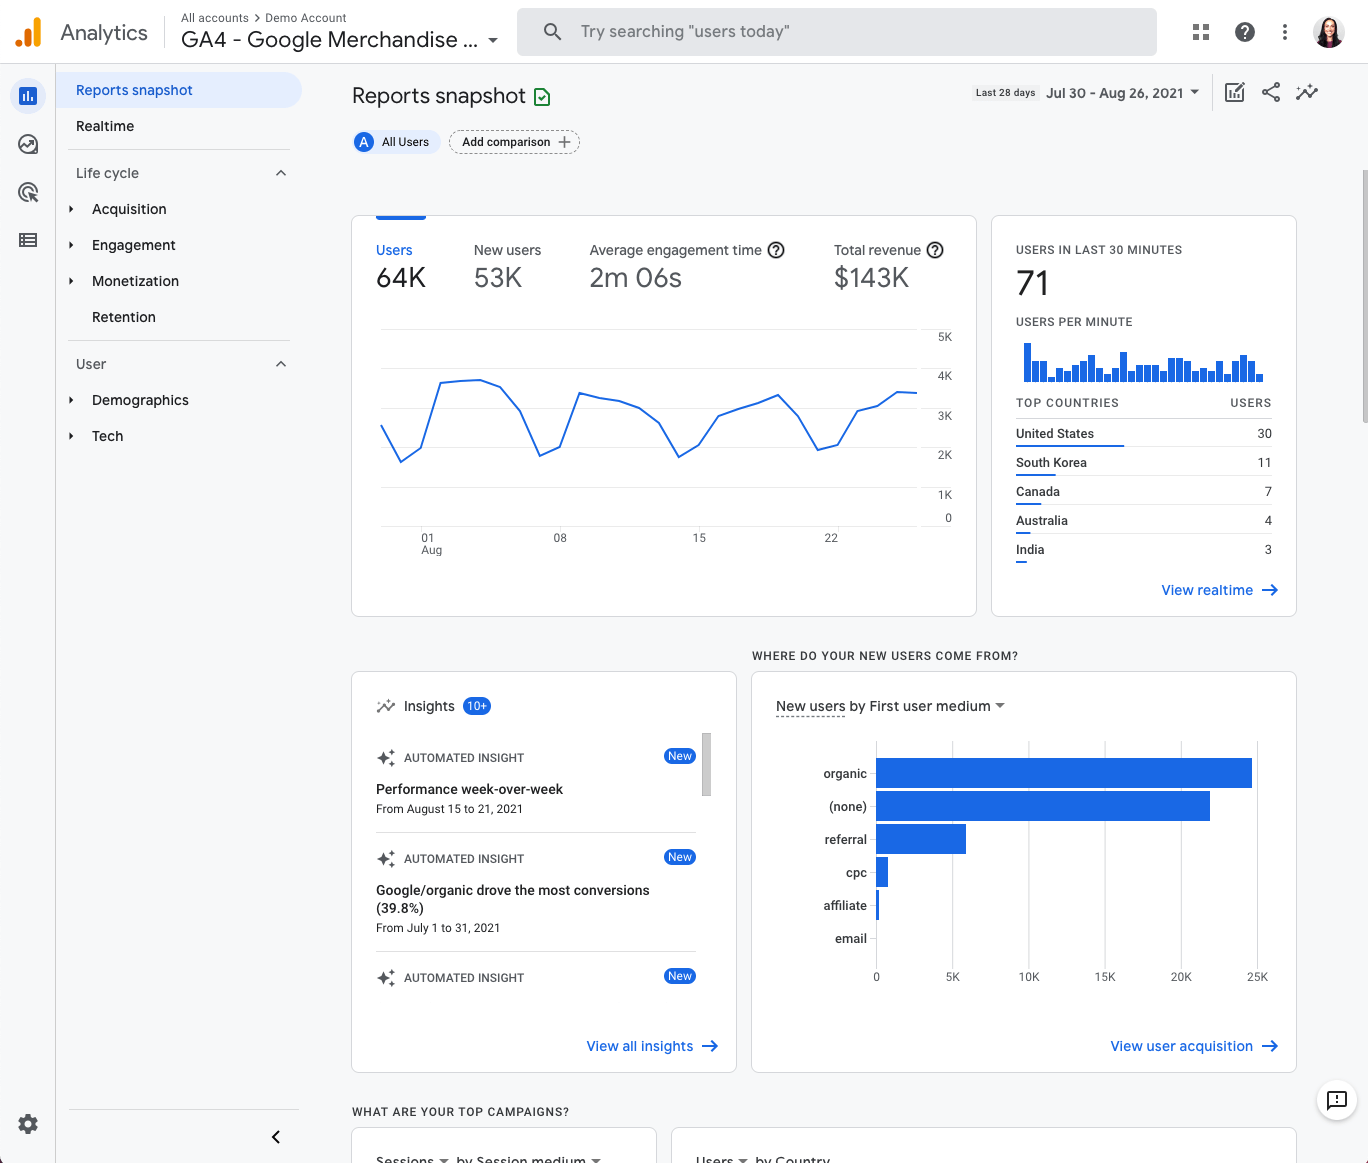
Google Analytics is completely free but does have collection and configuration limits. Most SMEs will never exceed these limits. If you’re worried, look for the green checkmark next to each report title; this confirms that you’re not looking at sampled data in the report.
Just as you can’t catch any fish without first casting your net, Google Analytics can’t collect data without being installed. So the sooner you get things set up, the better.
Follow these three steps to install and test Google Analytics:
1. Create and set up your Google Analytics account
Follow these instructions to create your account correctly:
- Go to analytics.google.com.
- Click Start measuring.
- Enter an account name (This is for internal purposes. We recommend using your company name.)
- Edit data sharing settings (optional).
- Click Next.
- Enter a property name(This is for internal use only and your website domain works well, especially if working with multiple websites under one company.)
- Check the reporting time zone and currency (This should be accurate for the business’s location).
- Click Show advanced options.
- Toggle the option to ‘Create a University Analytics property’ on (This is considered best practice to keep GA4 enhanced measures enabled.)
- Enter Website URL.
- Click Next.
- Enter industry and business size information (optional).
- Click Create.
- Accept the Google Analytics Terms of Service Agreement (Be sure to familiarize yourself with this before agreeing, as there may be specific privacy rules and regulations for your location.)
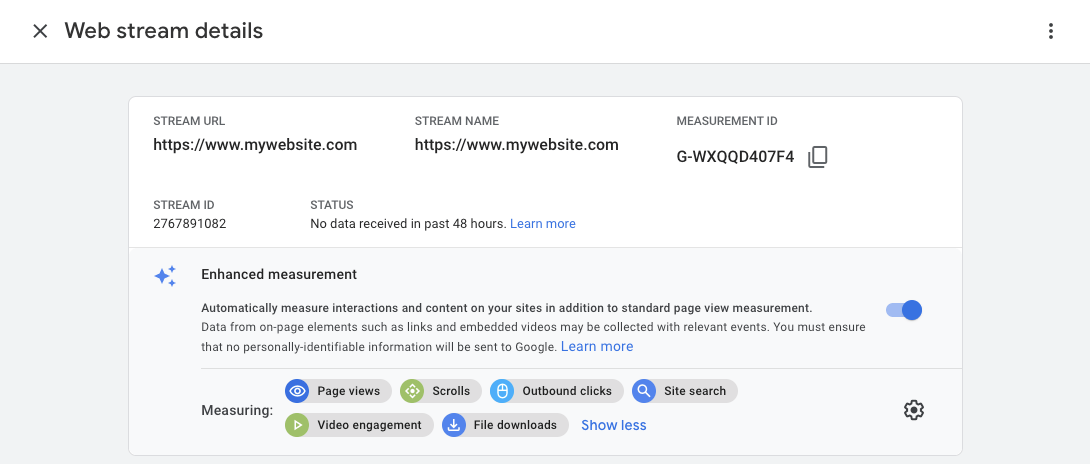
- Check web stream details (Ensure everything is correct, including things like HTTP vs. HTTPS and www vs. non-www. These may skew data accuracy.)
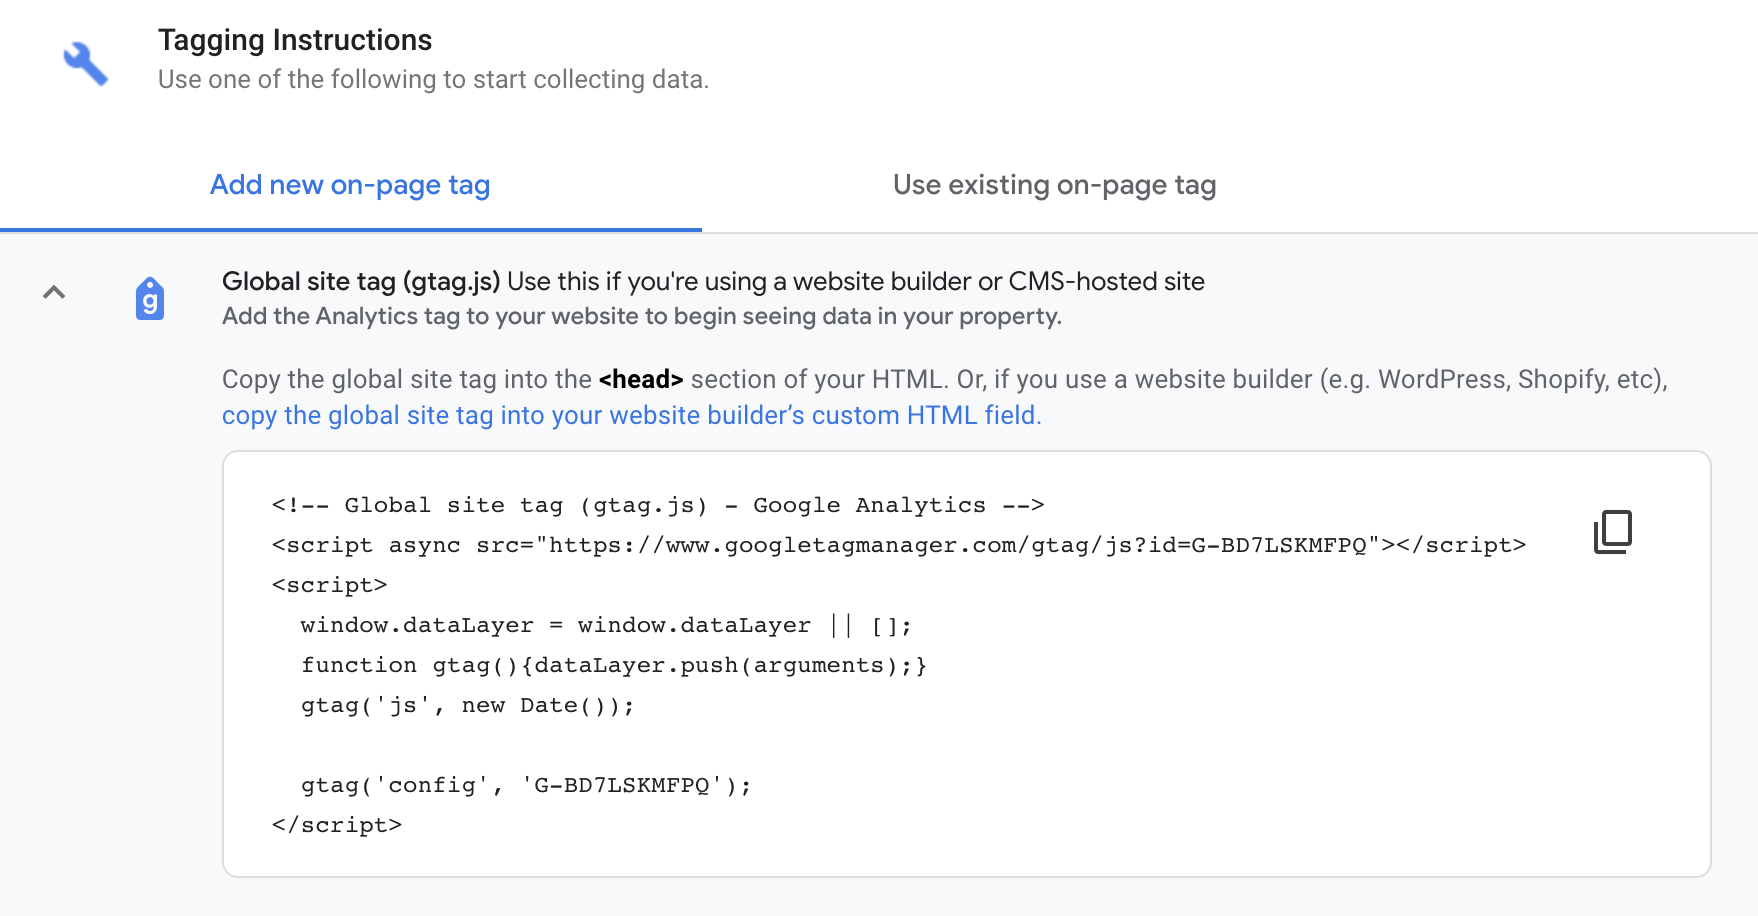
2. Add the GA tag to your website
You need to install the GA tag on your website before Google Analytics can collect any data. The simplest way to do this depends on your website setup.
If you’re using WordPress…
- Install the GA Google Analytics plugin.
- Go to the plugin settings.
- Copy your Measurement ID from Google Analytics.
- Paste the Measurement ID into the GA tracking ID box in the plugin settings.
- Select Global Side Tag from the Tracking Method options.
- Click Save Changes.
If you’re using Wix…
- Go to Marketing Integrations.
- Under Google Analytics, click Connect.
- Click Connect Google Analytics.
- Paste your Measurement ID from Google Analytics in the pop-up.
- Tick the IP Anonymization checkbox if you wish to hide visitors’ IP addresses from Google.
- Click Save.
If you’re using another CMS/platform…
Google has links to instructions for most CMS’ here. However, you’ll notice that not all platforms provide native support for the new “G-” ID in GA4. So in some cases, you’ll need to install manually by copying the full gtag.js code into the <head> section of your website.
Alternatively, you can use Google Tag Manager (GTM). GTM is a somewhat advanced option for a beginner. Still, it’s my preferred method for adding on-page tags because I usually need to add multiple marketing performance tags (Facebook, HubSpot, etc.)
If you want to learn more about Google Tag Manager, read this.
3. Test your setup
Google Analytics tracking mistakes are common, so it’s crucial to test your setup before calling it a day.
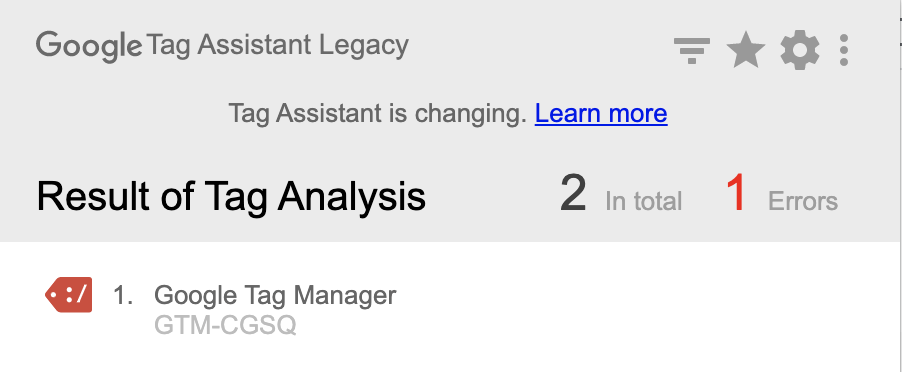
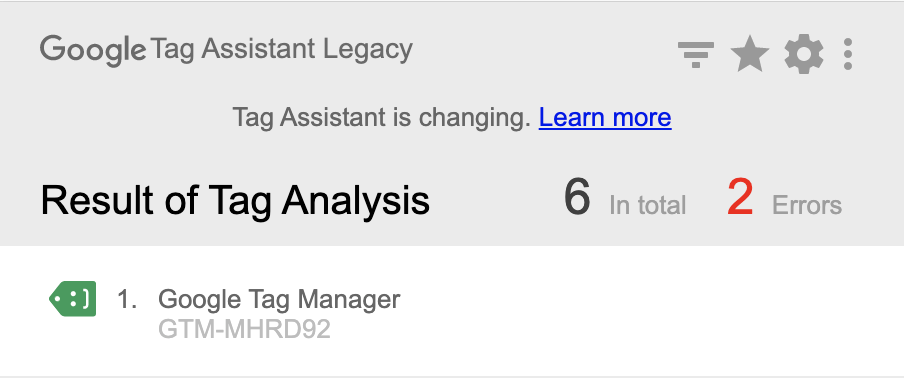
There are a few ways to do this, but the most straightforward way by far is using Google’s Tag Assistant Chrome extension. It’s a legacy product, but it still works and is still available for download.
Here’s how to test your setup with the extension:
- Install the extension.
- Open your website.
- Click on the extension’s icon in your browser bar.
- Click Enable and refresh your webpage.
An incorrectly installed tag will be sad and red:
A correctly installed tag will be happy and green:
How to set up goal tracking
Google Analytics automatically begins measuring traffic to your website and user interactions such as page scrolls, outbound clicks, site searches, video engagement, and file downloads.
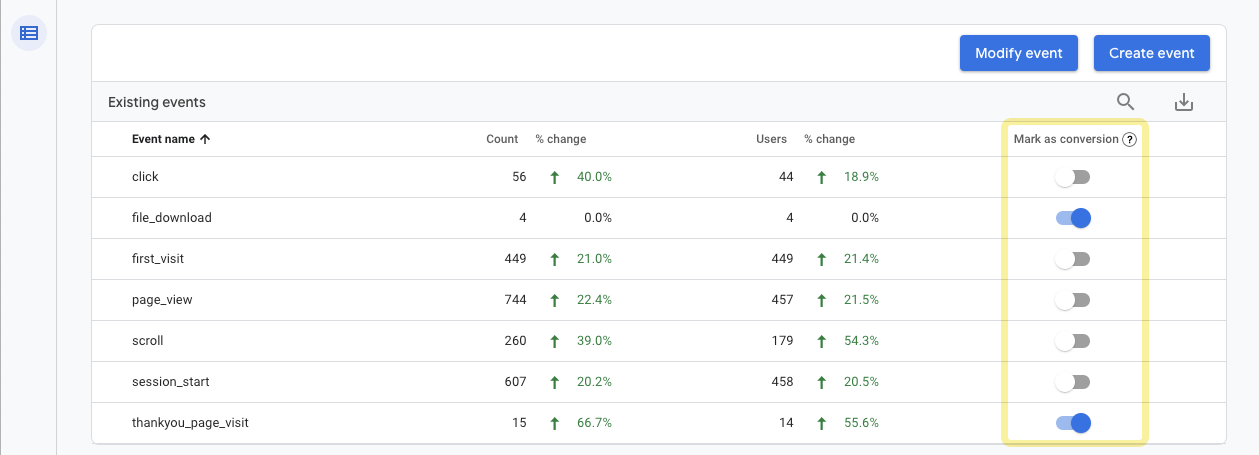
All of these auto-tracked events have the option to be marked as goals. Any additional goals, like form completions or phone calls, will need to be set up as an event using GTM.
In your GA4 property, click “configure” in the left-hand navigation (it looks like a table icon).
You simply slide the toggle named “mark as conversion” for the events you’d like to trigger conversions from this screen.
With everything correctly set up, you’re probably wondering how to use this thing. This question is a difficult one to answer because there’s no single way to use Google Analytics. It can tell you hundreds of things about your website, so the way you use it will depend on the data you need to know.
For that reason, instead of trying to explain every single report here, I’m just going to cover the basics of how you can use GA4 to understand how users get to your site, what they do there, and the multichannel journey customers take to conversion.
Acquisition
Acquisition reports tell you how users get to your site. In GA4, this is separated into two categories: User Acquisition and Traffic Acquisition.
User acquisition reports are based on user engagement, while traffic acquisition is based on session engagement. This distinction is important because one user can have multiple sessions. For this reason, we will be explaining the User acquisition report.
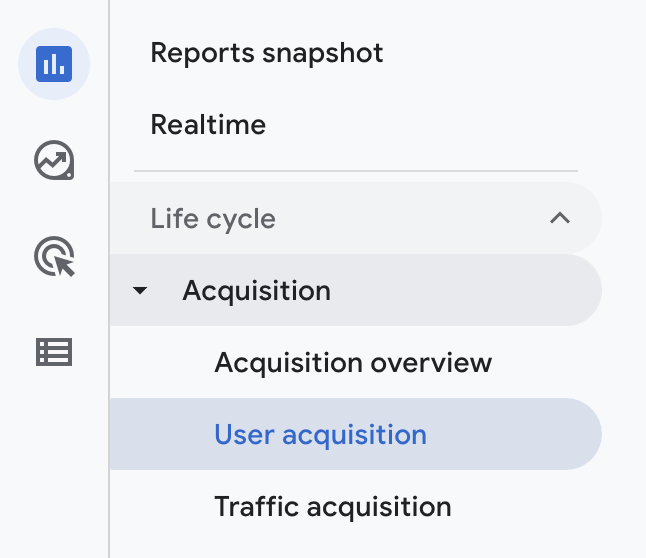
To get to the User acquisition report:
- Log in to Google Analytics.
- Click to expand Life Cycle reports.
- Click to expand Acquisition reports.
- Click User acquisition.
You can segment your report by adding a comparison for User demographics, Device, or Custom Event like a specific coupon code.
For now, let’s stick to a high-level view and keep this as “All Users”:
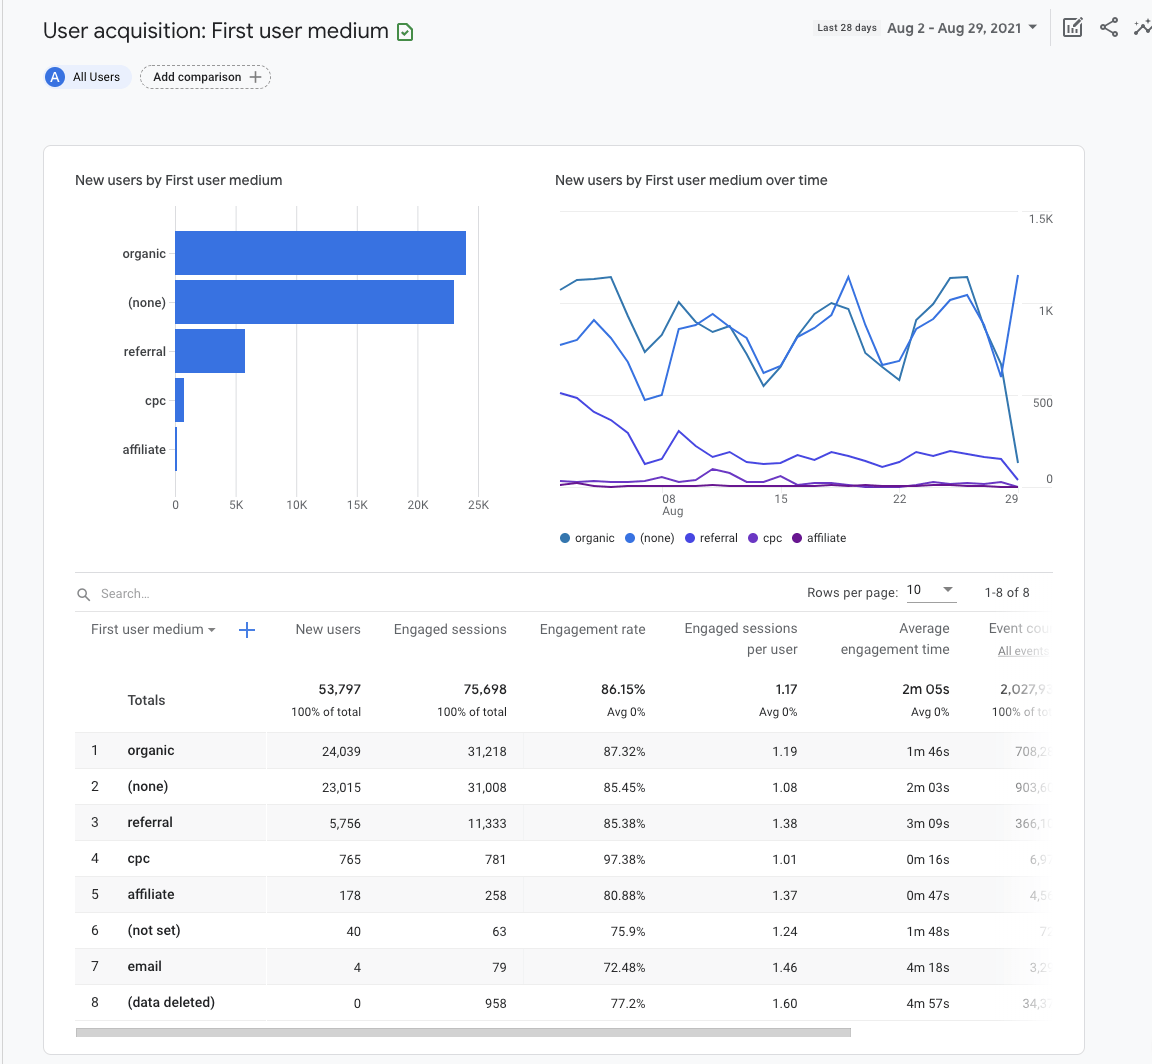
The bar graph and scatter chart will automatically populate using the metrics you set in the table below.
In the example above, we chose “First user medium” for the dimension in the first column of the table. This shows us the source by which users were first acquired. For example, “organic” combines traffic from all organic sources: Google, Bing, Yahoo, etc.
Engagement
Engagement reports tell you what users do on your site. Engagement is measured by the average length of time your site was the focus in the browser, the number of unique users who scrolled at least 90% of the webpage, event count, and conversion count.
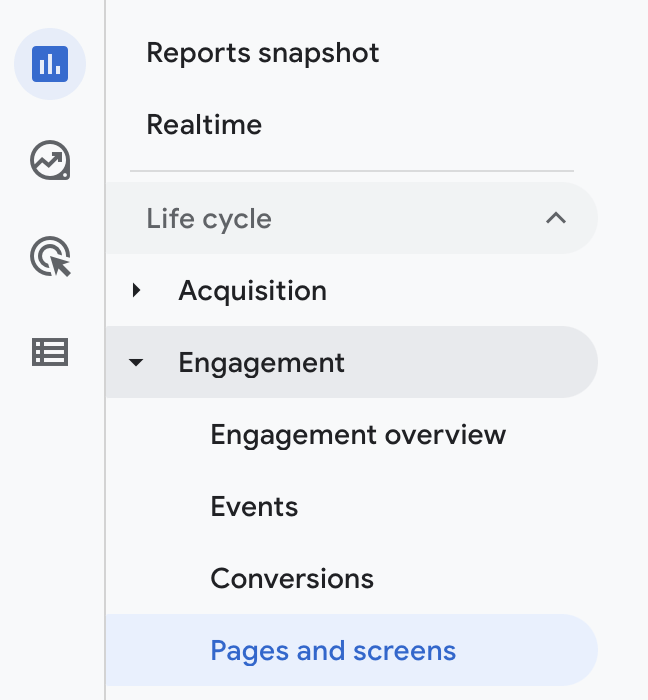
Let’s take a look at just one of the Engagement reports: Pages and screens.
To get to this report:
- Log in to Google Analytics.
- Click to expand Life Cycle reports.
- Click to expand Engagement reports.
- Click Pages and screens.
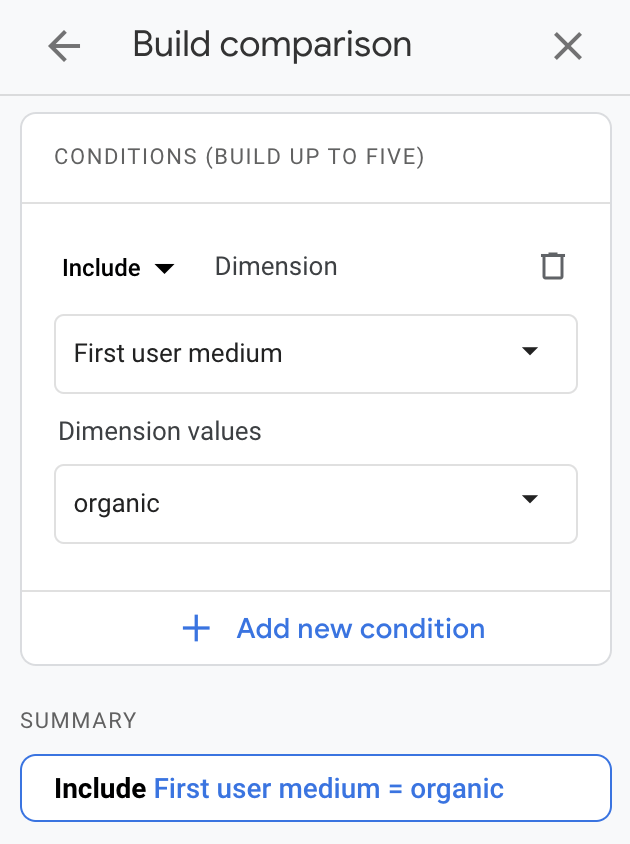
Segment your report by adding a comparison for the marketing channel you’re looking to analyze. For example, include dimension “First user medium” with a value of “organic.”
The bar graph and scatter chart will automatically populate using the metrics you set in the table below.
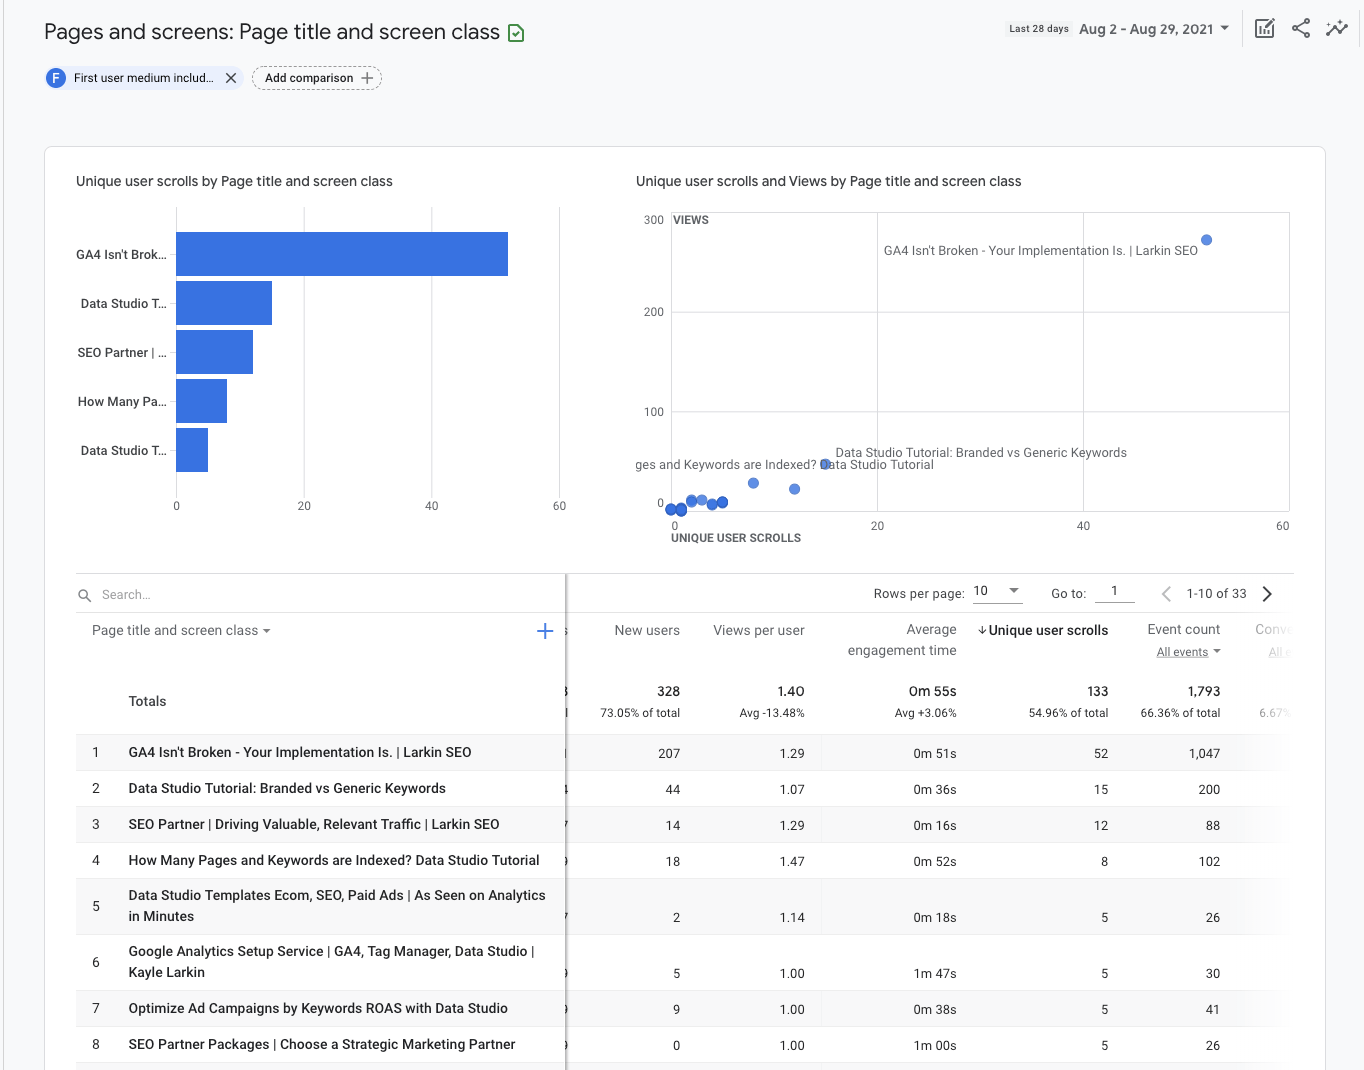
You can edit the dimension that will change the descriptive attribute or characteristic of data in column 1. For example, choosing “Page title and screen class” will show the page title, while “Page path + query string and screen class” will show the URL.
Remaining columns in the table show “metrics.” A metric is a specific element of the dimension. For example, the dimension for “Page title” can be associated with a metric like new users, unique user scrolls, event counts, and other engagement metrics.
Conversions
The conversions report tells you which user activities are contributing to the success of your business. For an ecommerce store, this might be making a purchase. For a lead generation website, it might be submitting a contact form.
In GA4, “goals” are measured as conversion events. The events data you see in your GA4 reports are triggered as users interact with your website.
To get to the Conversions report:
- Log in to Google Analytics.
- Click to expand Life Cycle reports.
- Click to expand Engagement reports.
- Click Conversions.
The bar graph and scatter chart will automatically populate using the metrics you set in the table below.
Within the table, you will find events listed by name, number of associated conversions, total users, and event revenue. Click on the name of an event to open a report about that specific event.
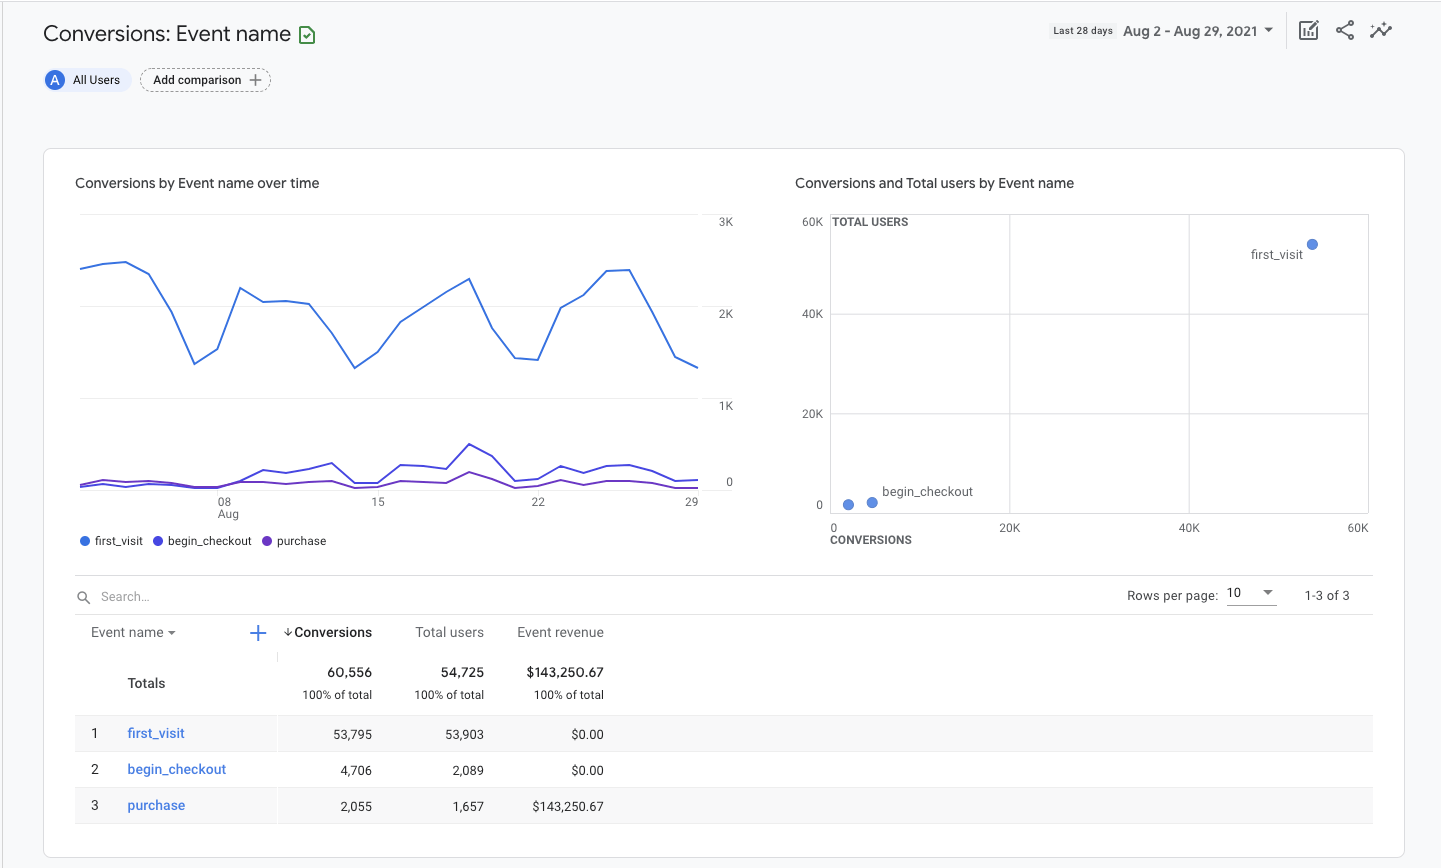
For an eCommerce store, you may want to see additional information about users that start the checkout process. To do that, click on the event name ‘begin_checkout.’
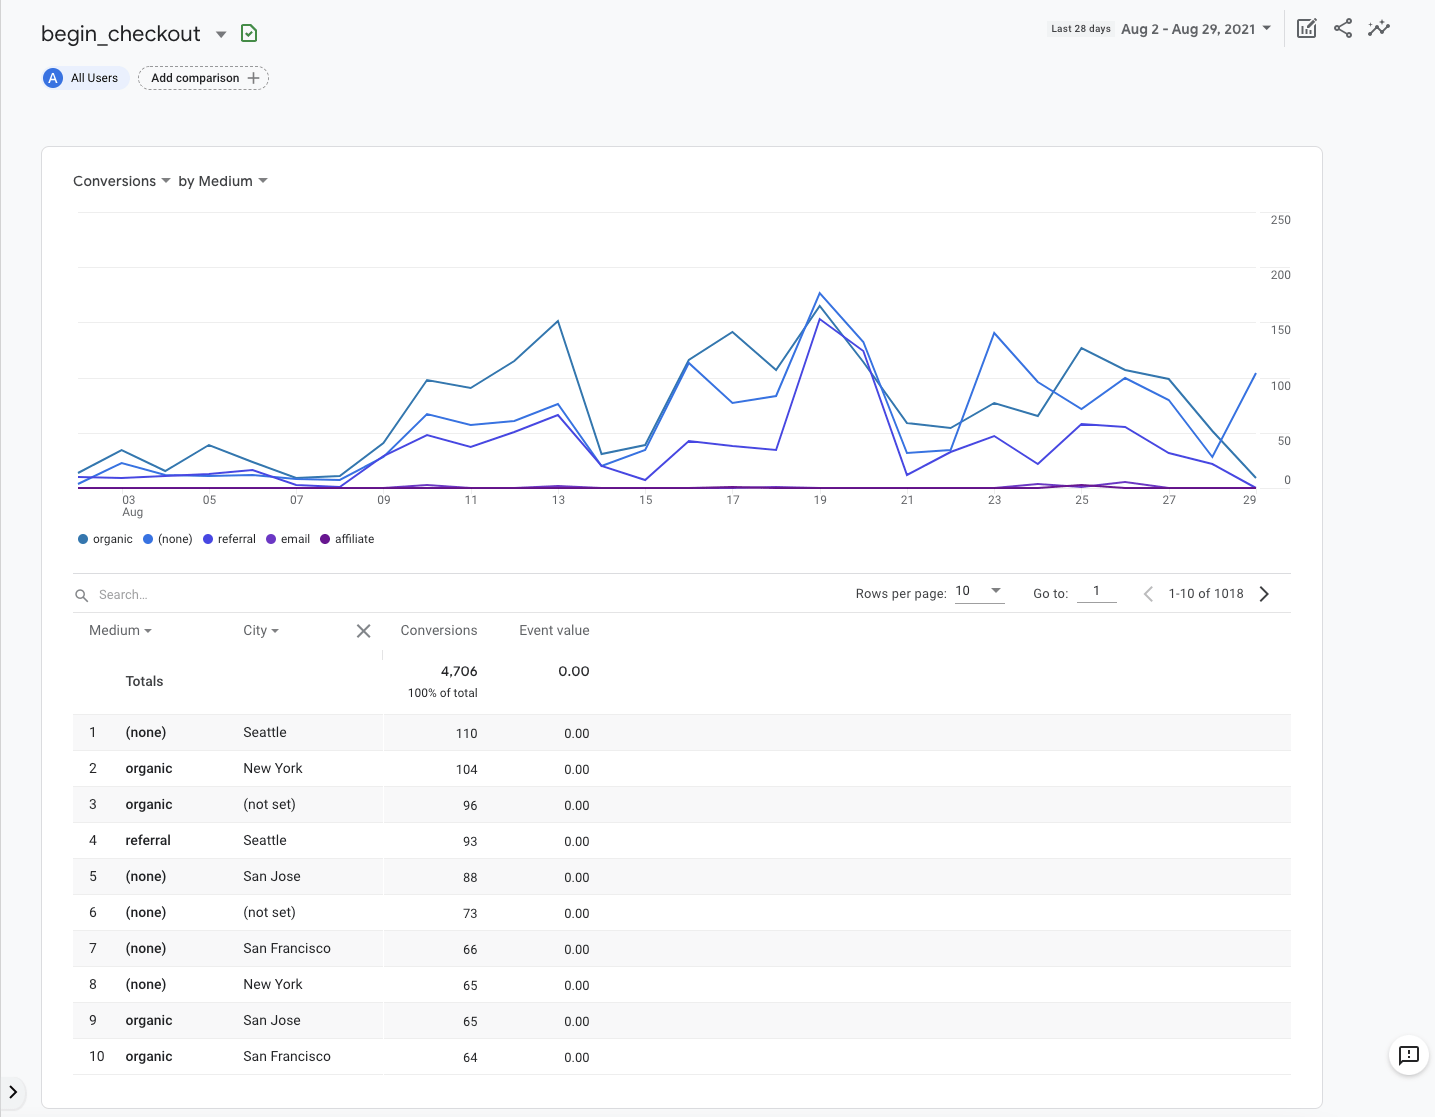
This will open a new report displaying the traffic source, number of conversions, and value for the selected event only.
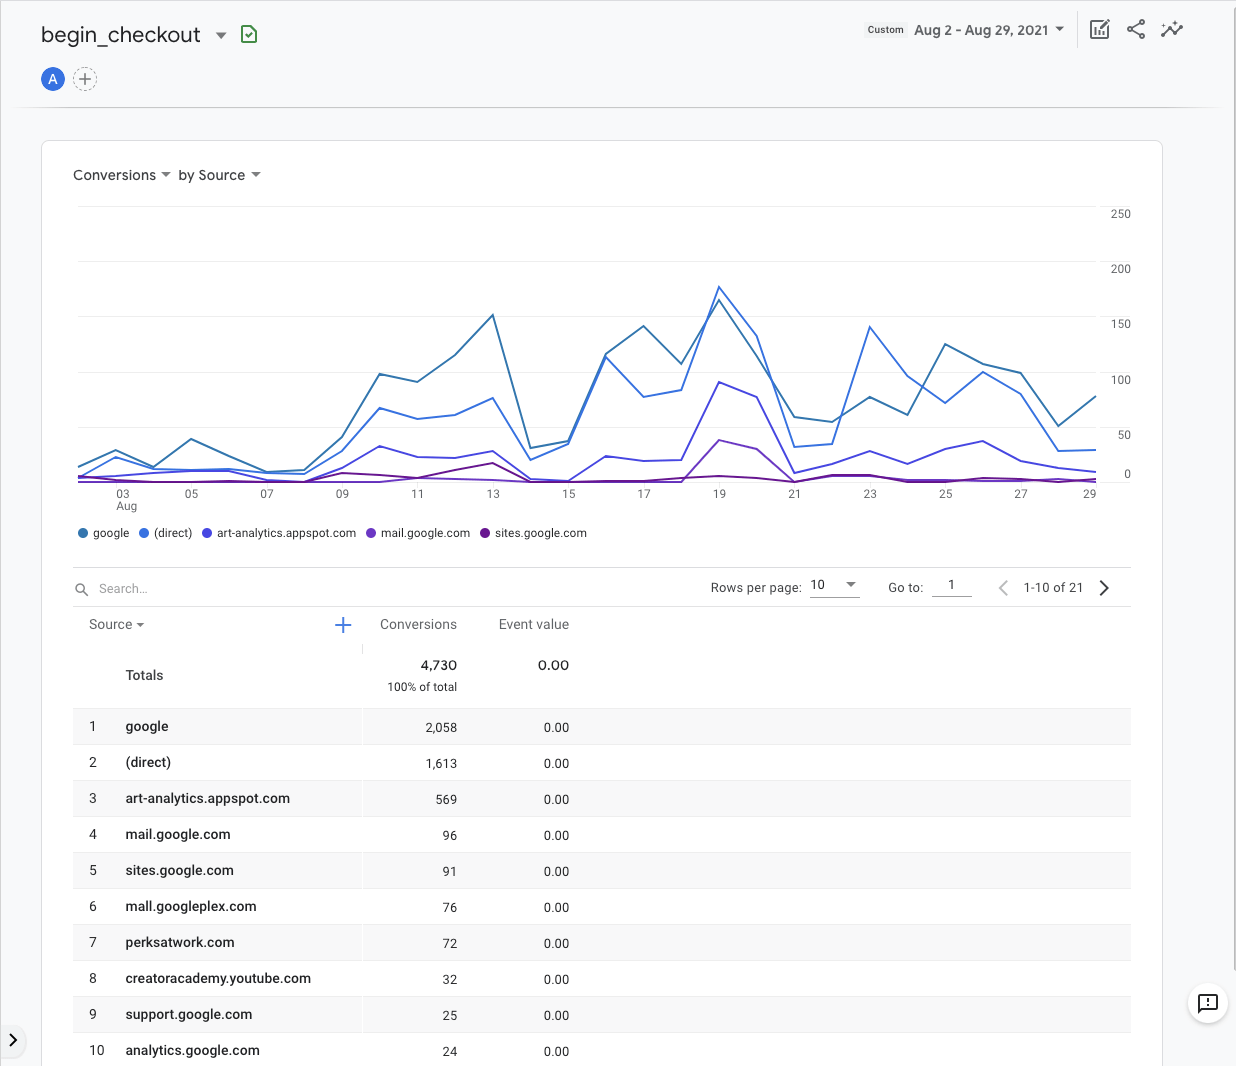
Click the dropdown menus in the upper left corner of the line chart to adjust metrics and dimensions in the report.
For example, you can choose to view the number of conversions or event value. You can also choose to see the origin of the events by Event source, Event medium, Event campaign, overtime, or by Google Ads metrics.
Add a secondary dimension, like city, to the explorer table by clicking the blue plus icon next to Column 1.
Setting up Google Analytics and understanding how to configure reports is just the beginning. The advantage of learning how to use GA4 is that you can answer marketing questions with real data.
If you just installed Google Analytics, you need to wait at least 24-48 hours to allow data to populate in reports—although I recommend waiting at least 3-4 weeks before making a decision based on reports.
Below are three simple ways you can use the data in Google Analytics to improve your website.
Improve traffic: Which channels bring in the most traffic?
At a very basic level, search engine marketing is about getting more engaged users to a site. To do this, you need to know which channels are bringing in the most traffic in the first place.
Here’s how to find your best performing marketing channels:
- Go to the User Acquisition report under Acquisition.
- Set Column 1 to First user medium.
- Click the New Users header to sort the table in descending order by traffic volume.
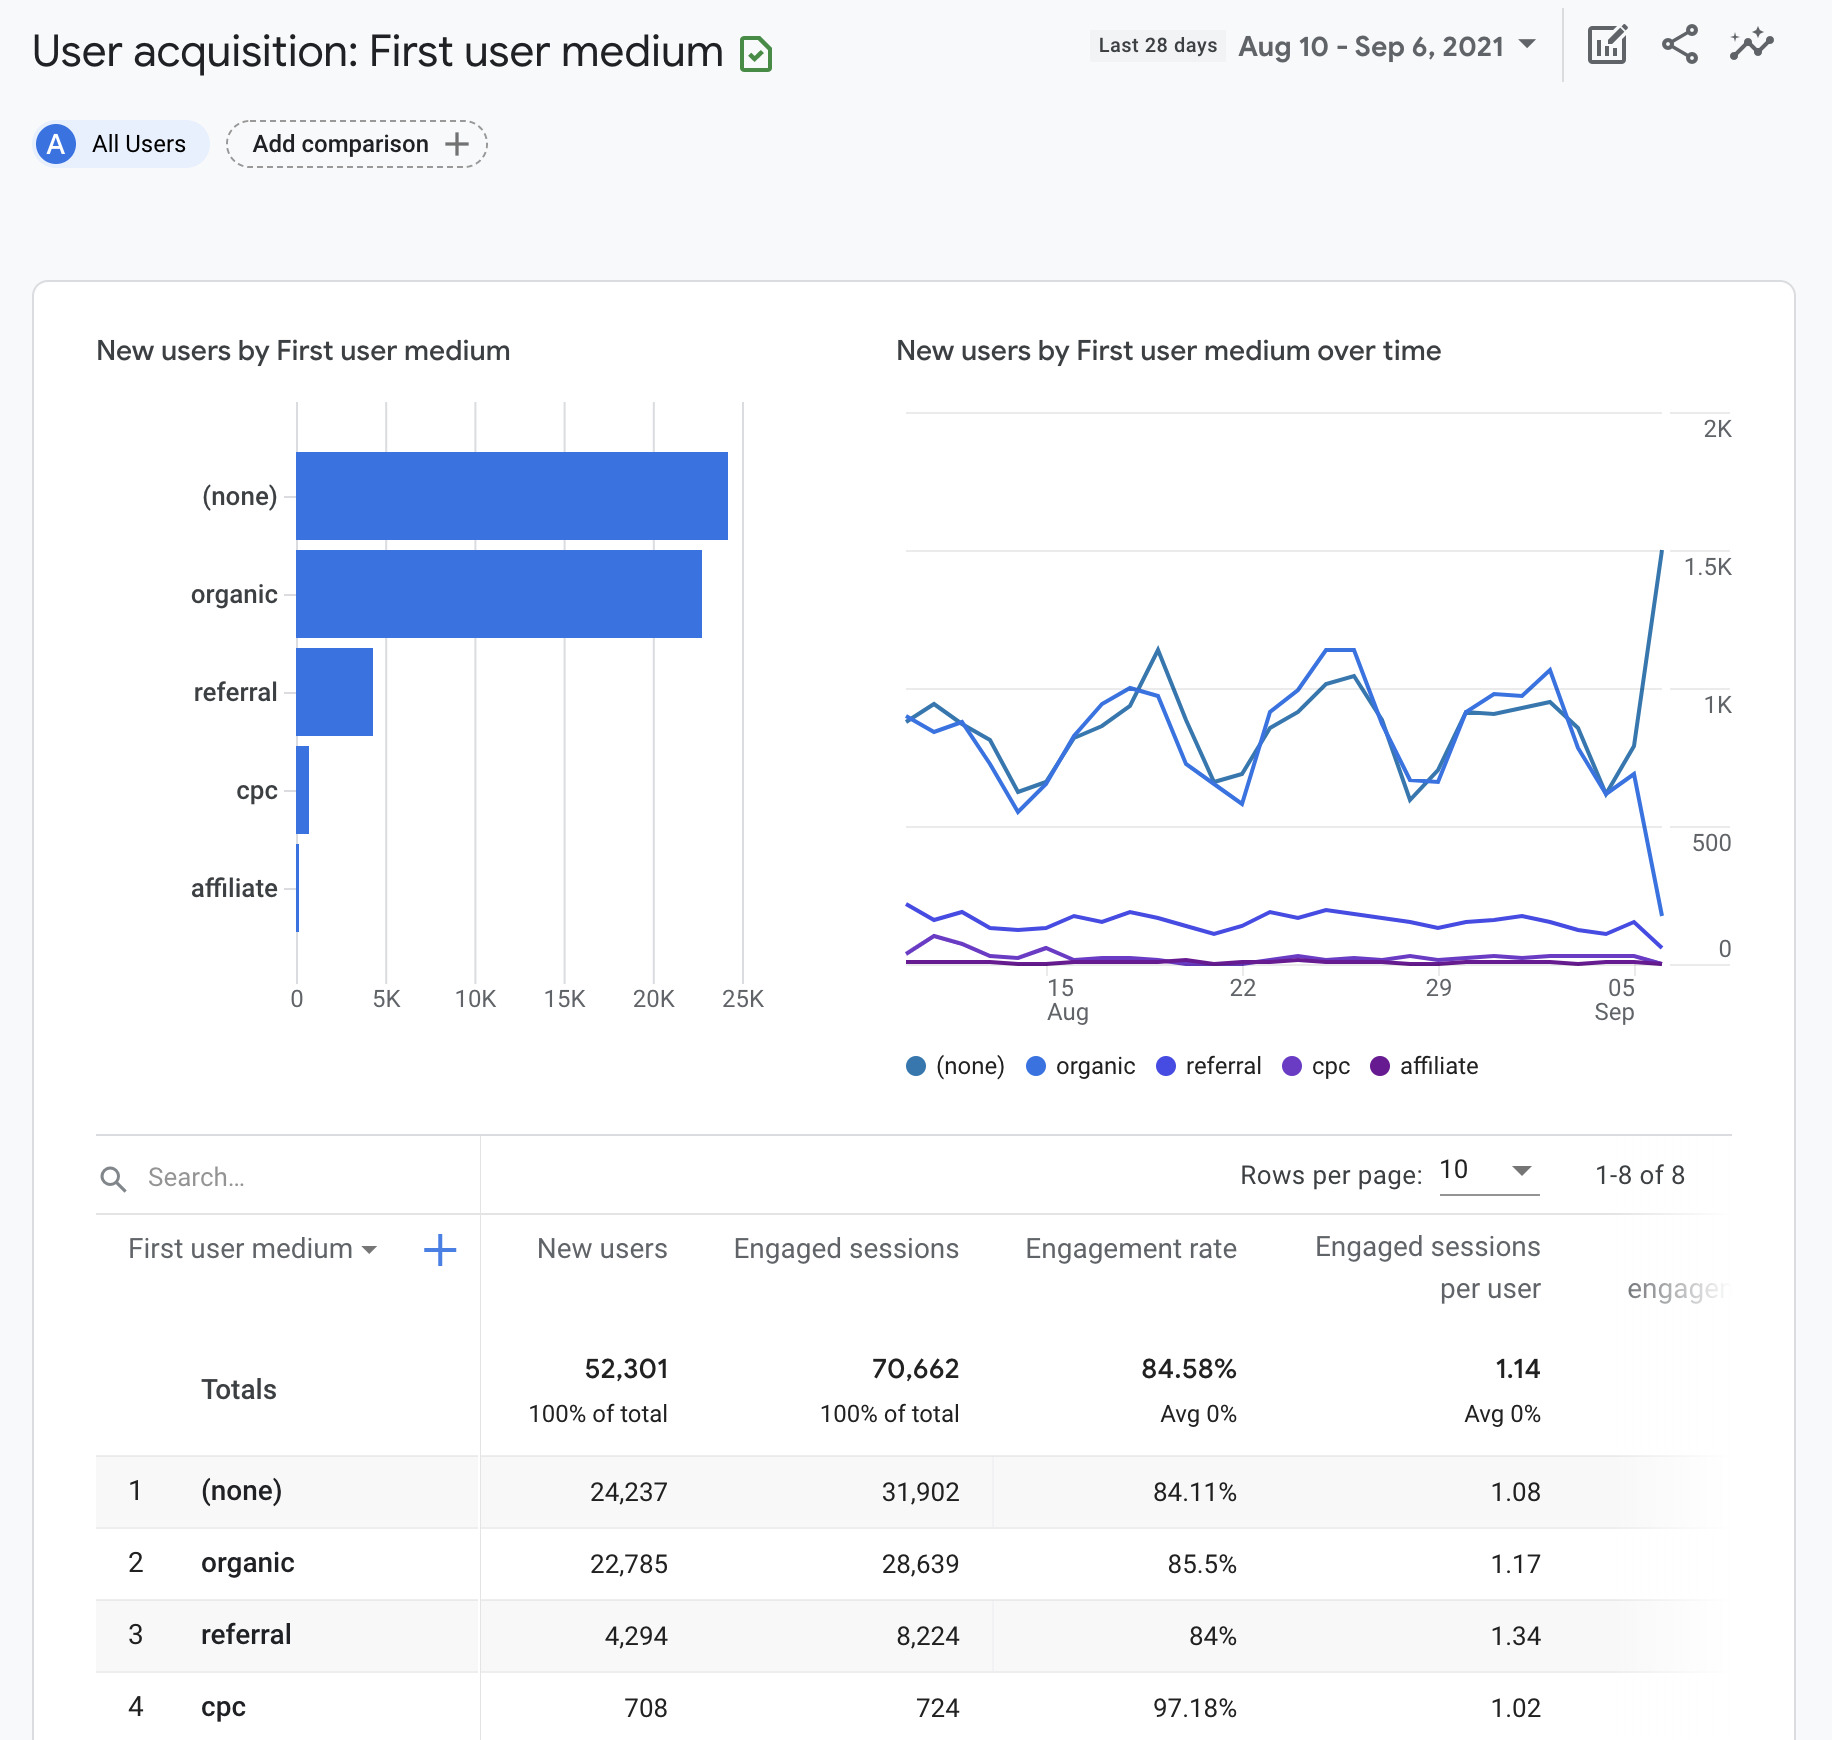
These marketing channels are bringing in the most new users (first-time visitors) to your website.
Explore other metrics in the table to further understand each marketing channel’s contribution to your website’s performance.
For example, clicking on engagement rate or average engagement time tells you which marketing efforts are winning visitors’ confidence.
Engagement rate is the percentage of sessions that interacted with your website divided by all sessions. In contrast, engagement time is the average length of time your website was in the forefront of the user’s browser window.
To measure improvement add a comparison for your benchmark date range in the top right corner.
Improve content effectiveness: Which pages bring in the most traffic?
Understanding which content brings in the most organic traffic will help you fine-tune your content marketing strategy.
Here’s how to do it:
- Go to the Pages and Screens report under Engagement.
- Click All users at the top of the screen.
- Change the dimension to First user medium.
- Select organic as the dimension value.
- Click Apply.
- Click the New Users header to sort the table in descending order by traffic volume.
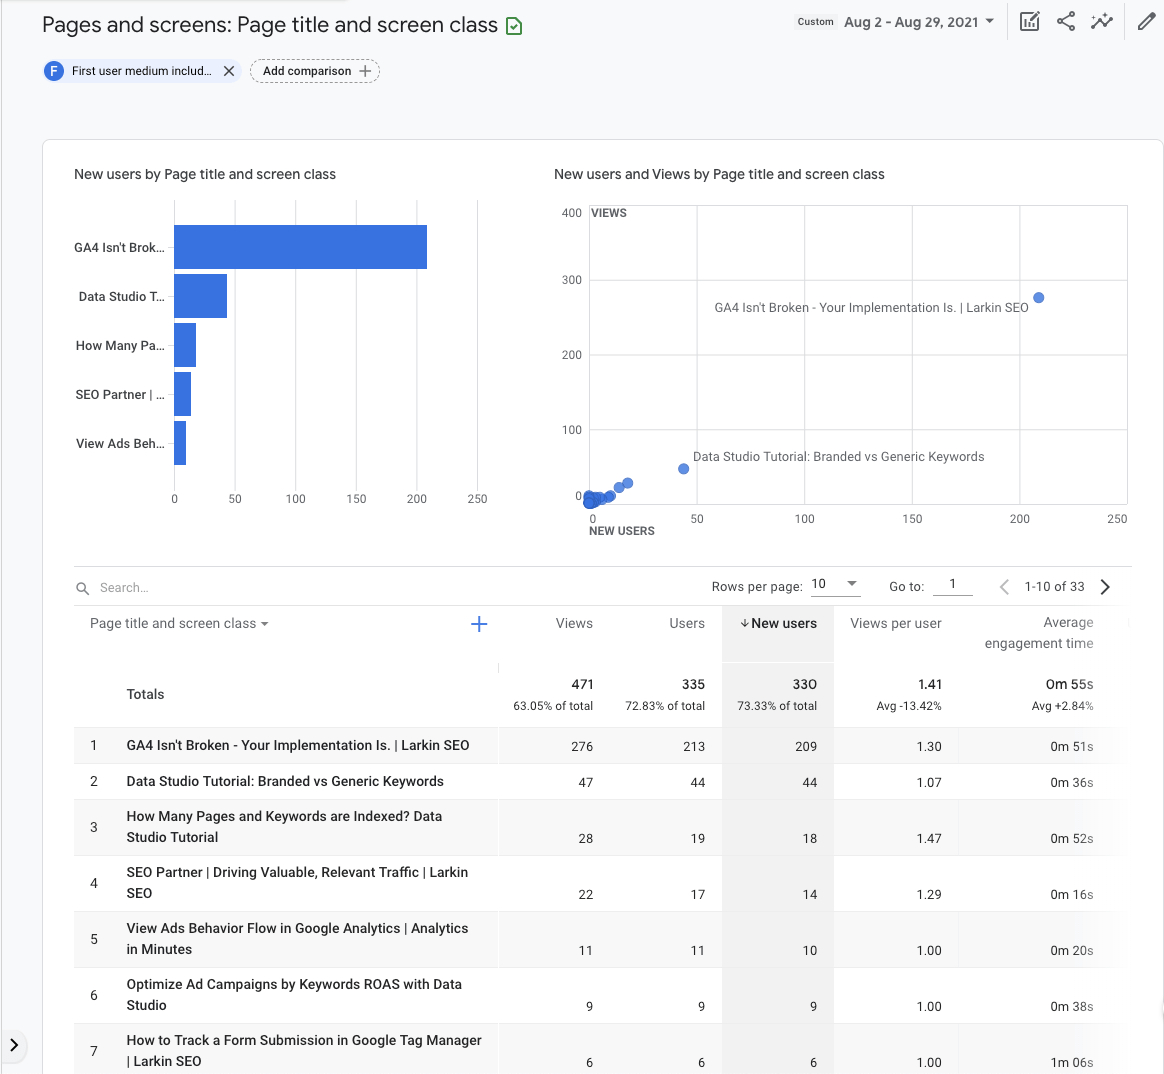
These organic landing pages are bringing in the most new users (first-time visitors) to your website. You will want to create more articles like these.
On the flip side, click the header a second time to sort the table by ascending value. If there are organic landing pages with zero user traffic, you will want to reevaluate their relevance to your business goals and adjust your strategy accordingly. This may include republishing the content or removing it from your site.
Improve geographical targeting: Where do my best customers come from?
If you’re investing in ads or multi-location SEO, you need location-specific insights to understand where to increase or decrease marketing efforts. You can use the Demographic details report for this.
Here’s how to do it:
- Go to the Demographic details report under Demographics.
- Sort the table by engagement rate, specific event, or total revenue.
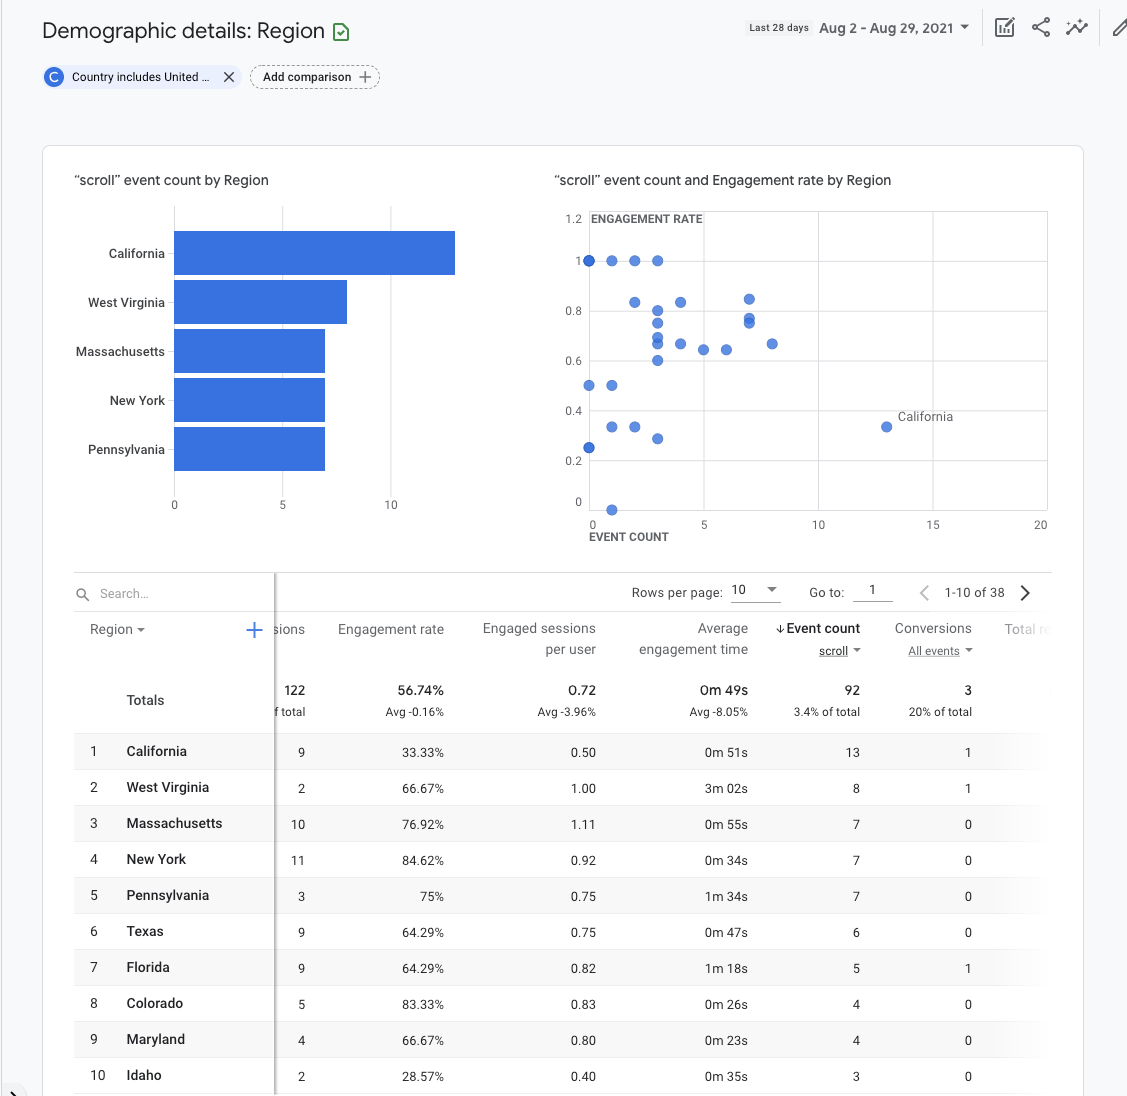
This report is very useful for fine-tuning Ads location targeting.
If you want to get more specific with your segmentation, click the Country dropdown in the first column of the table and change it to Town/City or Region.
Final thoughts
Setting up Google Analytics may feel like learning Klingon, but a basic report setup is all you need to get started. Investing twenty minutes of your day to learn how to set up GA4 and how to pull a handful of reports will pay for itself time and time again.
Success is in the data.
Got questions? Ping me on Twitter.