In traditional Ahrefs fashion, I wanted to do the largest data study ever done on AIOs to see what we could learn and share with the marketing community. For a twist on most studies, I’ve shown how they compare to search queries overall.
As a bonus, I’ll show you how you can pull the numbers yourself any time you want updated data.
Let’s dig into the data.
Here’s a quick look at some of the biggest takeaways:
- AIOs show for 9.46% of all keywords on Desktop, 16% in the US
- AIOs show for 12.8% or more of all Google searches by volume
- The top 50 domains have 28.90% of all mentions
- AIOs show more than normal for informational queries, longer search queries, and queries with higher search volumes
- AIOs show up less than normal for branded queries, local queries, and shorter search queries
- AIOs mostly show on non-monetized searches
AIOs are showing more than ever. They’re reducing clicks by 34.5%. And yet, most of the queries they’re showing for are informational queries that people weren’t bidding on.
At the very least, AIOs aren’t likely to impact Google’s bottom line. I wonder how much they will impact companies? Companies investing in their content are also the most likely to show for AIOs. Some may even benefit from them, but the vast majority, I think, will lose traffic. We’ll have to see how it plays out.
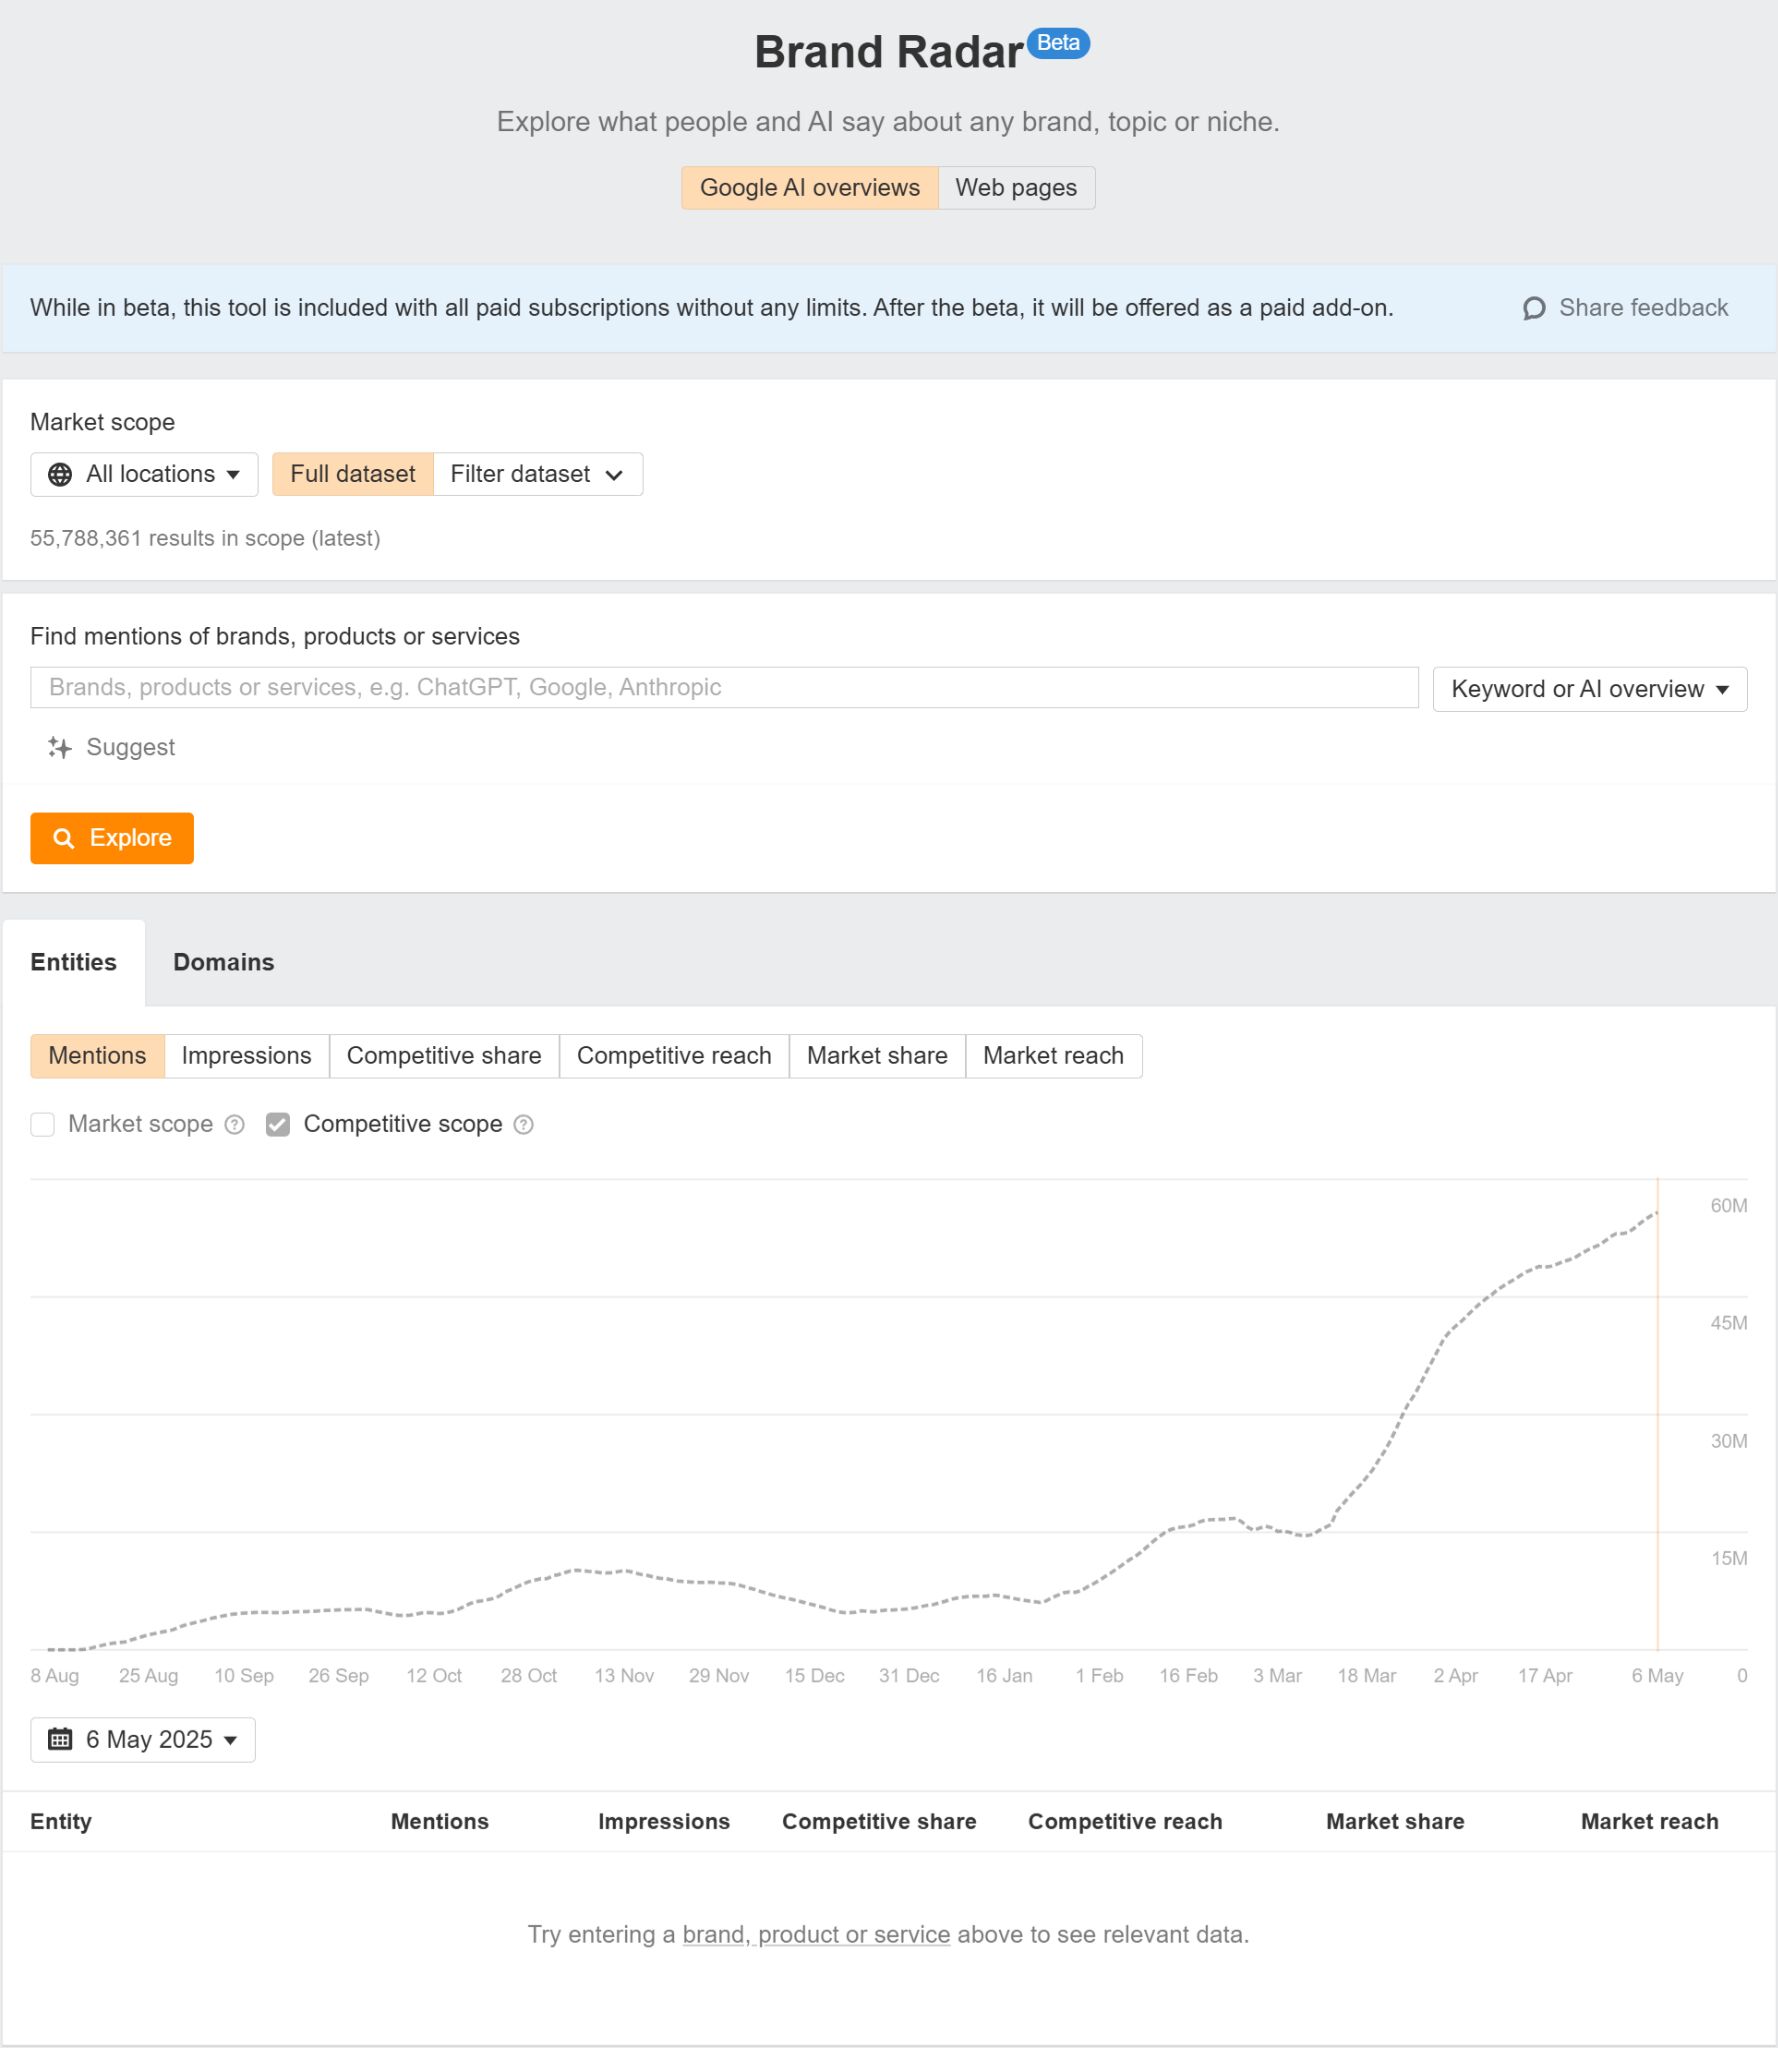
You can do a blank search in Brand Radar to see how many AIOs we’ve seen for the SERPs Ahrefs uses to build our traffic estimates. The line chart shows the trend over time, including the huge increase in their presence in March 2025.
AIOs show for 9.46% of all keywords, but they haven’t fully rolled out
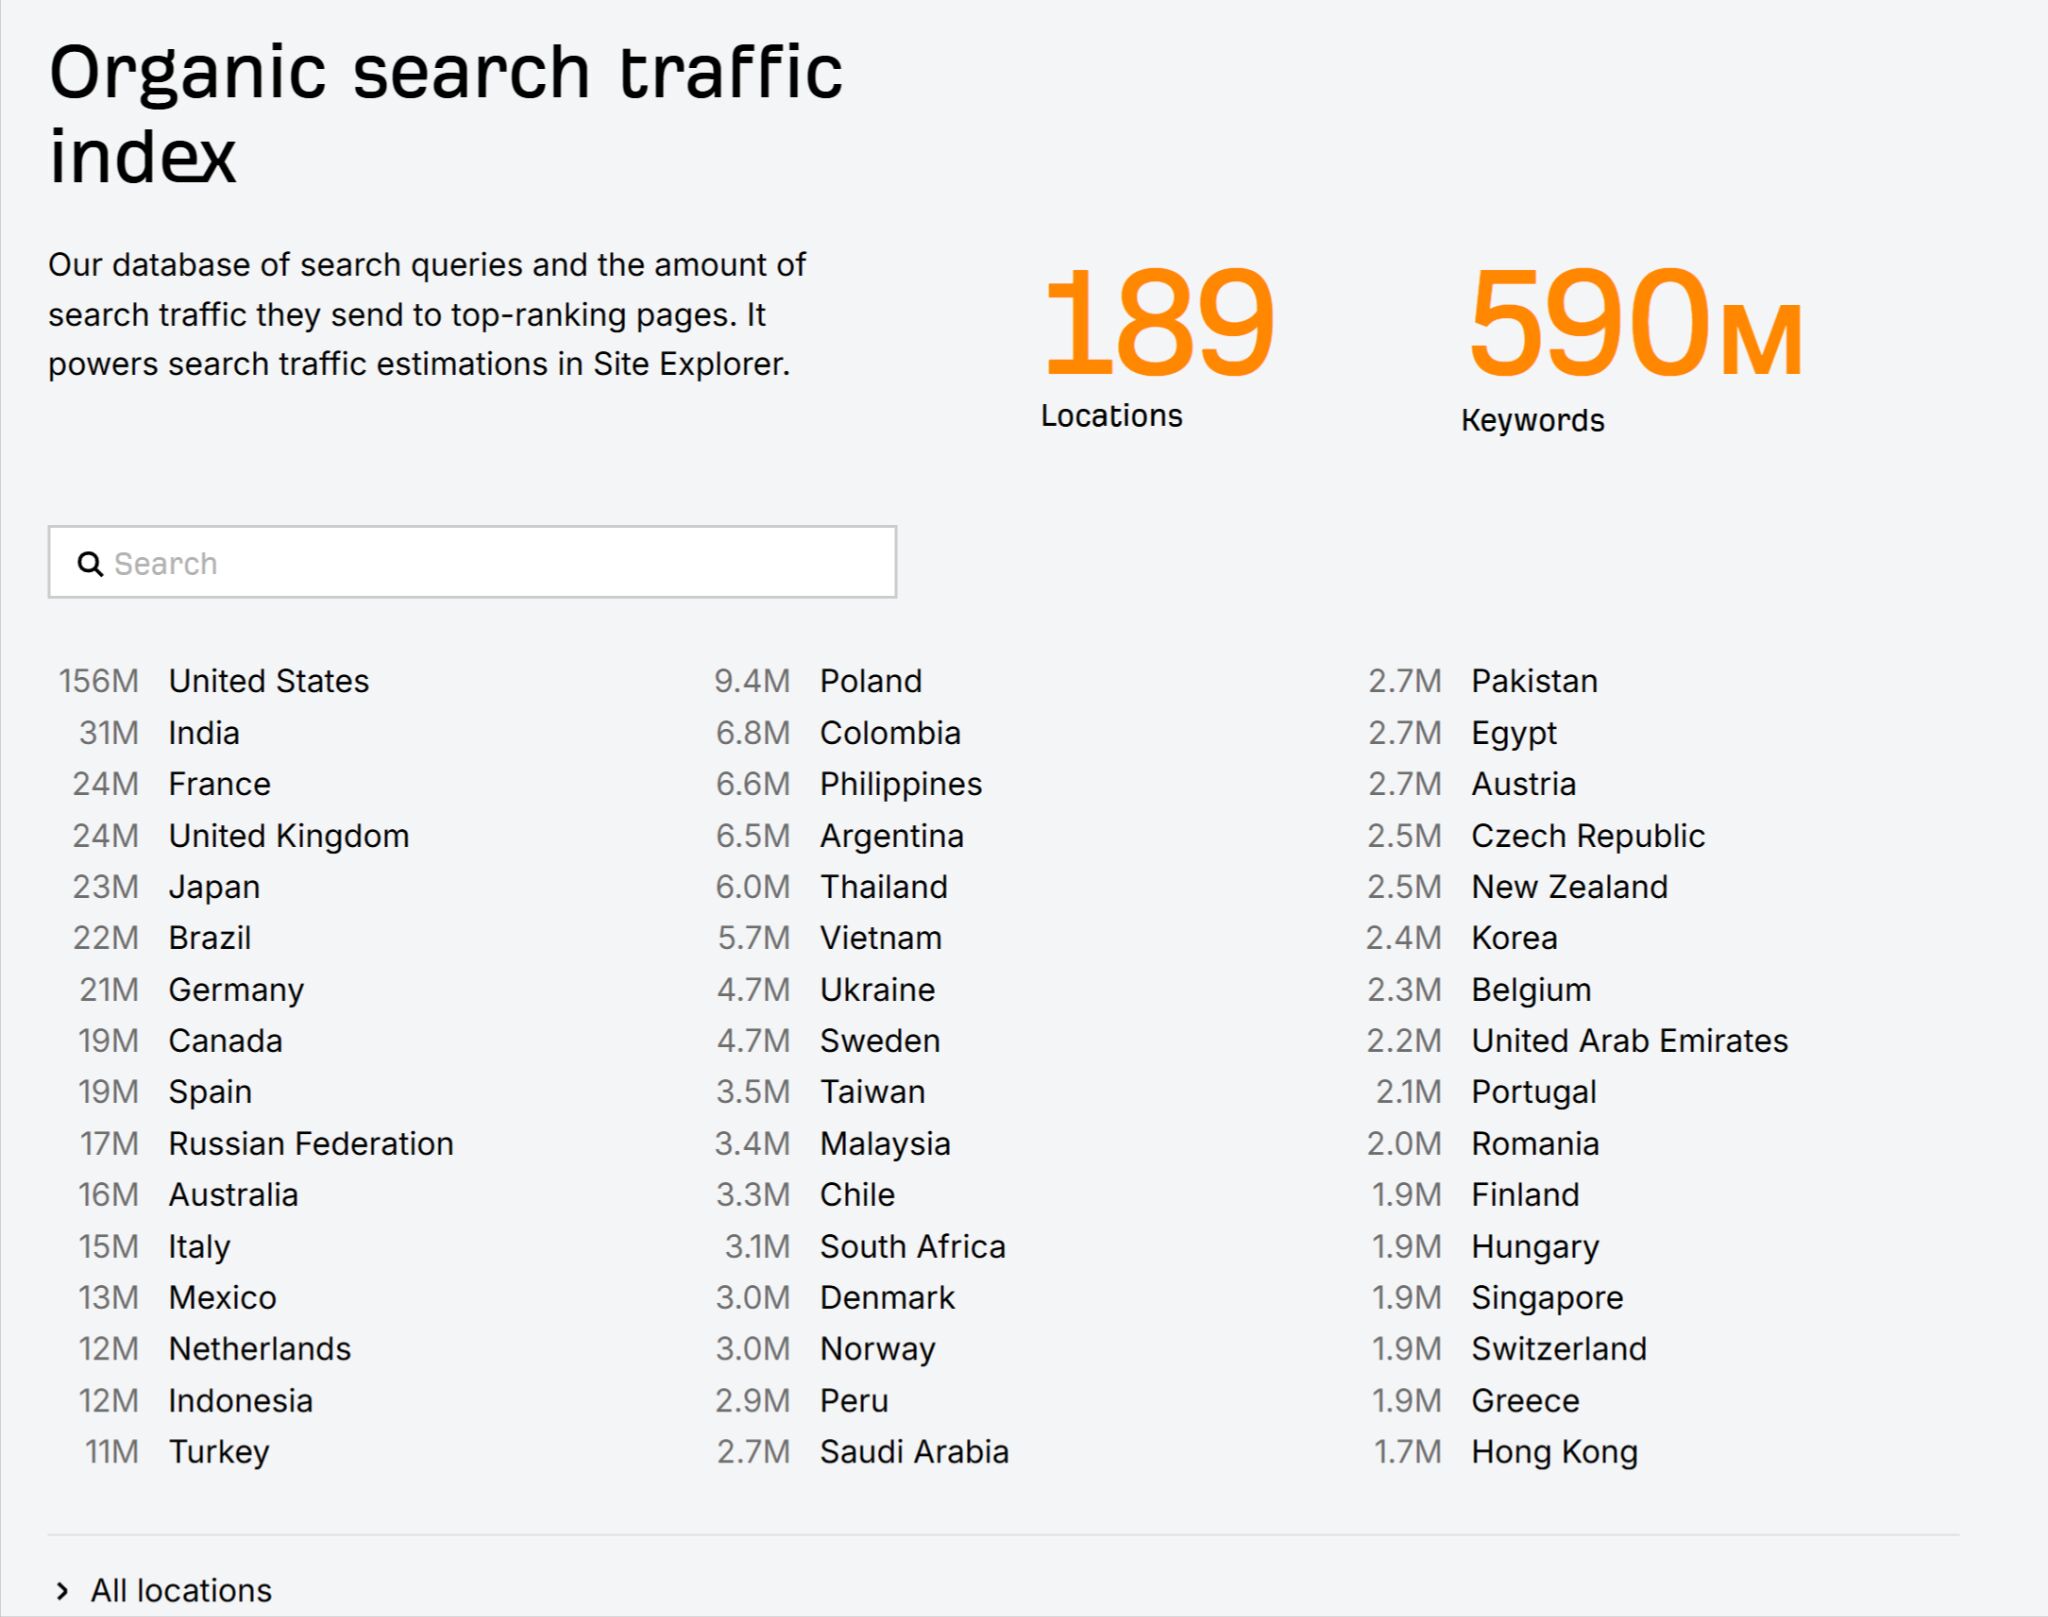
At the time of writing, we have ~55.8 million AIOs from Desktop search results. This is out of 590M total keywords used to build our organic search traffic index, ~9.46% of the total. You can refer to our Big Data page at any time to get the current number of keywords in our index and the number for each country.
AIOs show for 12.8% or more of all searches by volume
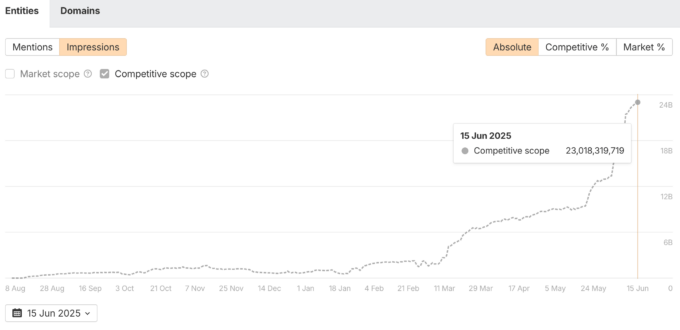
You can switch the tab to Impressions to see the total search volume for all the terms showing AIOs, or their total visibility. As of June 15th, 2025, it’s ~23 billion total volume out of ~180 billion total monthly searches in our index. 12.8% of all Google searches are showing AIOs.
Ahrefs and Google by the numbers
Because I don’t want anyone directly comparing our numbers to Google’s number where they say there are over 5 trillion searches annually, I feel like I need to quickly explain some differences.
Some quick math on our numbers. 180 million monthly searches * 12 months = 2.16 trillion searches a year in our data. That’s less than the 5 trillion Google says.
To try to explain the difference, there are many low-volume searches that Google classifies as anonymous queries. According to Google, 15% of searches have never been searched before. When we looked at GSC data a few years ago, 46.08% of queries were anonymous.
2.16 trillion (our yearly search numbers) / 0.54 (non-anonymous query %) = 4 trillion searches. That’s in the ballpark. Any further differences could be because anonymous queries increased, we have some gaps in our keyword database, or our volume estimates are a bit low.
Google no longer has a max word count when searching. It used to be 32 words max, but now you can have as many as you want until the max URL limit is reached.
AIOs had a staggered rollout. You can see country-level data by changing the country in the dropdown in Brand Radar.
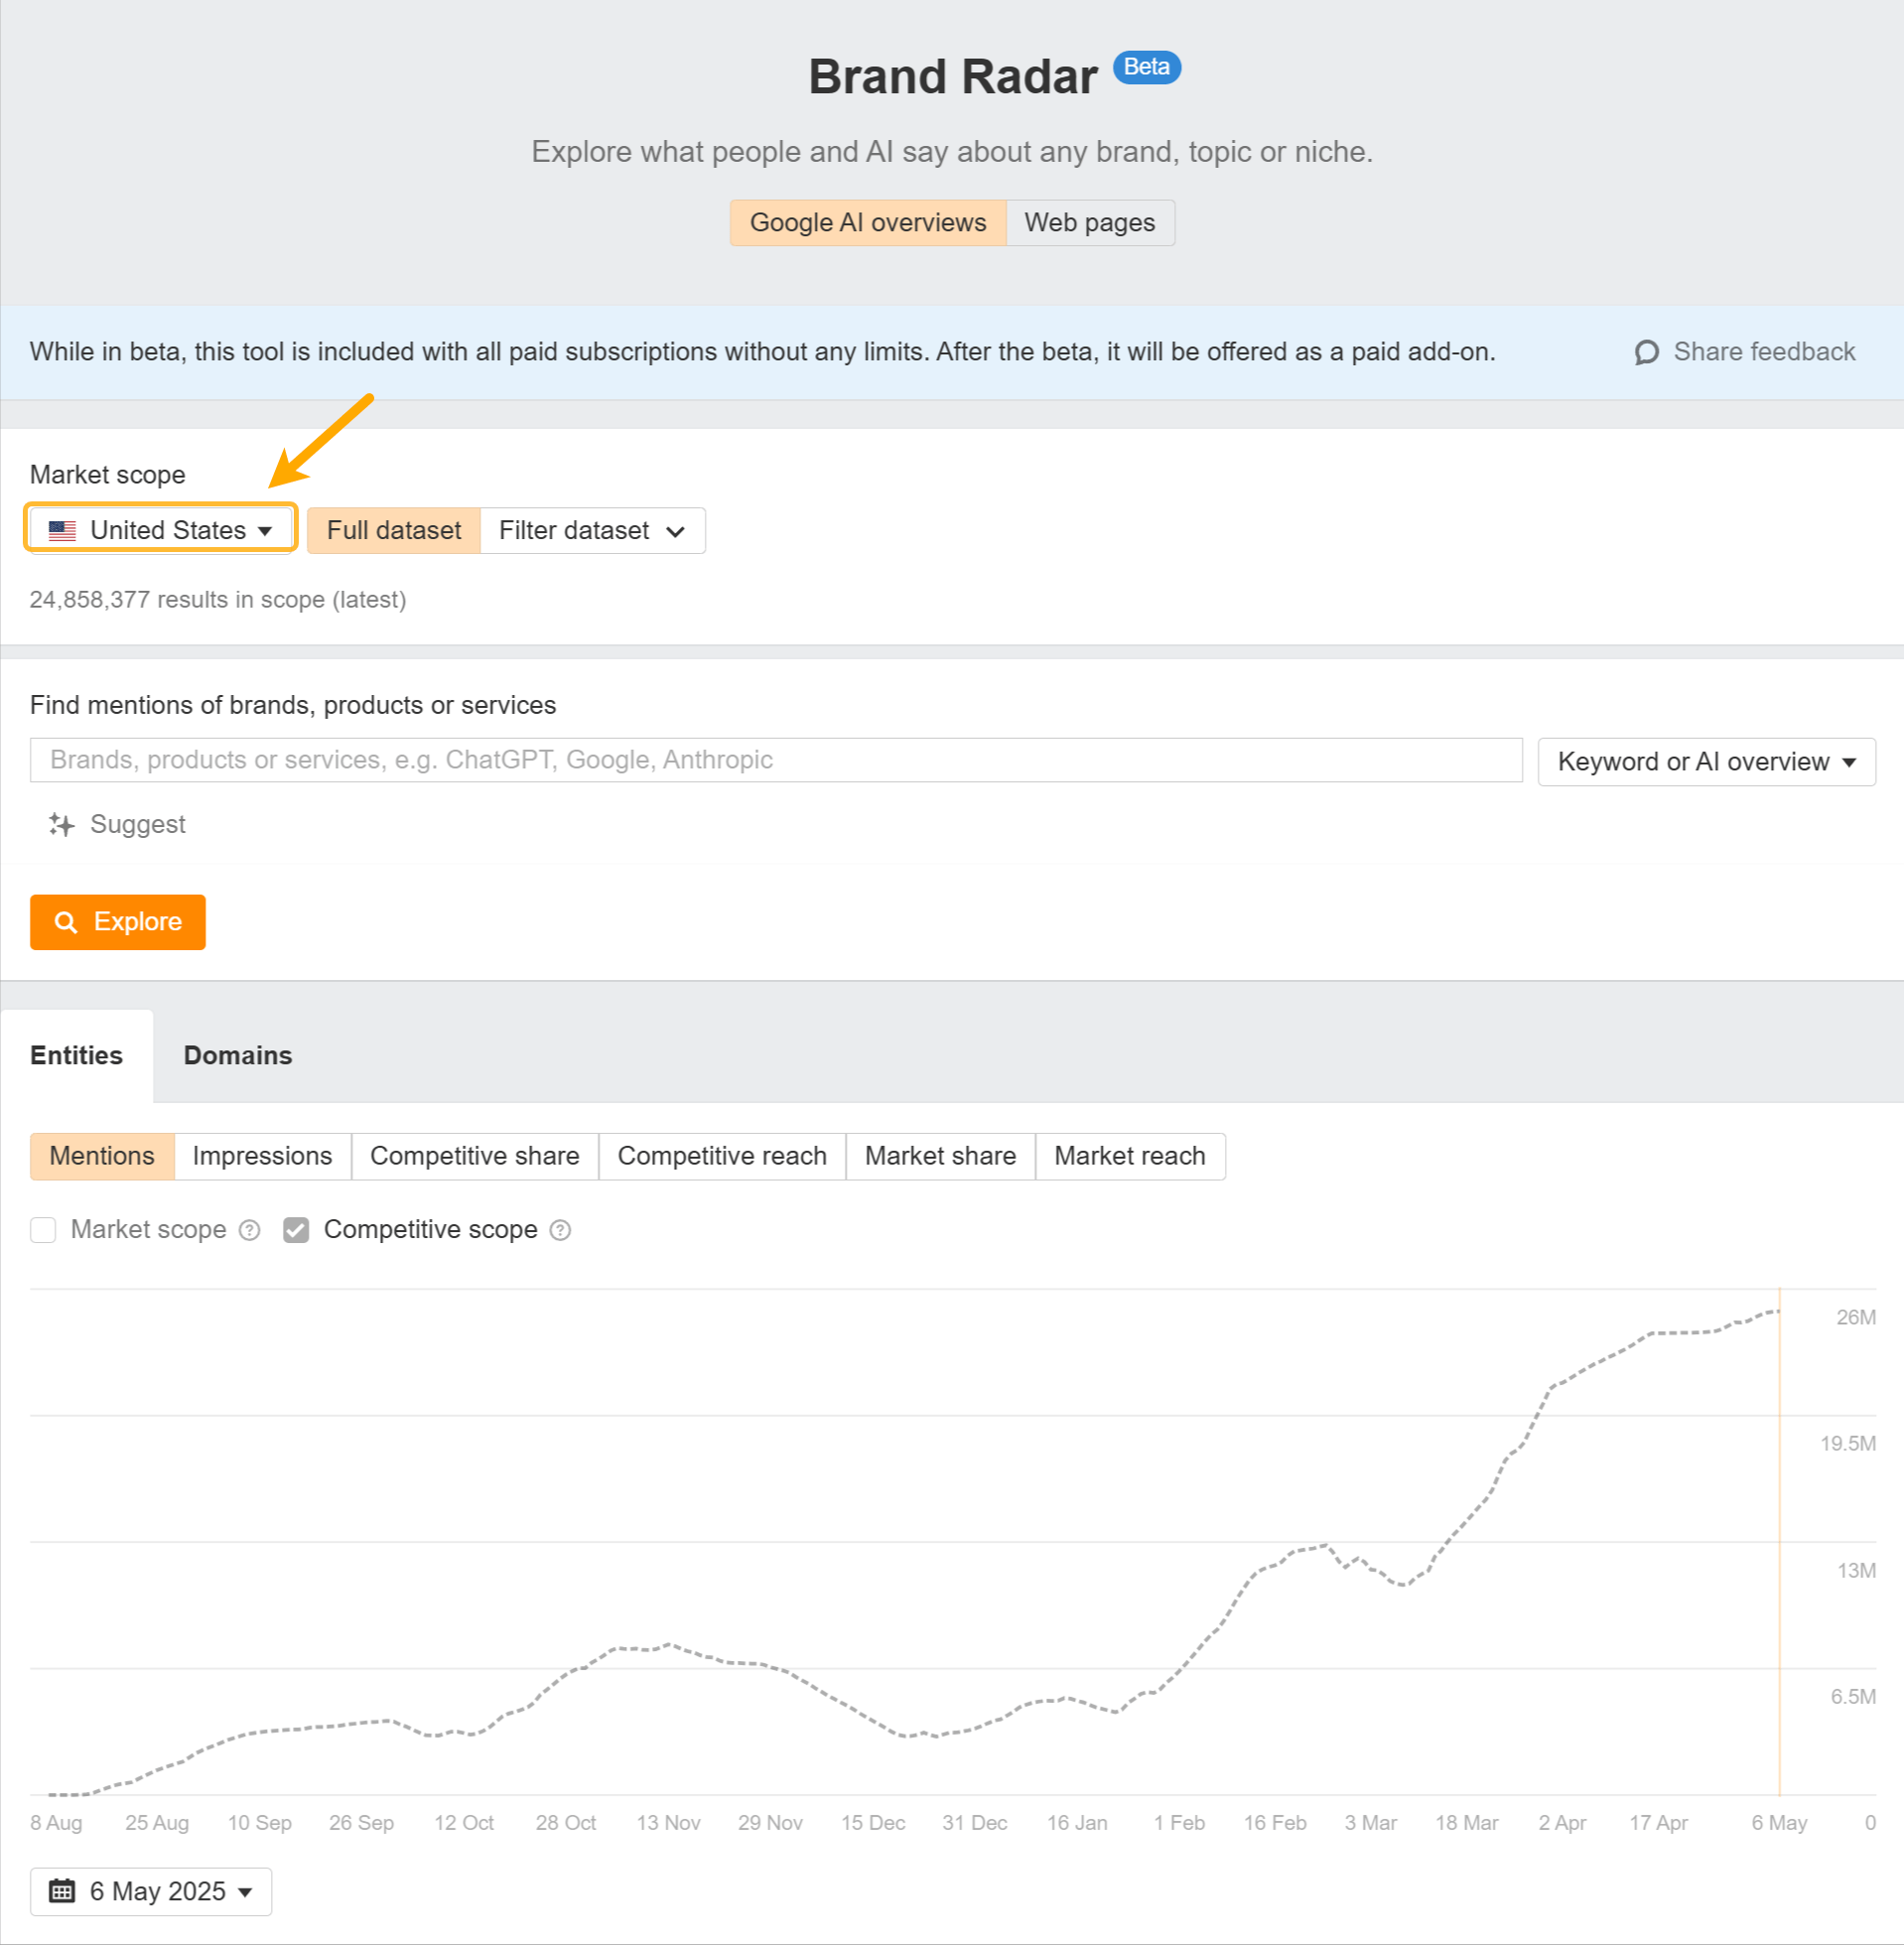
AIOs show for 16% of all US keywords on Desktop
AIOs show for ~24.9 million out of 156 million search terms in our US organic search traffic index, ~16% of the total searches.
You can easily calculate this number for each country with the mentions data above and divide that by the total number of the Big Data page. India 16.5%, Brazil 15.5%, UK 12.5%, etc.
You can use the domains tab in Brand Radar to see what domains are mentioned in AIOs over time. We’ll have a filter for this shortly, but right now you can see the domains that have the greatest share of AIOs.
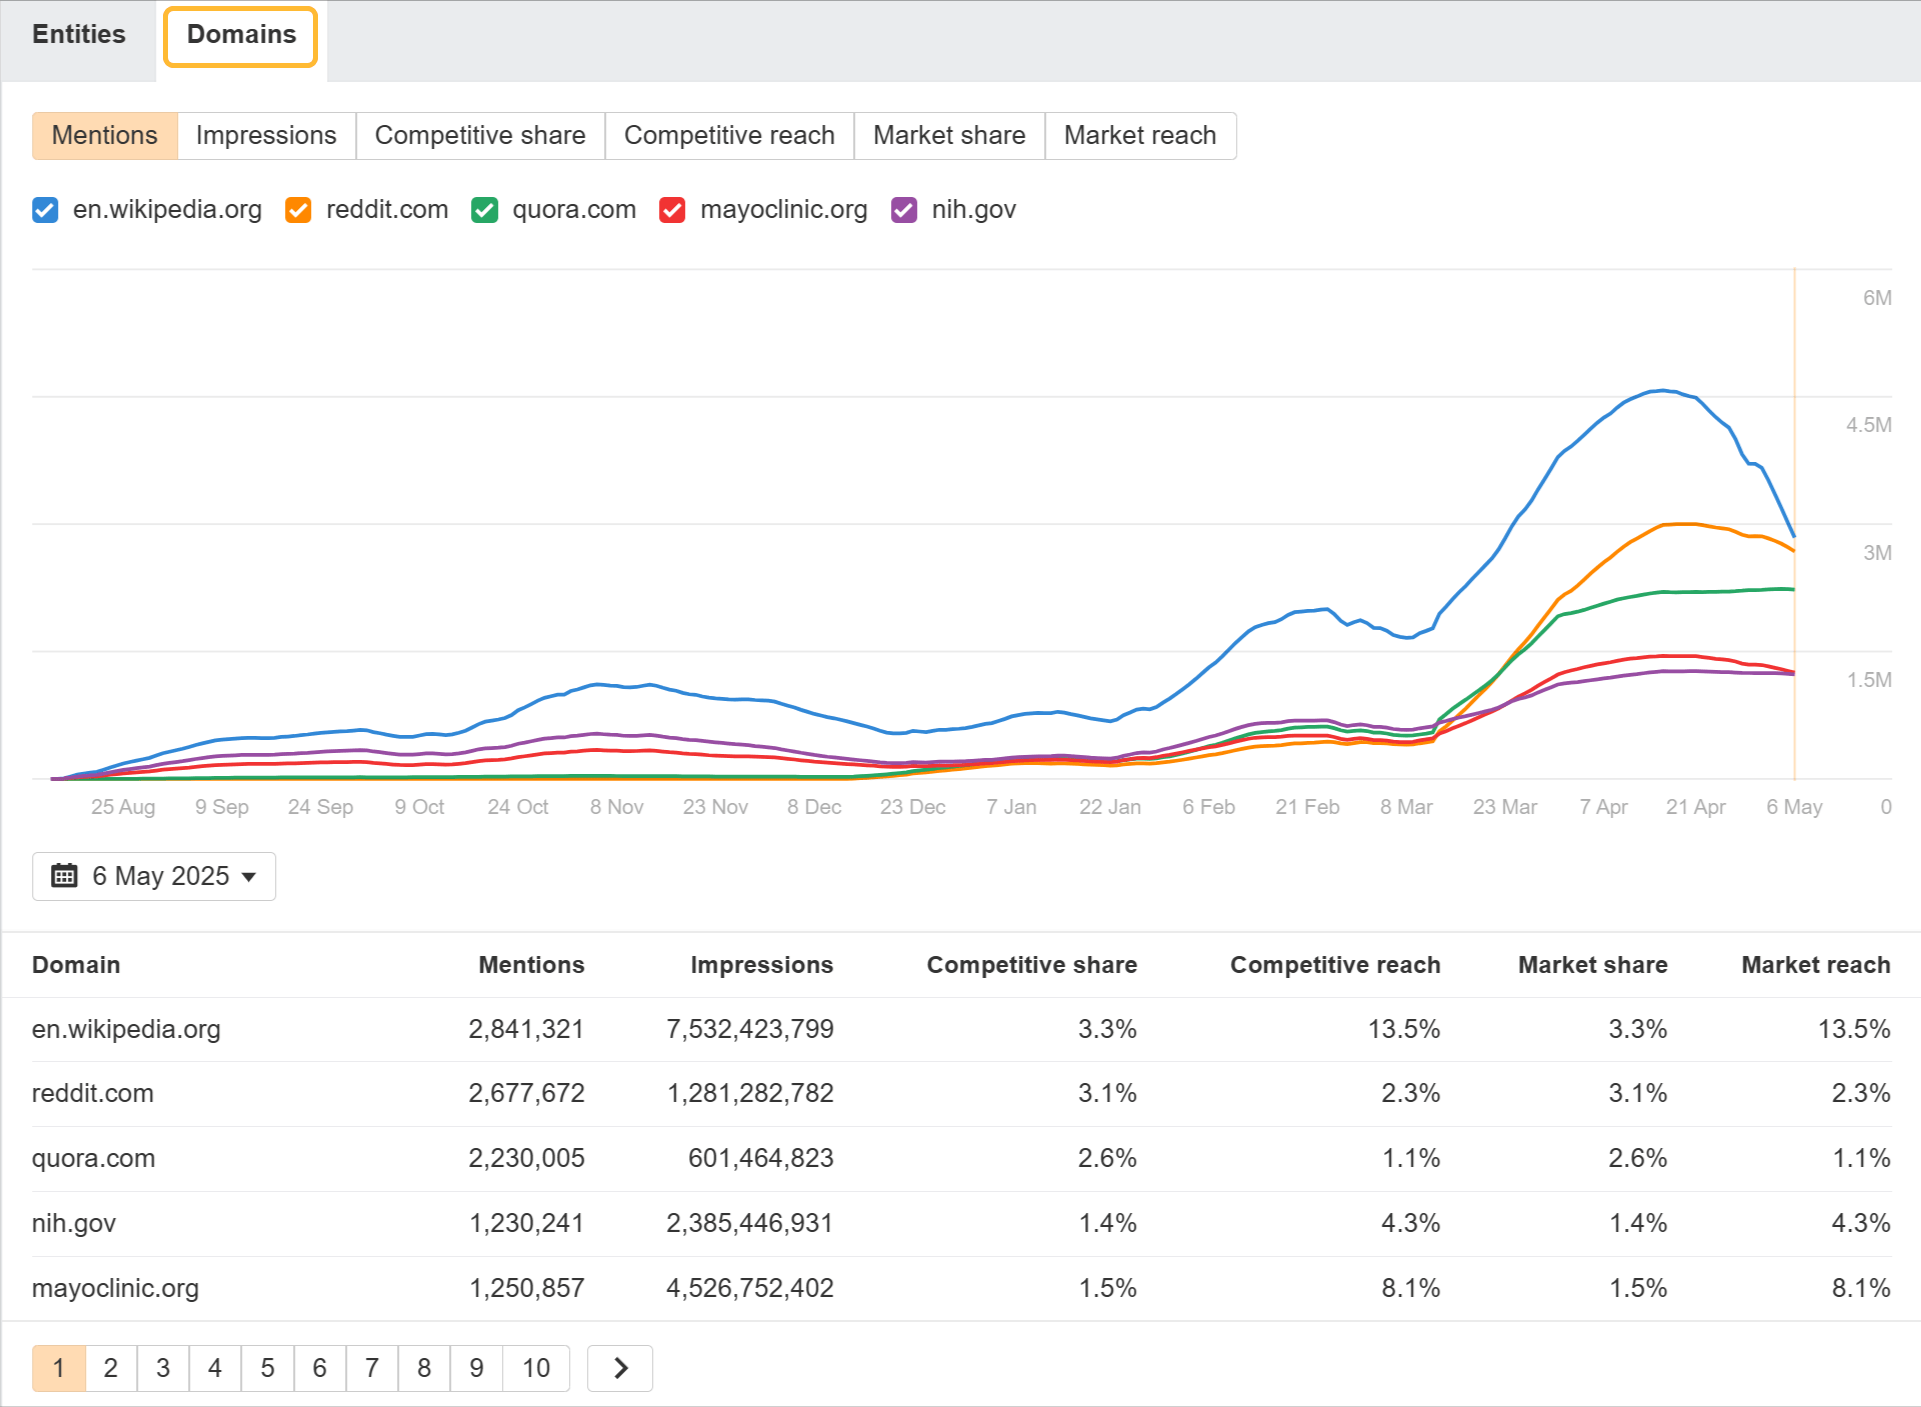
The top 50 domains have 28.9% of all AIO mentions
AIOs are dominated by top sites. While many people report losing clicks to AIOs, I wouldn’t be surprised if many of these sites were actually benefiting from them.
| Domain | Mentions | Impressions |
|---|---|---|
| reddit.com | 2,971,746 | 1,881,884,930 |
| en.wikipedia.org | 2,920,525 | 13,910,509,832 |
| quora.com | 2,276,494 | 618,988,629 |
| youtube.com | 2,063,355 | 3,577,707,498 |
| nih.gov | 1,288,730 | 3,124,783,852 |
| mayoclinic.org | 1,316,872 | 6,159,726,120 |
| clevelandclinic.org | 1,109,623 | 5,098,852,777 |
| translate.google.com | 857,892 | 4,465,811,843 |
| healthline.com | 979,908 | 2,236,792,358 |
| webmd.com | 917,464 | 2,190,526,123 |
| apple.com | 441,986 | 680,920,972 |
| es.wikipedia.org | 597,865 | 5,223,350,730 |
| microsoft.com | 464,330 | 986,660,551 |
| medicalnewstoday.com | 573,680 | 1,188,183,953 |
| www.nhs.uk | 493,760 | 2,507,074,568 |
| medlineplus.gov | 473,850 | 2,721,231,563 |
| facebook.com | 438,867 | 446,833,096 |
| instagram.com | 441,136 | 746,231,176 |
| indeed.com | 359,963 | 553,924,993 |
| support.google.com | 297,335 | 522,568,488 |
| brainly.com | 264,347 | 23,764,810 |
| britannica.com | 297,924 | 2,497,564,834 |
| testbook.com | 229,035 | 84,720,146 |
| amazon.com | 238,838 | 523,926,930 |
| alodokter.com | 199,193 | 278,035,342 |
| merriam-webster.com | 256,994 | 3,170,311,903 |
| study.com | 248,252 | 558,343,910 |
| msdmanuals.com | 242,777 | 651,464,581 |
| sciencedirect.com | 242,799 | 662,899,861 |
| uol.com.br | 199,395 | 284,636,935 |
| kumparan.com | 184,165 | 116,489,768 |
| justanswer.com | 183,094 | 17,821,281 |
| byjus.com | 196,500 | 377,110,507 |
| cambridge.org | 192,555 | 3,041,651,028 |
| verywellhealth.com | 195,389 | 167,090,643 |
| detik.com | 166,645 | 127,771,207 |
| indiatimes.com | 161,599 | 264,059,019 |
| investopedia.com | 161,975 | 660,434,615 |
| pt.wikipedia.org | 163,875 | 1,069,981,476 |
| kidshealth.org | 161,776 | 441,933,241 |
| fandom.com | 145,761 | 519,074,759 |
| wiktionary.org | 159,394 | 820,932,071 |
| tuasaude.com | 146,483 | 175,433,902 |
| imdb.com | 138,758 | 345,263,254 |
| stackexchange.com | 140,760 | 45,714,814 |
| rae.es | 127,392 | 1,166,423,287 |
| cdc.gov | 130,112 | 621,061,238 |
| linkedin.com | 130,896 | 308,787,699 |
| hopkinsmedicine.org | 136,577 | 645,290,307 |
| petmd.com | 129,065 | 108,308,035 |
For those 50 sites, here are the categories and their percentage of overall mentions:
- Knowledge & Reference – 4.4%
- Health & Medical – 5.8%
- Q&A & Community Discussion – 5.9%
- Video & Social Media – 3.4%
- Search & Translation Tools – 1.2%
- Education & Learning – 1.3%
- News & Media – 0.6%
- E-Commerce & Tech – 1.1%
- Job & Career – 0.4%
- Regional & Localized Health – 0.4%
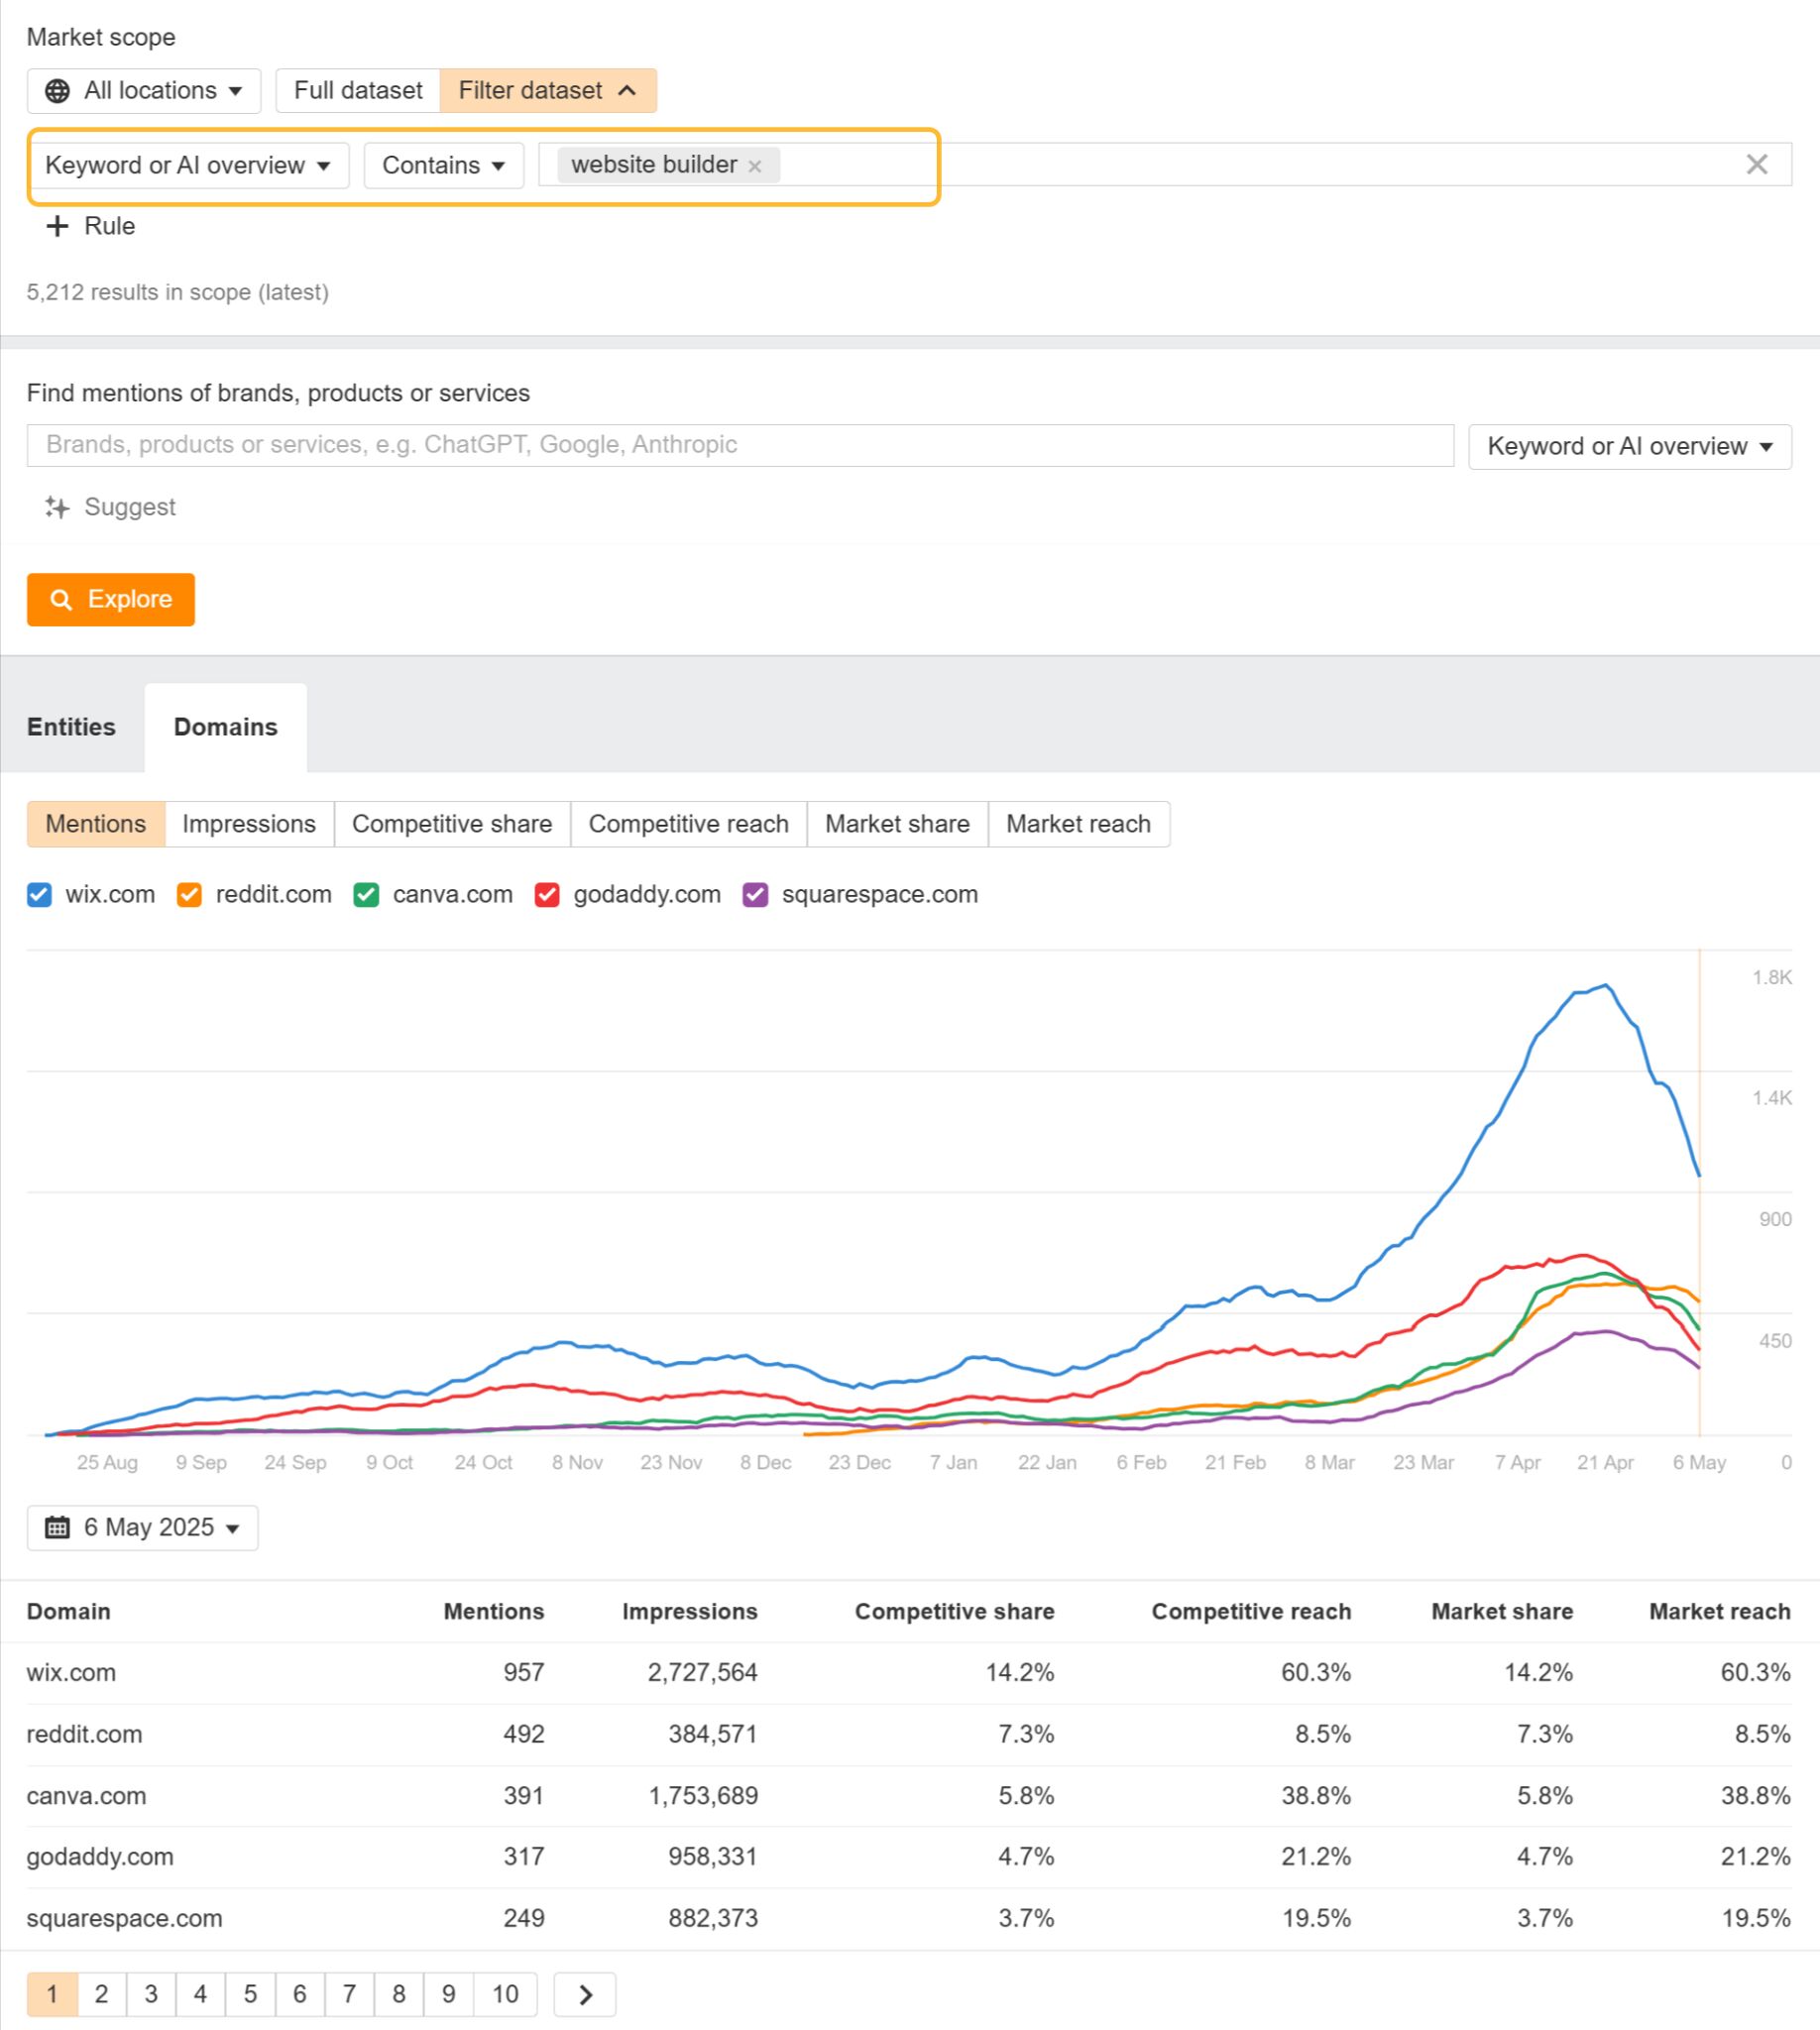
You can filter the dataset to be more specific to your industry. Check the domain tabs to see how competing sites are performing. For example, here I’ve filtered to look for keywords or AI Overviews containing “website builder”.
Another way of doing this is to use the full dataset, but use the “Find mentions of brands, products, or services” filter. Enter 1 or 2 and use “Suggest more” to use AI to get some of the competing companies or products.
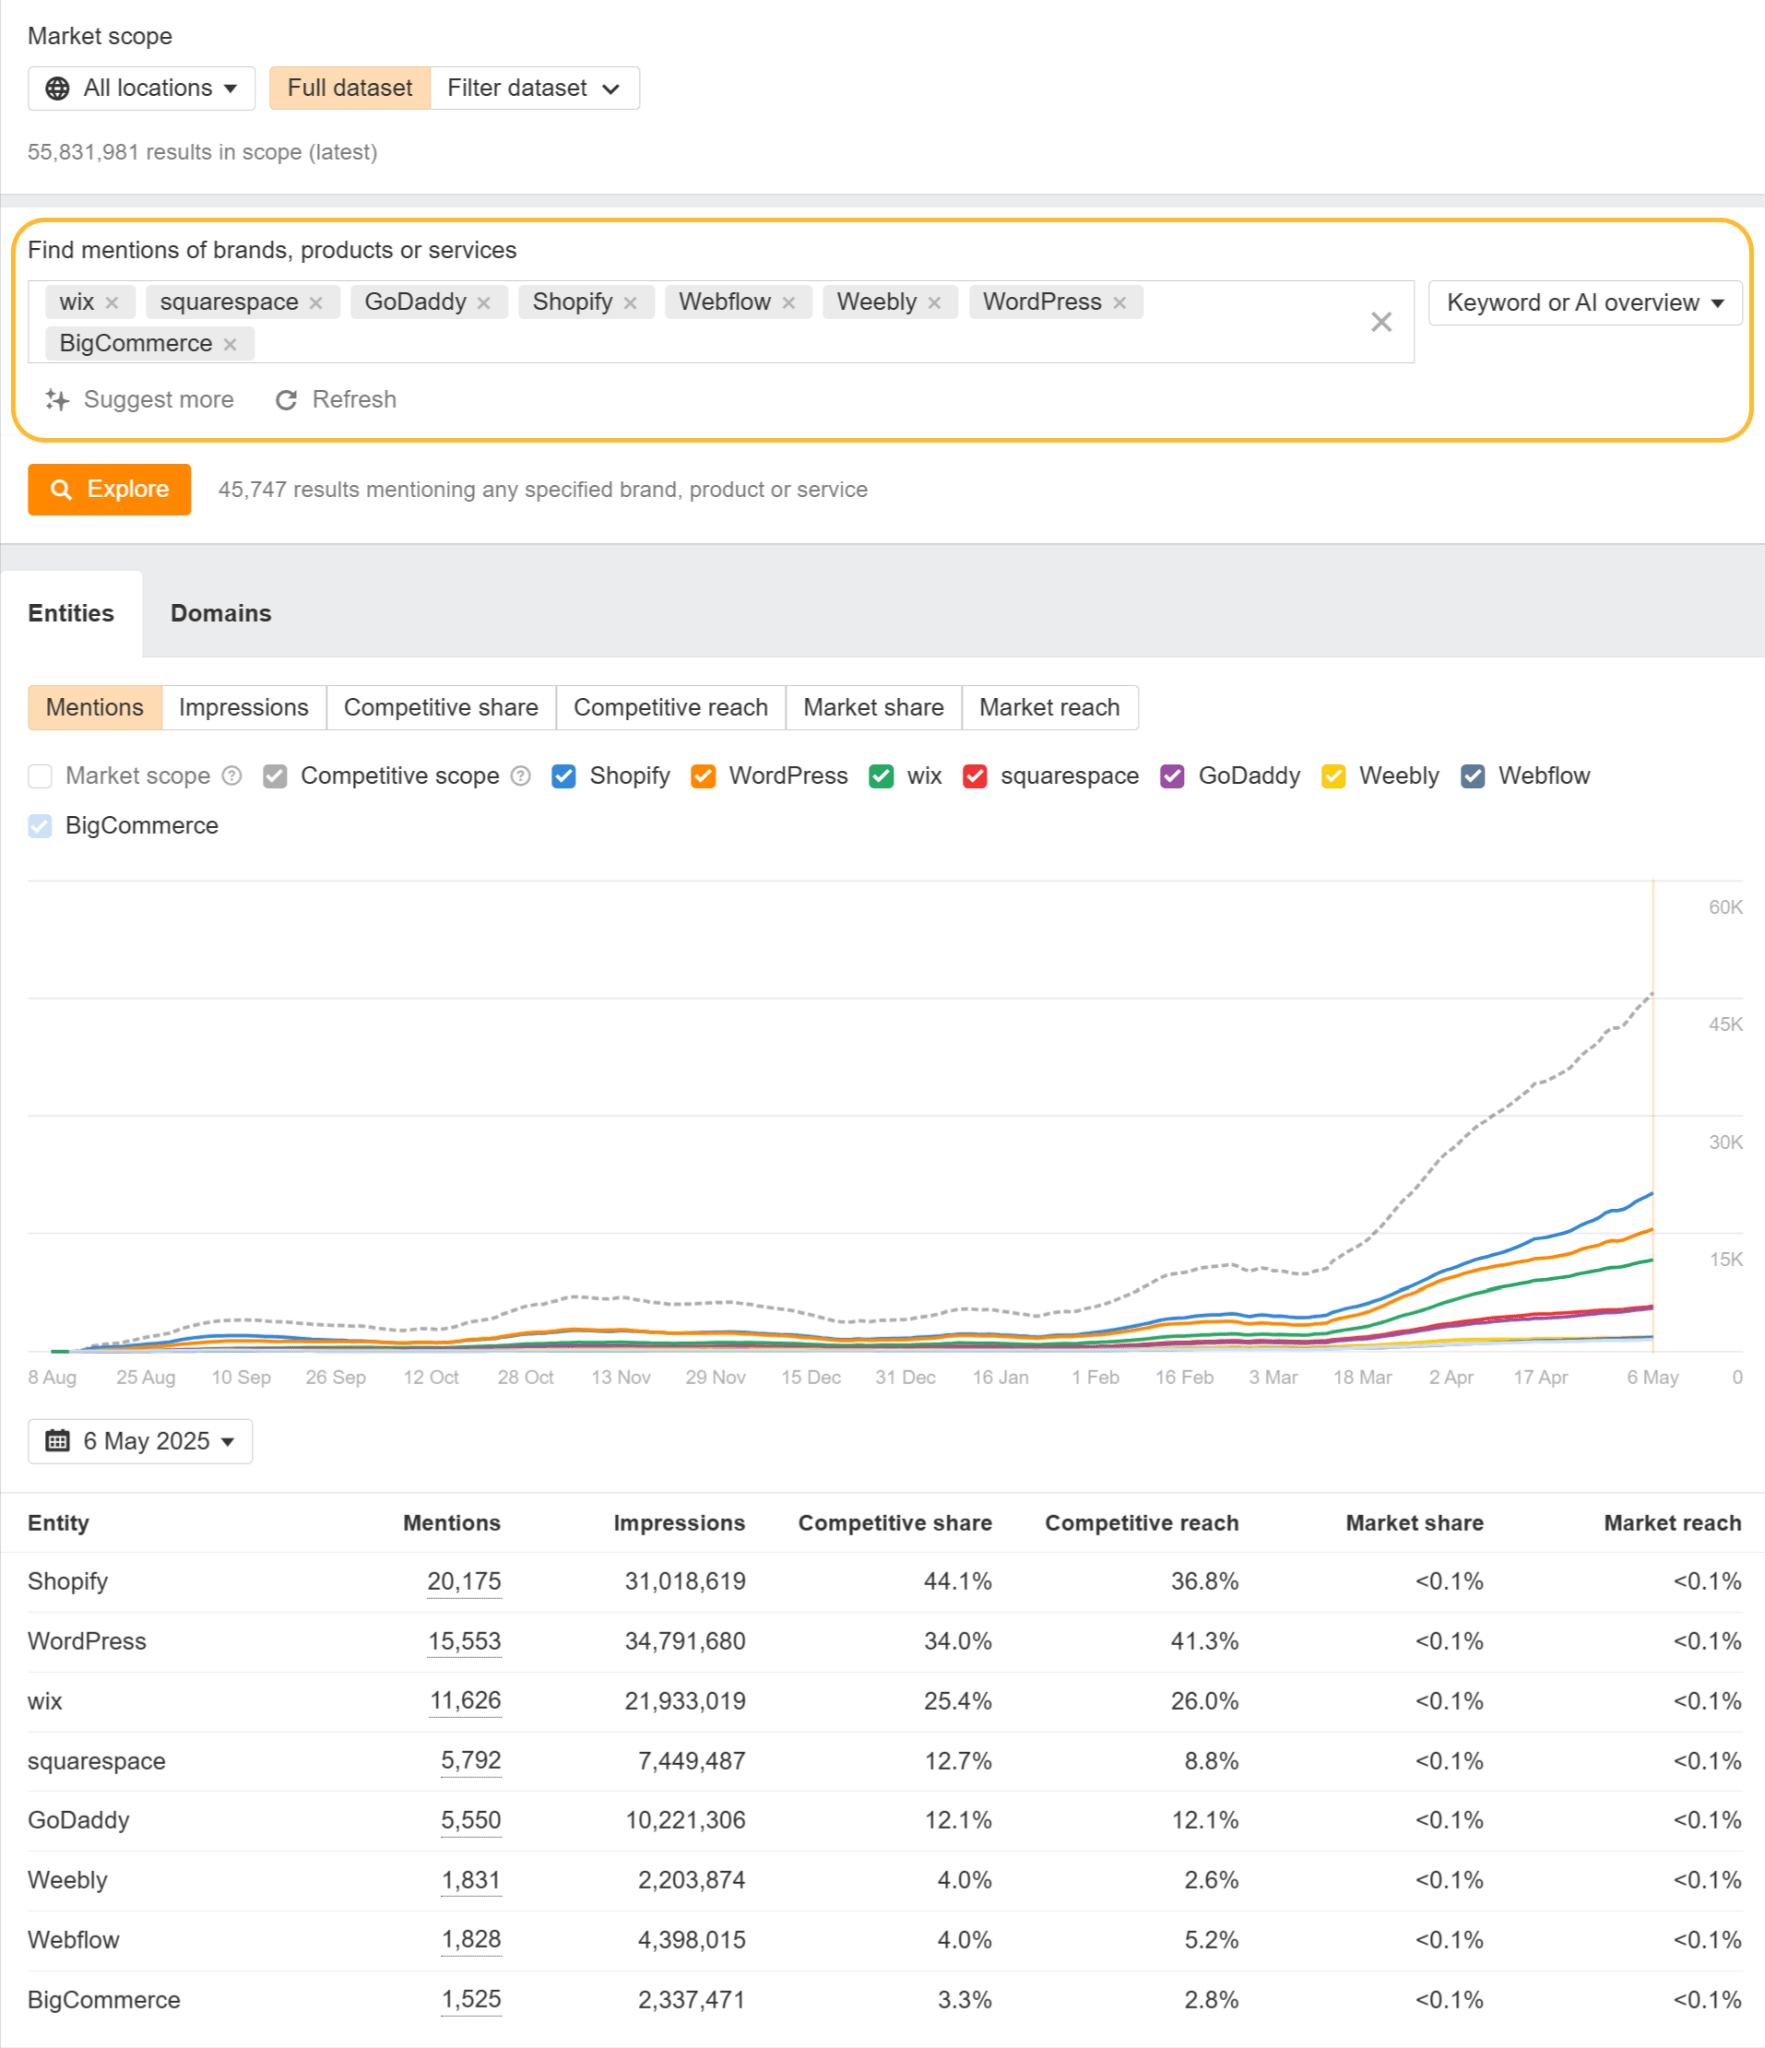
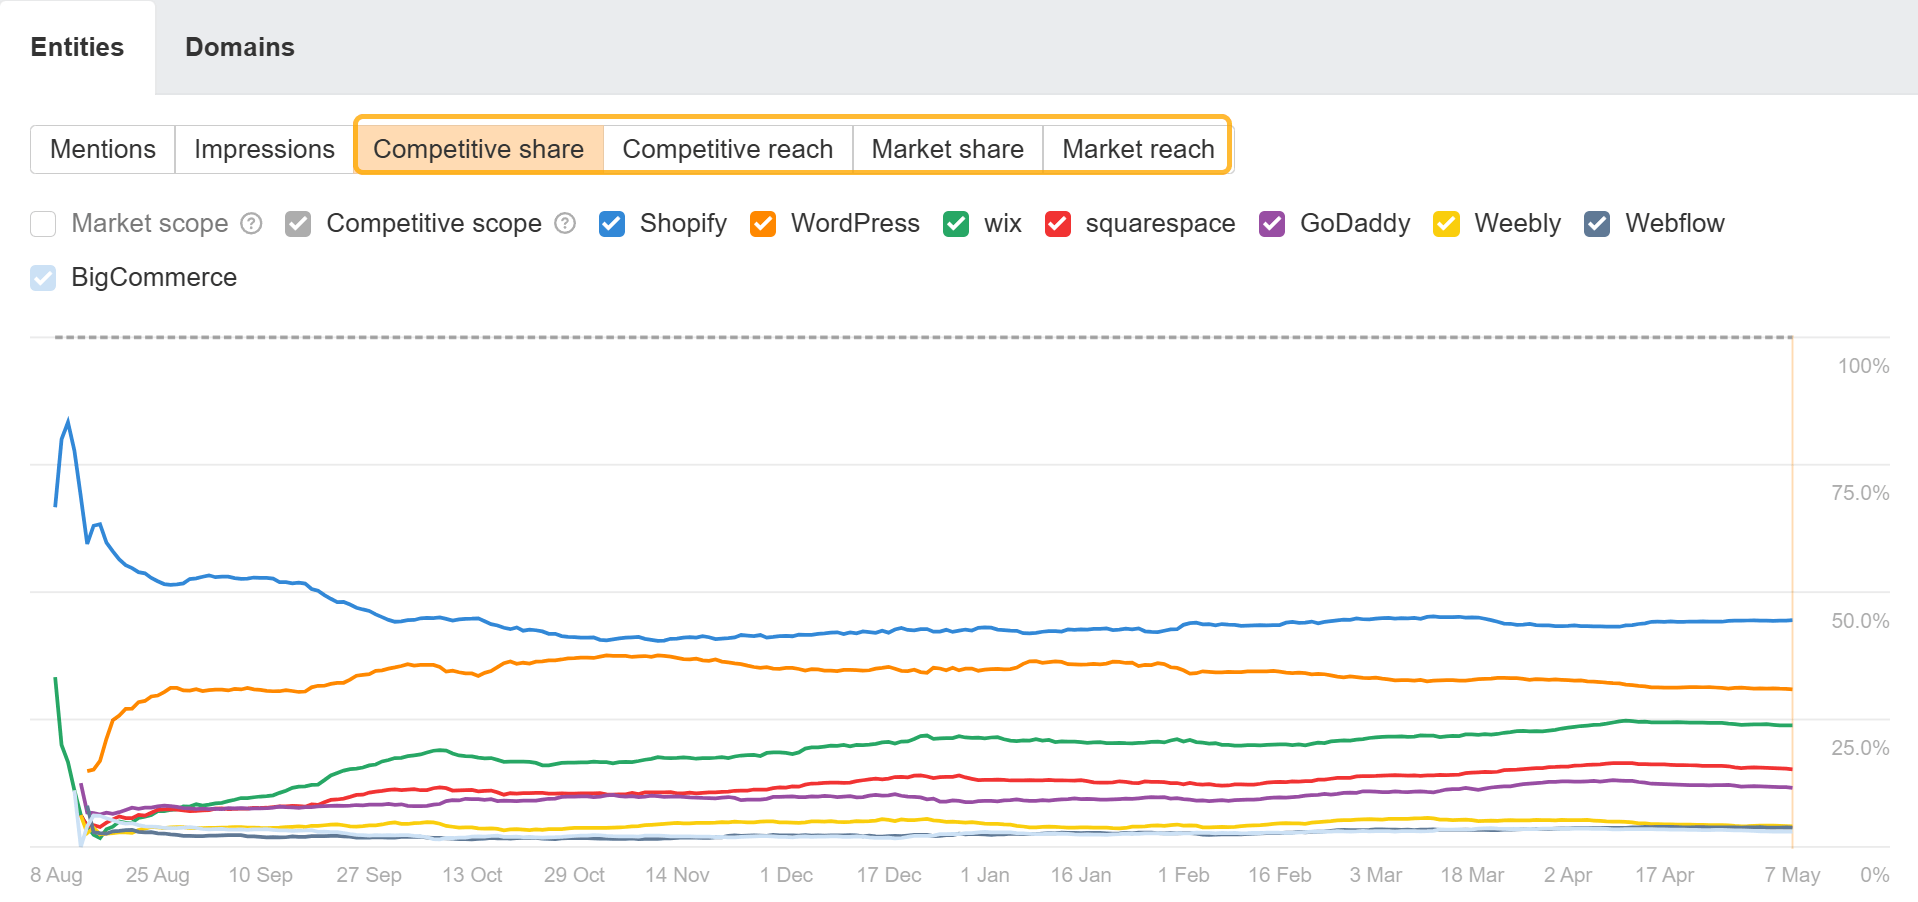
The share and reach reports will give you Share of Voice (SoV) for mentions and impressions.
In Keywords Explorer, you can do a blank search and get all the data for a country. If you filter by “SERP features” to “On SERP” > “AI Overview”, then you can see the total number of AIOs in our data. 24.8M for the US at the time of writing.
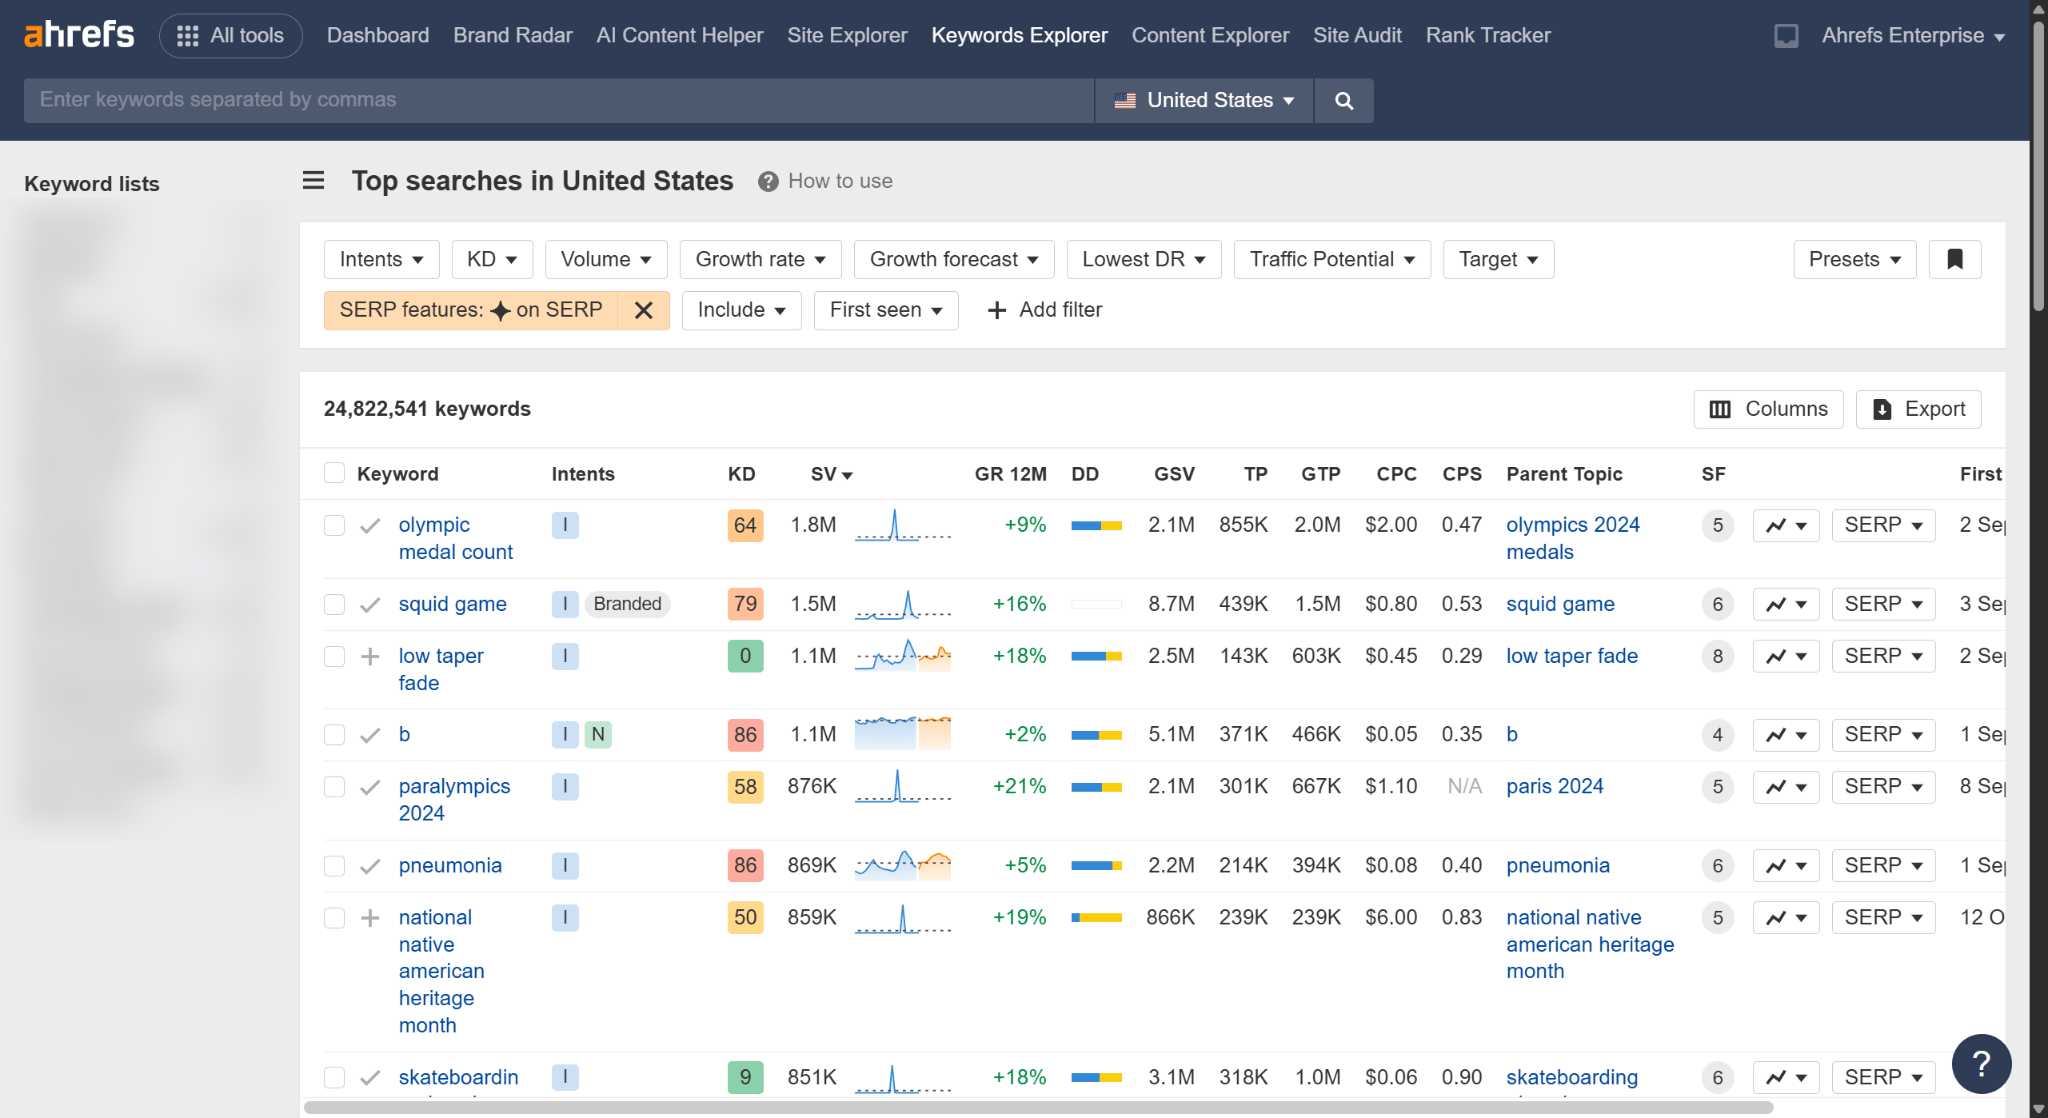
You can further filter by different data points like Intent to see more information about the type of terms where AIOs are showing.

For example, for the above search I got 24.3M keywords for Informational intent out of 24.8M total for the US. That’s 97.70% of the total.
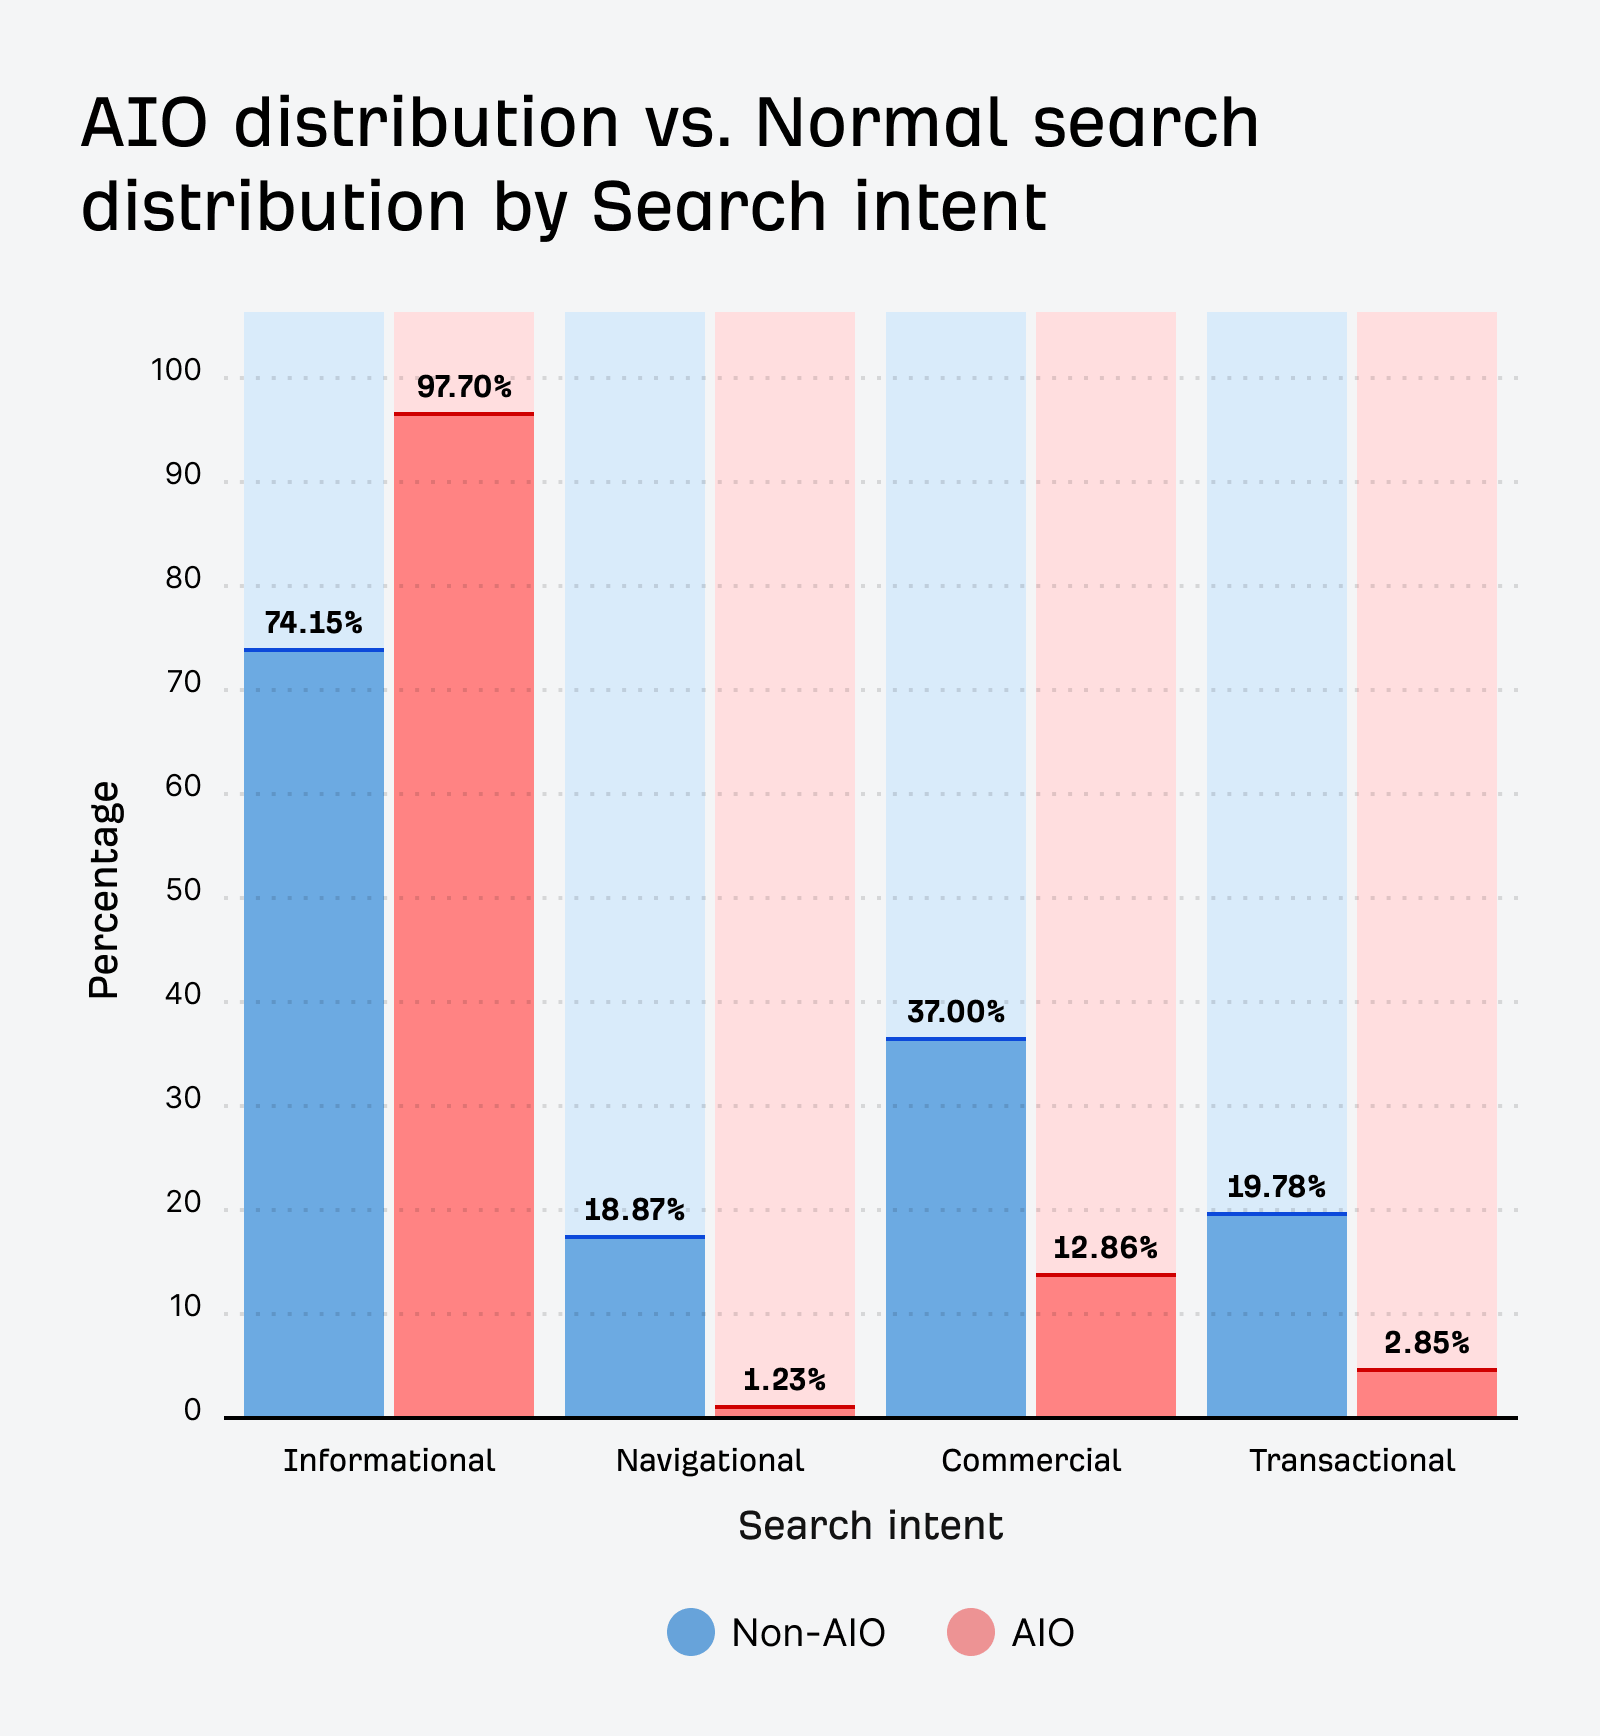
Remember that searches can have more than 1 intent. Here’s a breakdown with the current numbers:
- Informational: 97.70%
- Navigational: 1.23%
- Commercial: 12.86%
- Transactional: 2.85%
You can filter Keywords Explorer as described above to AIOs on the SERP + Branded or Non-Branded intents. At the time of writing I got the following percentages:
- Branded: 19.97%
- Non-branded: 80.03%
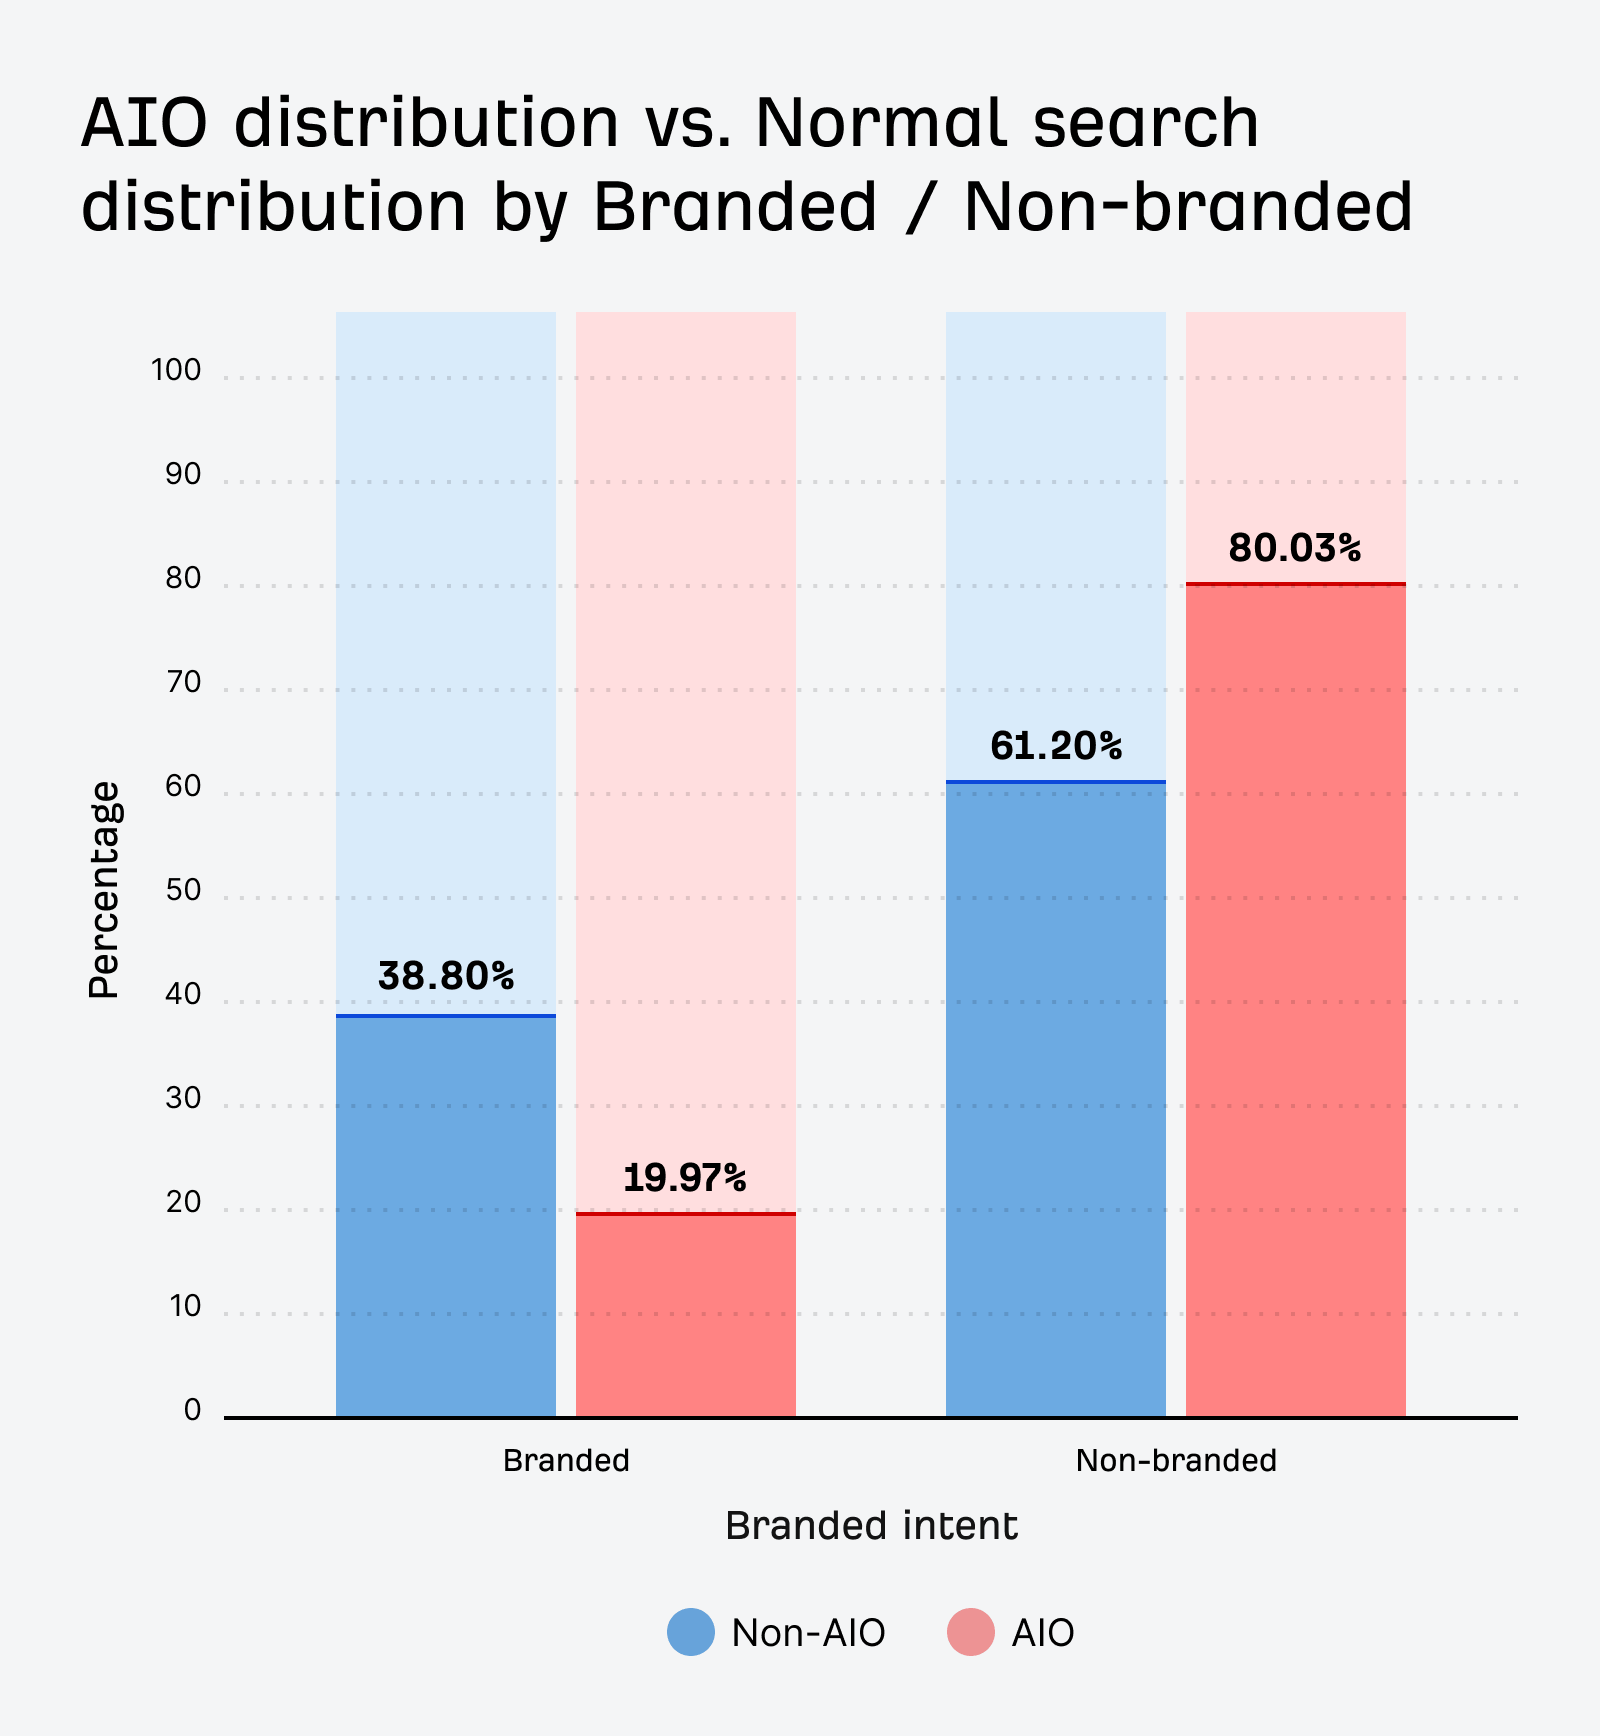
AIOs are less likely to show up for branded searches.
You can filter Keywords Explorer as described above to AIOs on the SERP and Local or Non-Local intents. At the time of writing, I got the following percentages:
- Local: 6.85%
- Non-Local: 93.15%
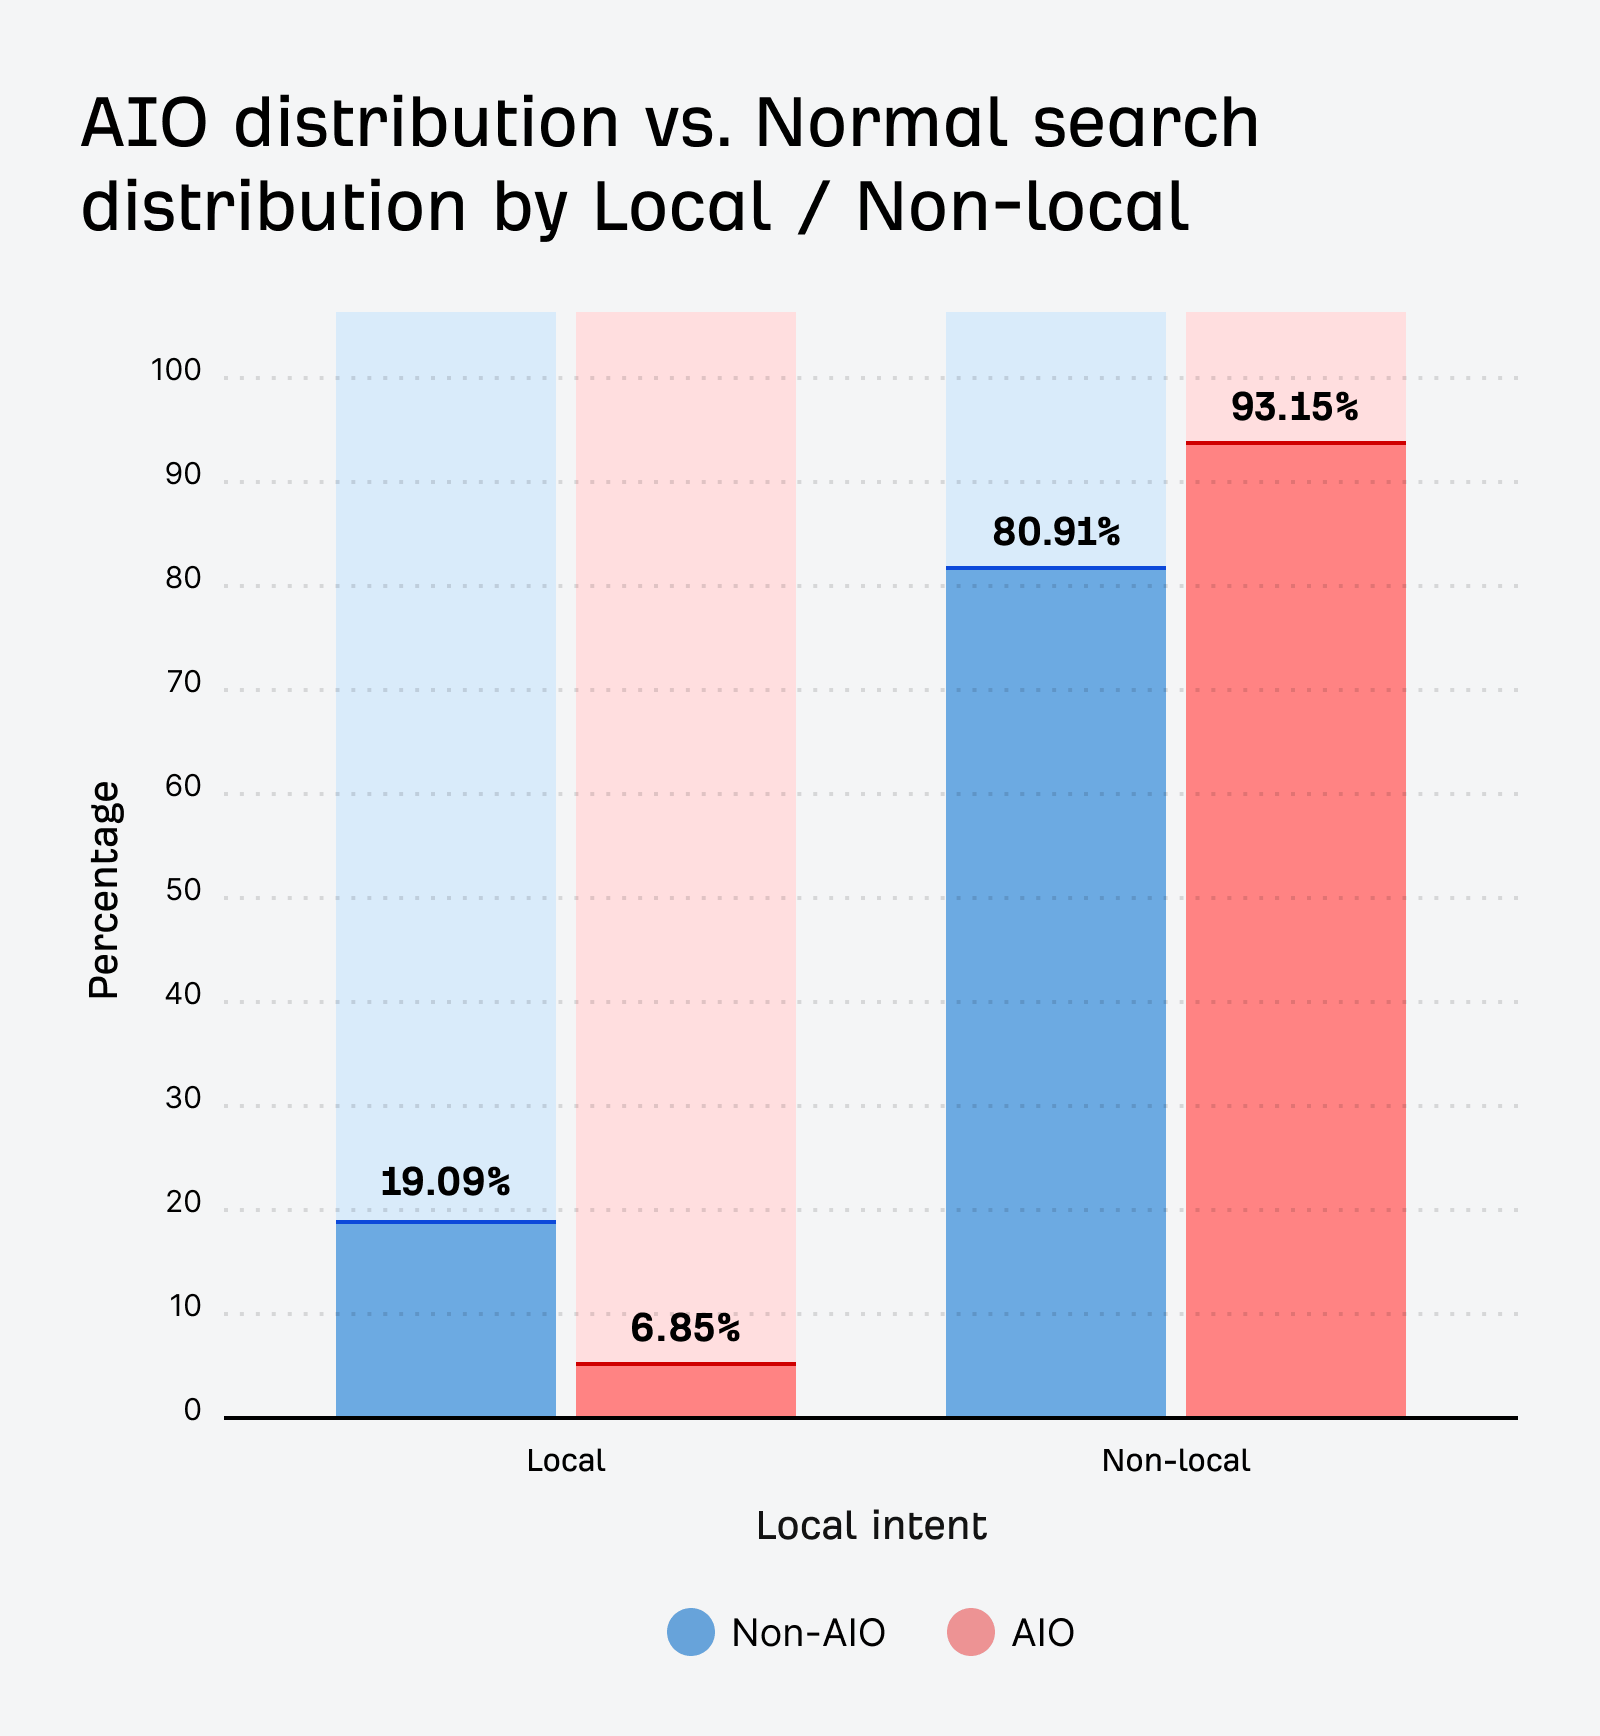
AIOs are less likely to show up for local searches.
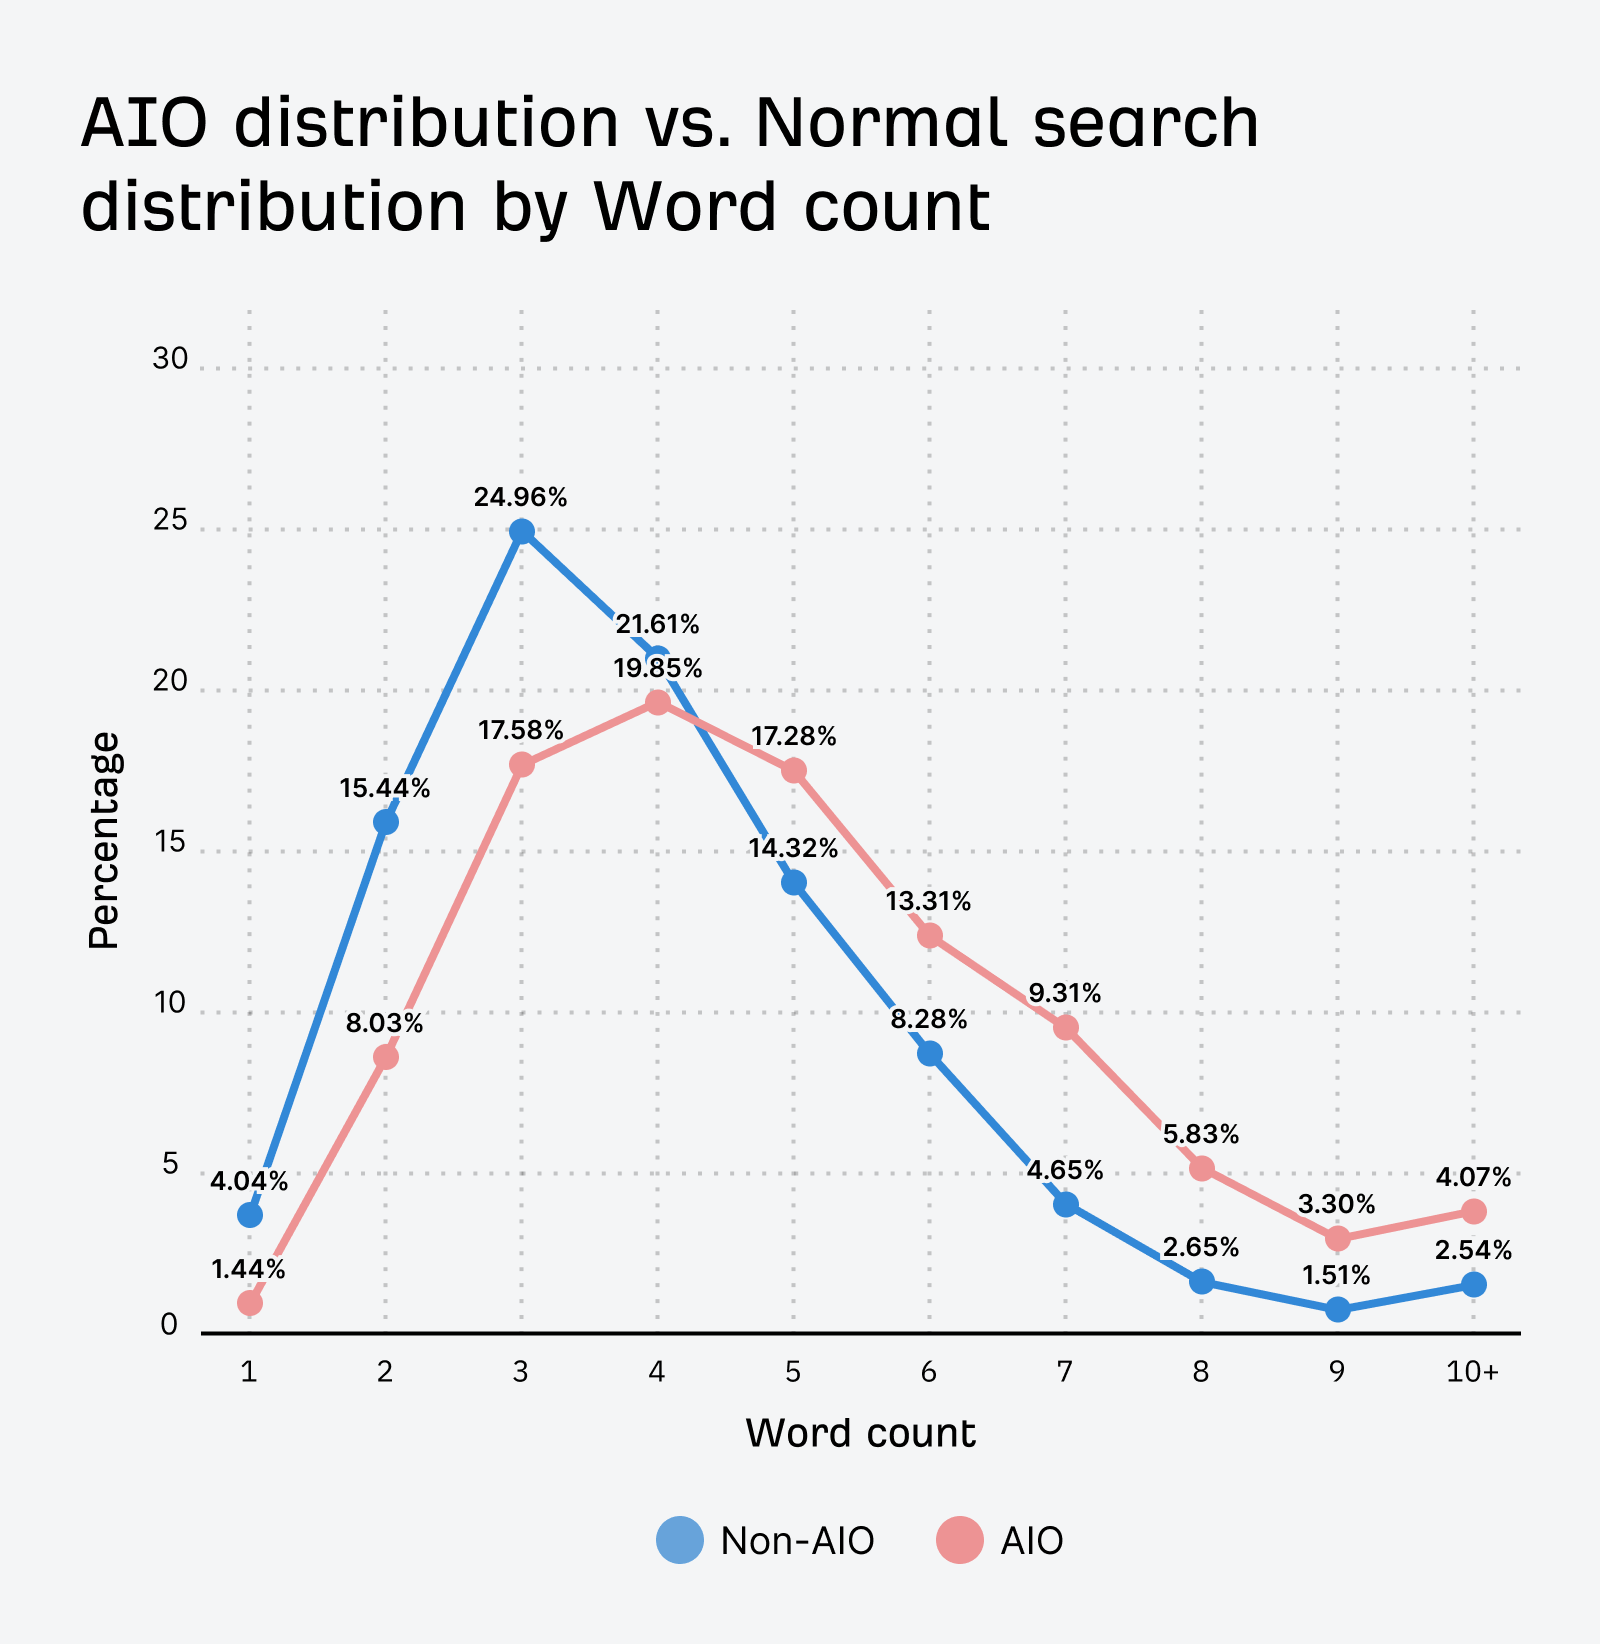
Filtering Keywords Explorer to SERPs with AIOs and filtering by word count tells an interesting story. AIOs have a greater representation when looking at longer search queries.
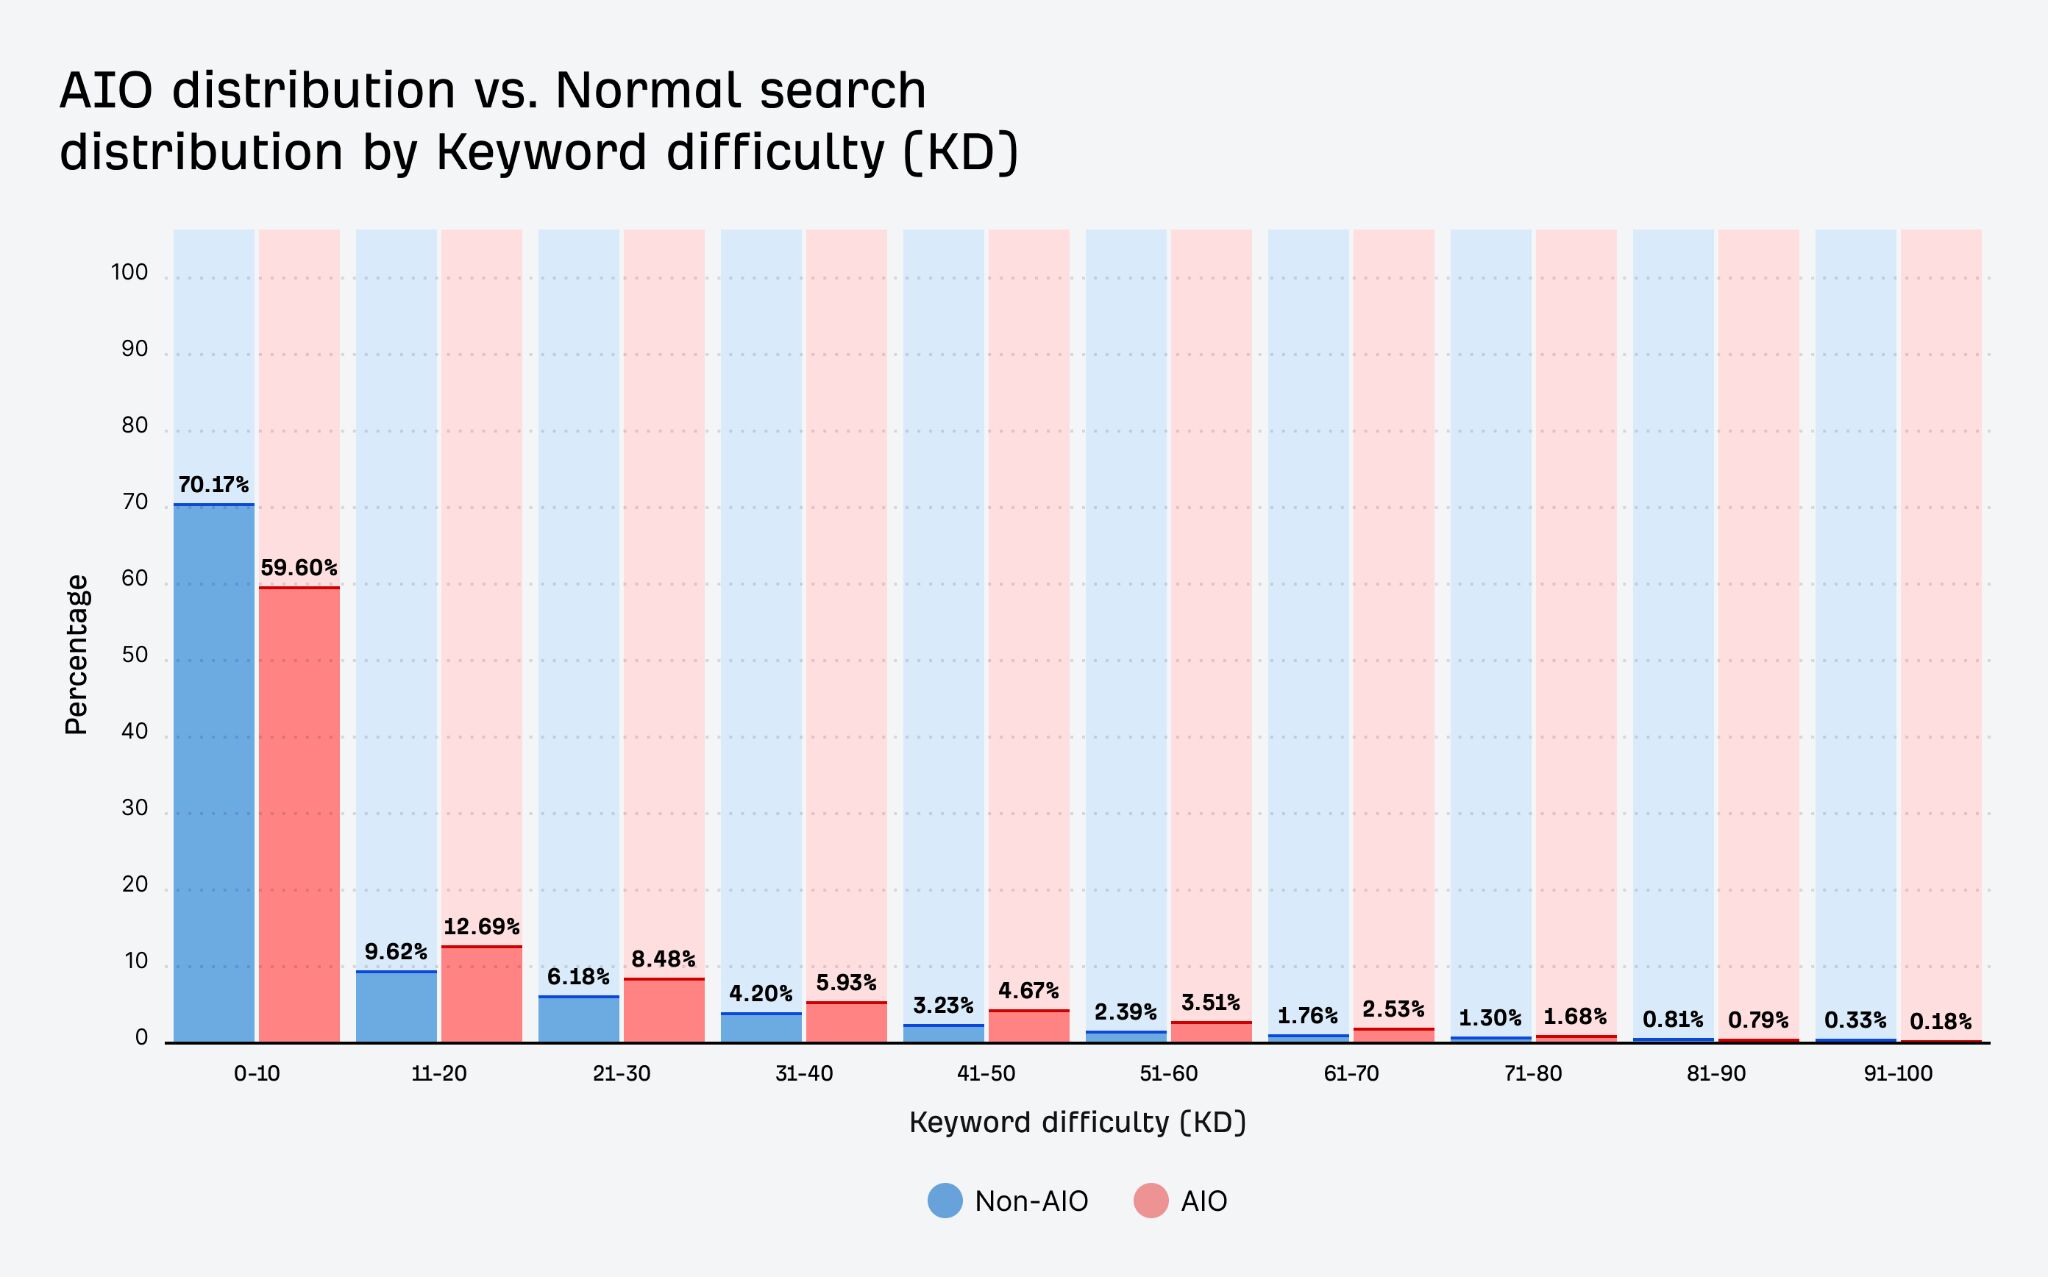
I filtered Keywords Explorer to SERPs with AIOs and filtered by Keyword Difficulty (KD). It looks like AIOs are most likely to show on lower KD terms, but that’s pretty normal in the dataset.
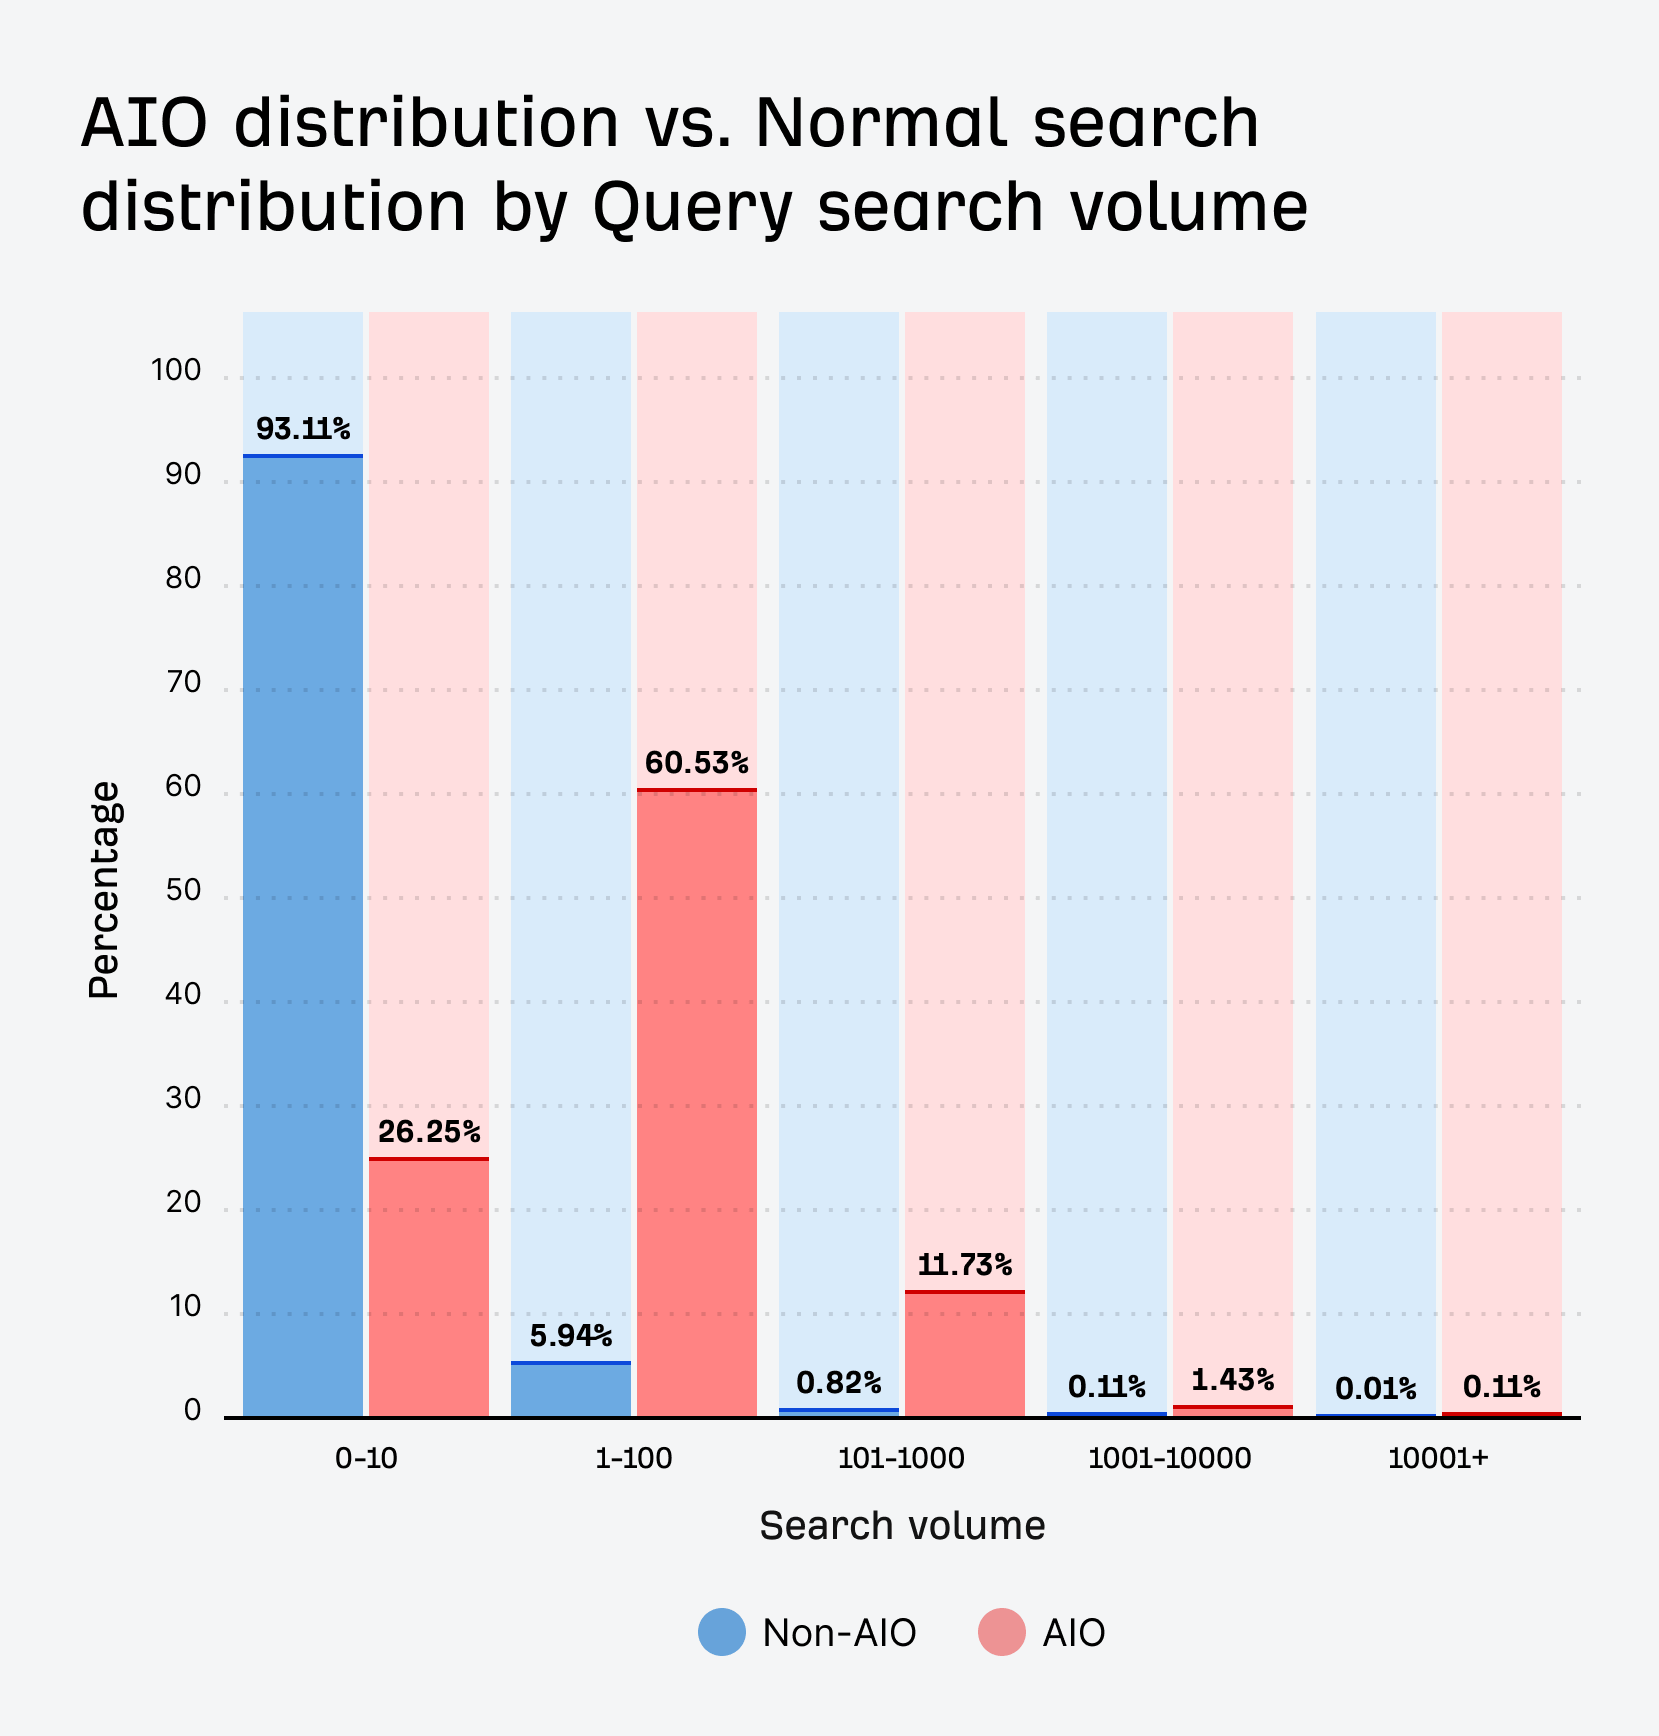
I filtered Keywords Explorer to SERPs with AIOs and filtered by Search Volume. This one shocked me. I was expecting AIOs to be over-represented in lower volume queries.
I see AIOs often when I’m searching long-tail queries, especially ones that I think are pretty unique queries. This wasn’t reflected in the data, however it may be biased as we don’t include many of the queries like I described in our search traffic index.
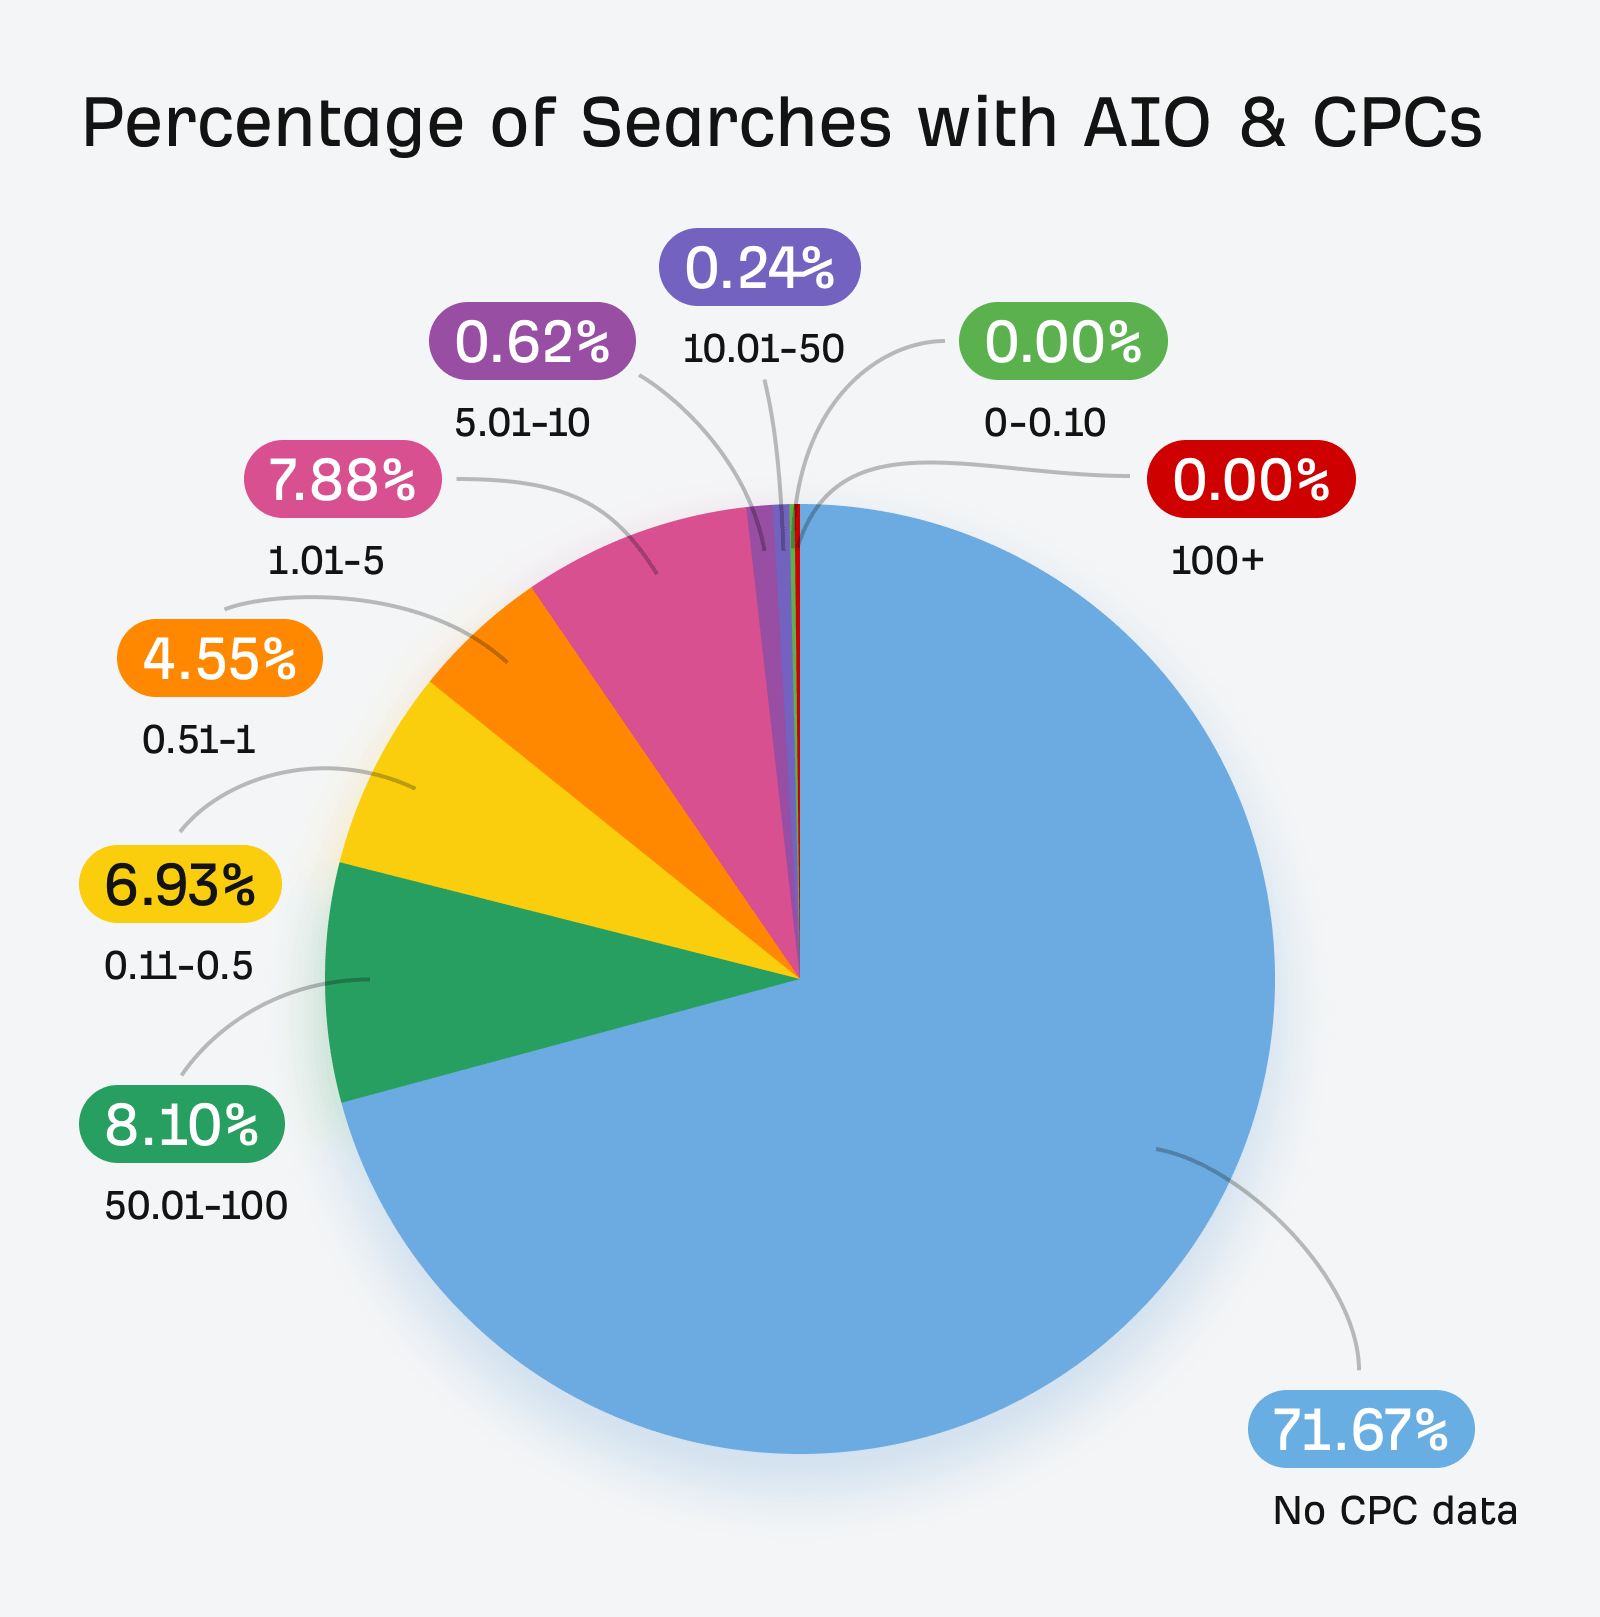
Filtering Keywords Explorer to SERPs with AIOs and filtering by Cost-Per-Click (CPC), or the cost of an ad click, shows a slight bias for lower CPC terms.
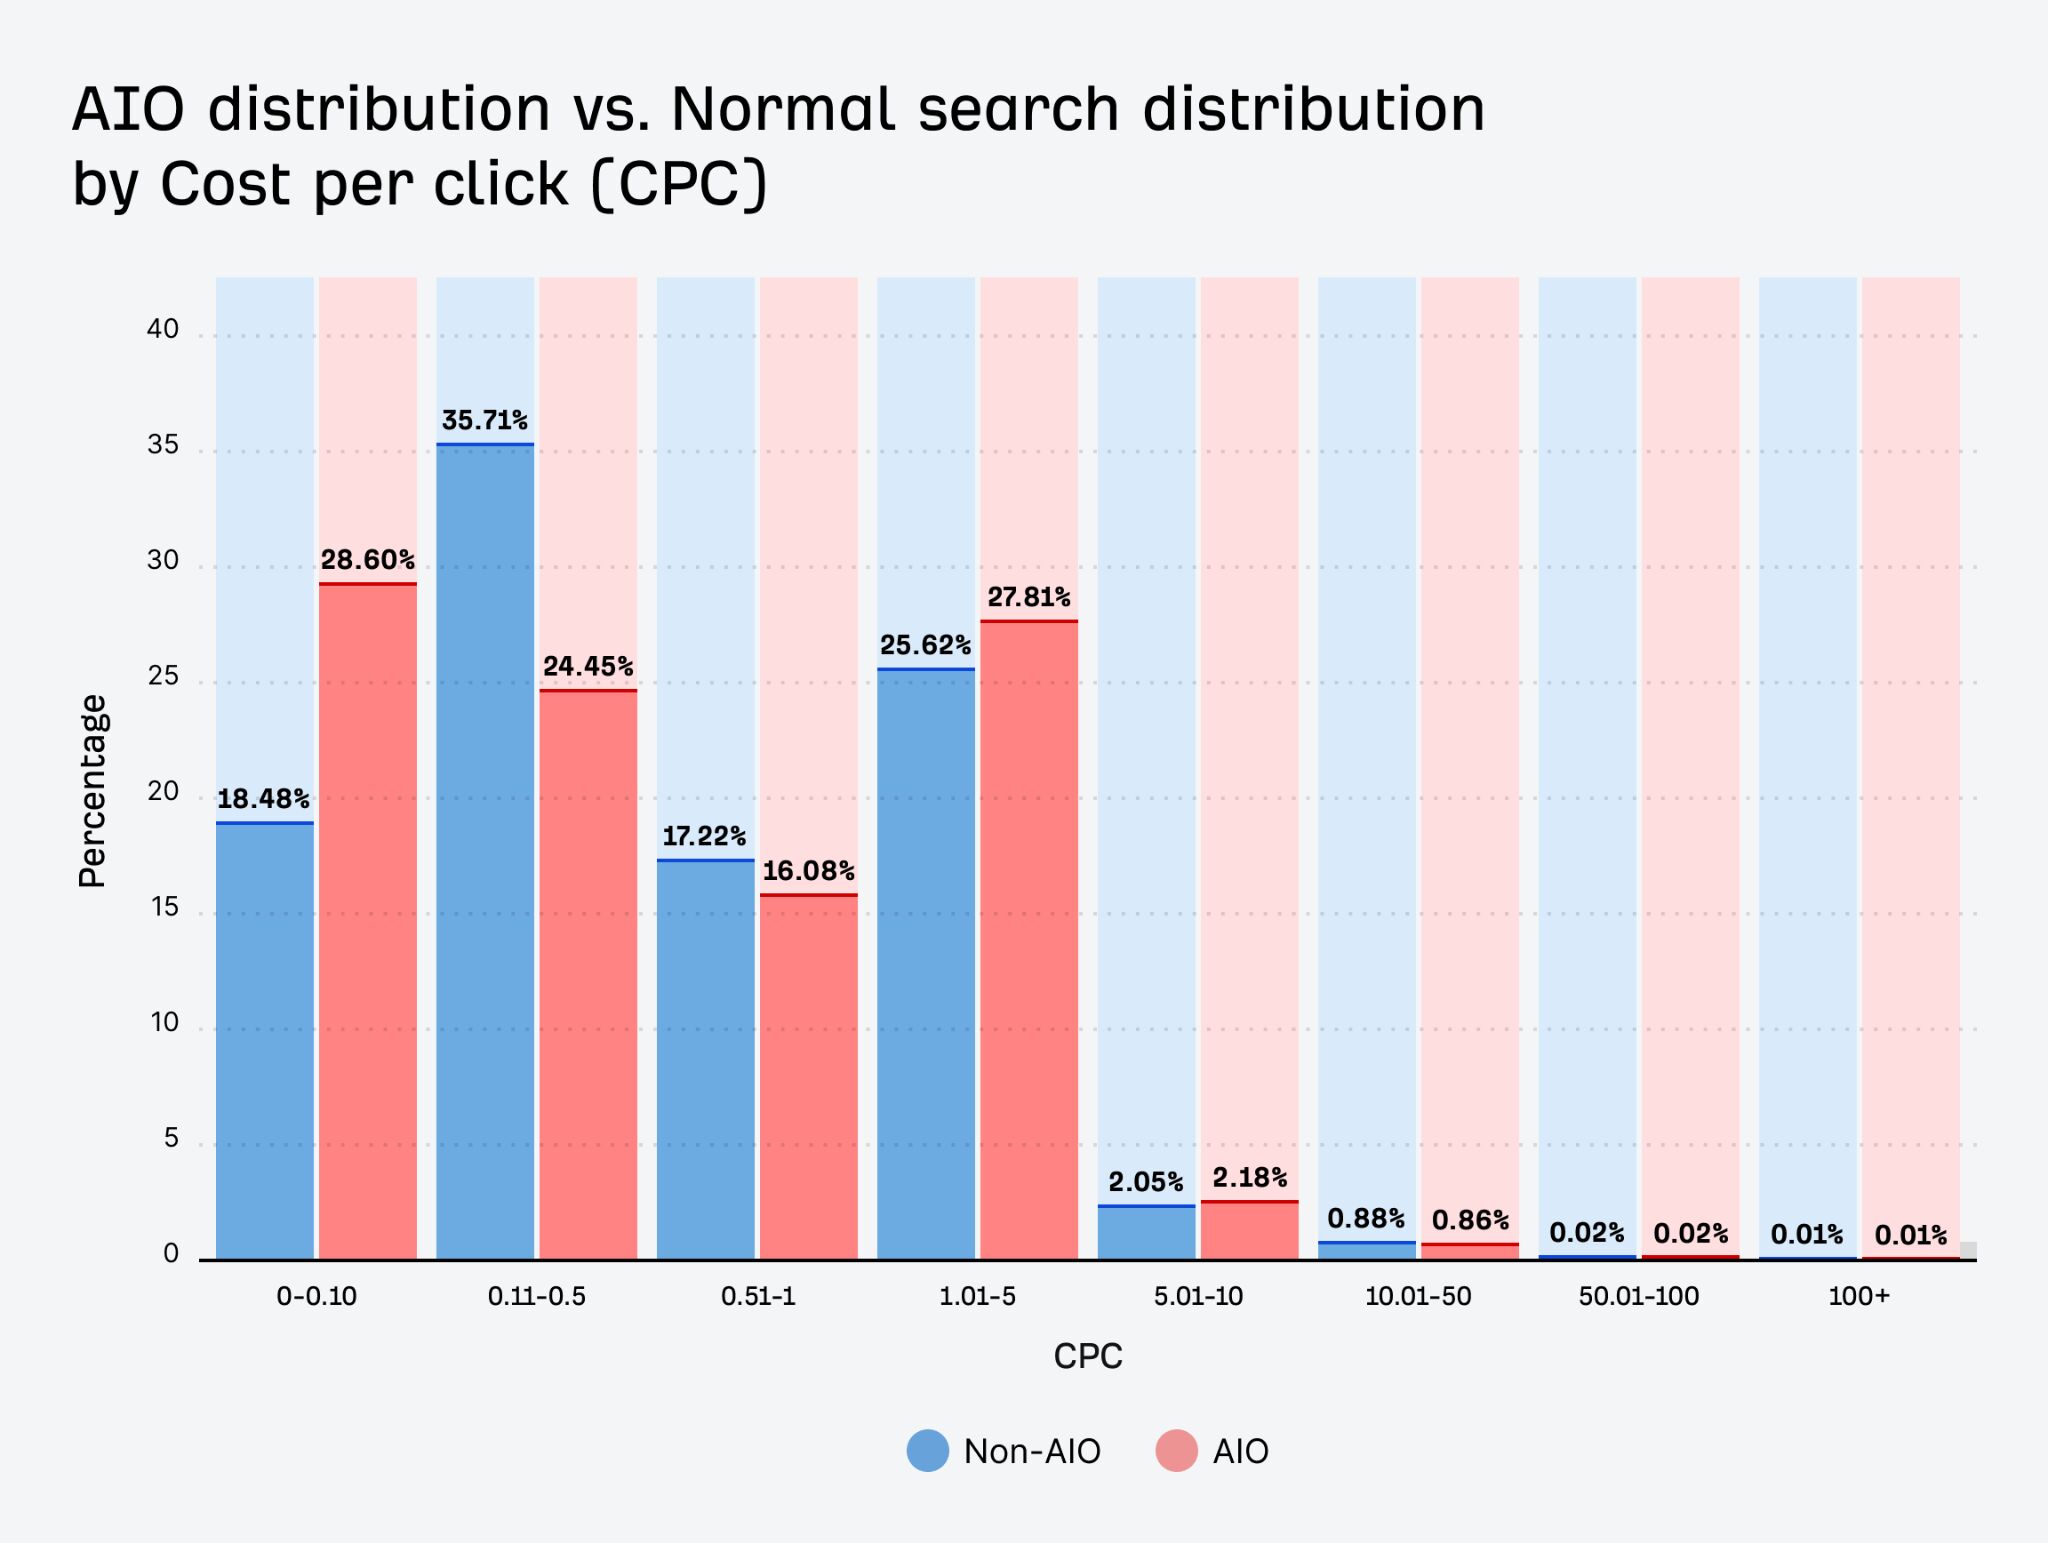
What’s more interesting is that 71.67% of the searches with AIOs had no CPC data. This indicates a majority of the AIO searches weren’t monetized at all. It’s no wonder no one has seen ads in AIOs yet. They aren’t showing for the majority of the terms that make Google money.
One of the unique things about Ahrefs Brand Radar is that we also have web pages as a data source. With this, you can see which brands are mentioned the most online and which have the most visibility. This can help you explain why a competitor might show up more than you do for AIOs or other LLMs.
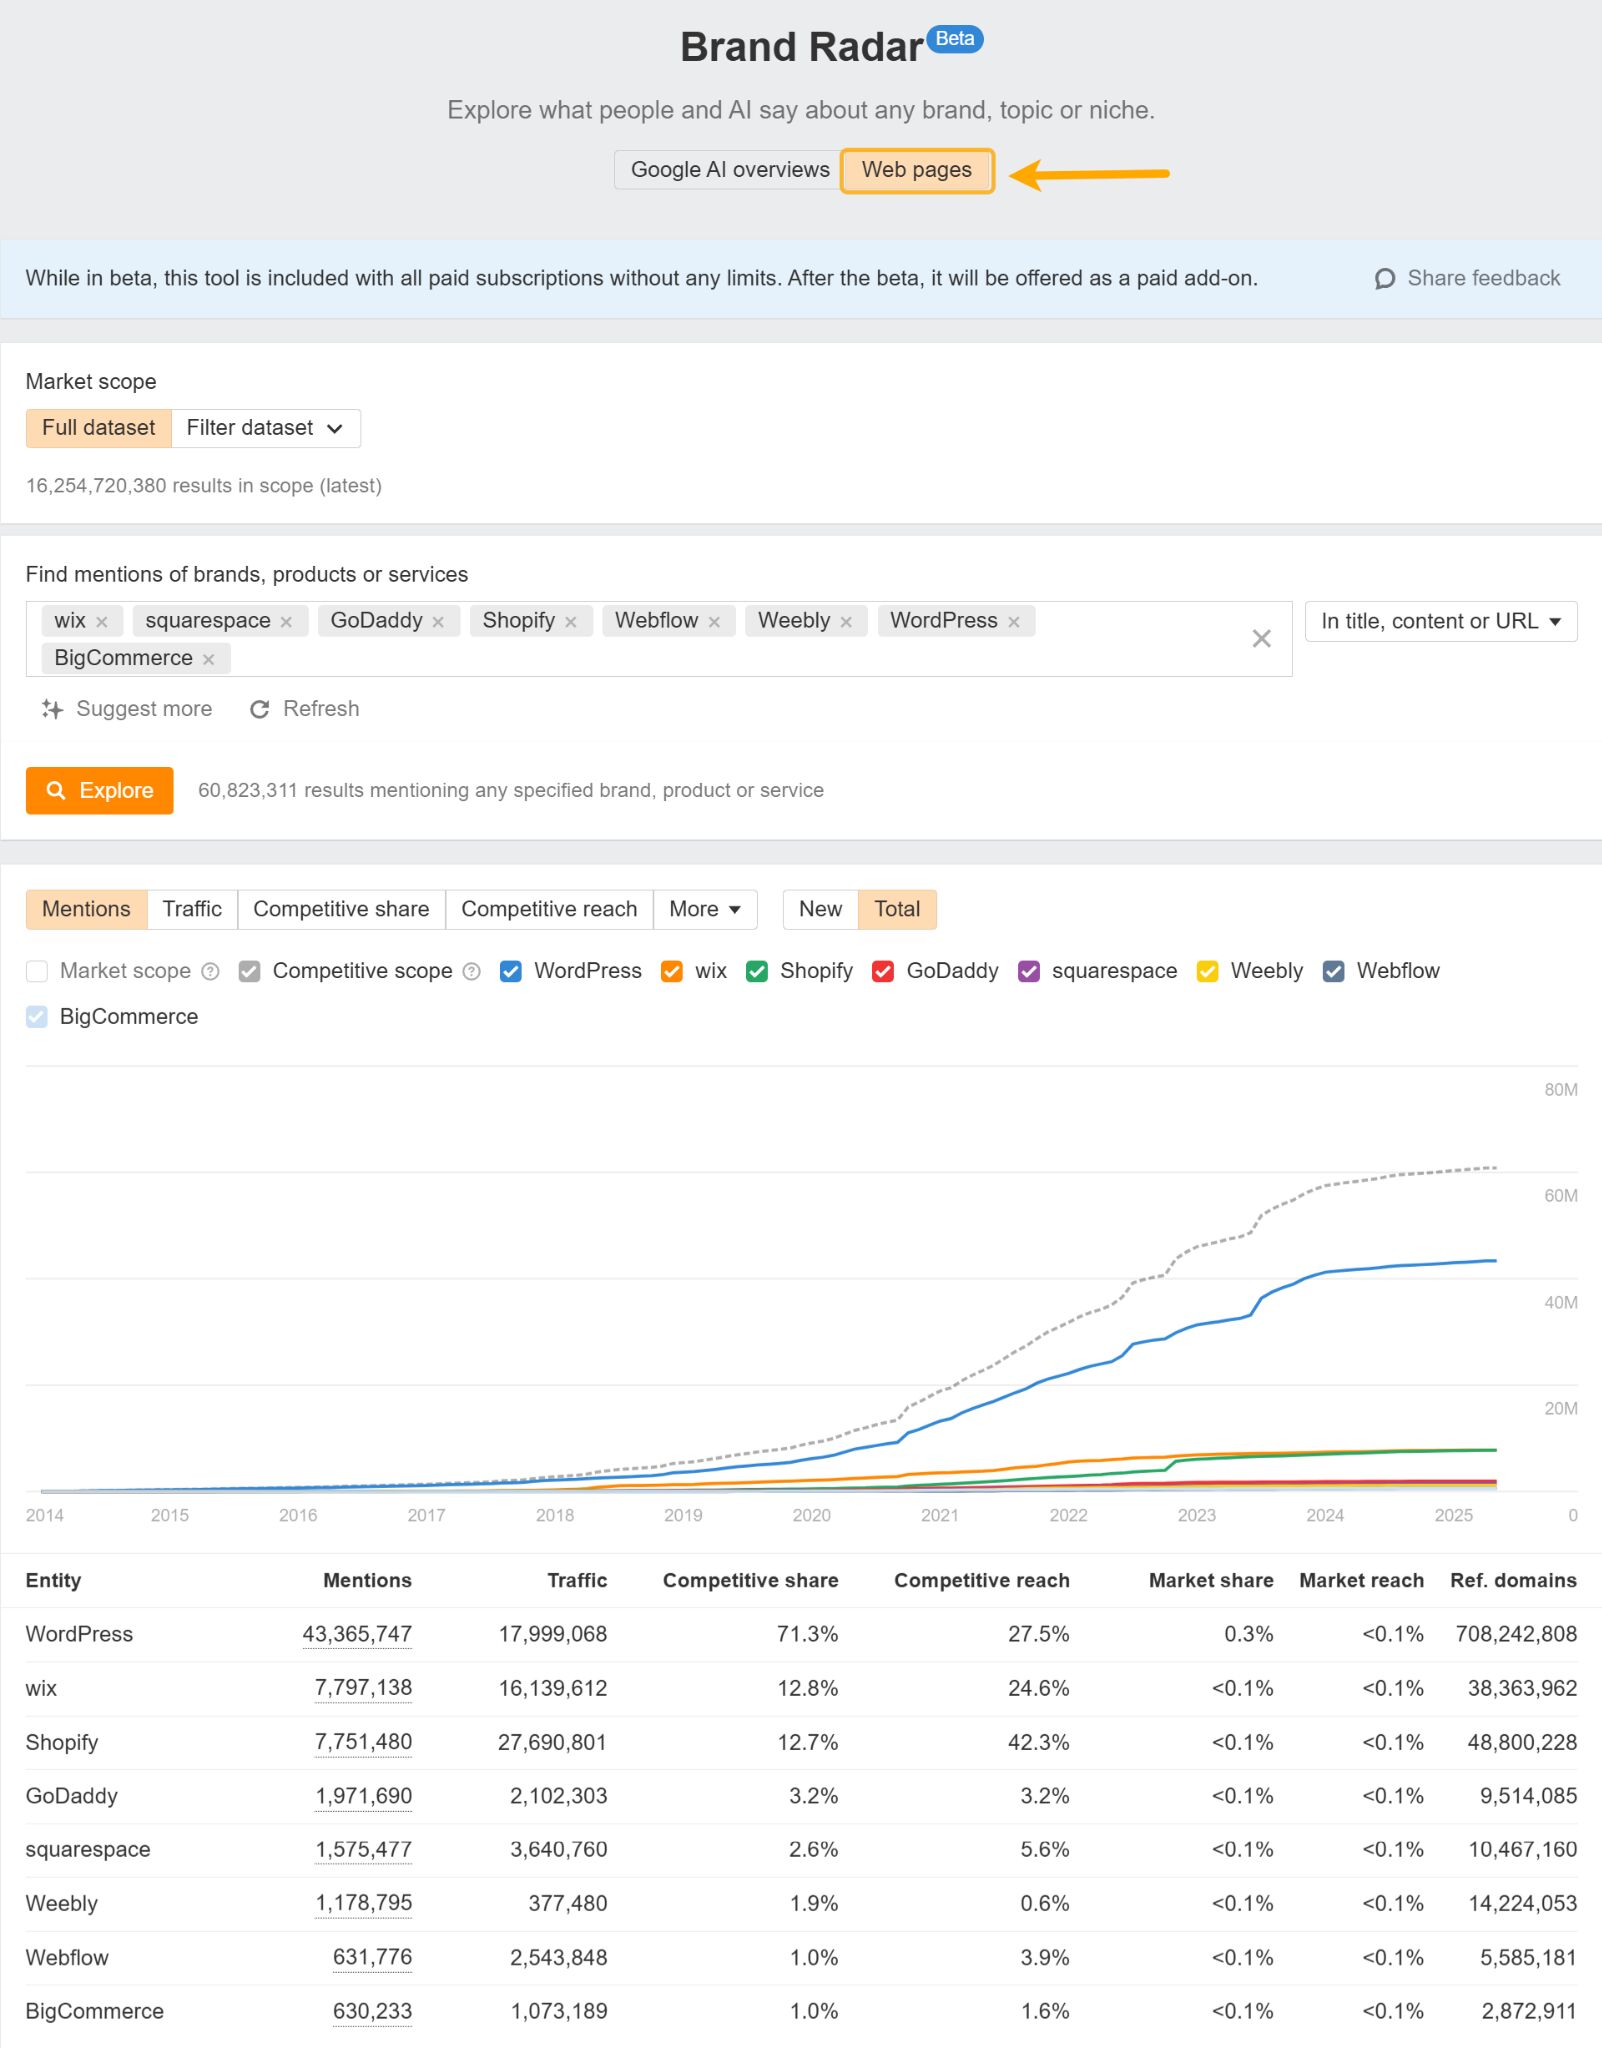
LLMs work as next word predictors with a bit of variability built in. If you’re mentioned more in the training data such as web pages, you’re going to be mentioned more in the outputs of LLMs.
Final thoughts
Don’t wait for the next big study if you need to report what is happening with AIOs. You can run the data yourself with Ahrefs at any time with Brand Radar and Keywords Explorer.
If you have questions, message me on X or LinkedIn.