So, to clear up the confusion, I’ll show you the key metrics that really matter, explain how to make sense of them, and show you how to do it all with one free, privacy-friendly tool that’s ready for the AI age.
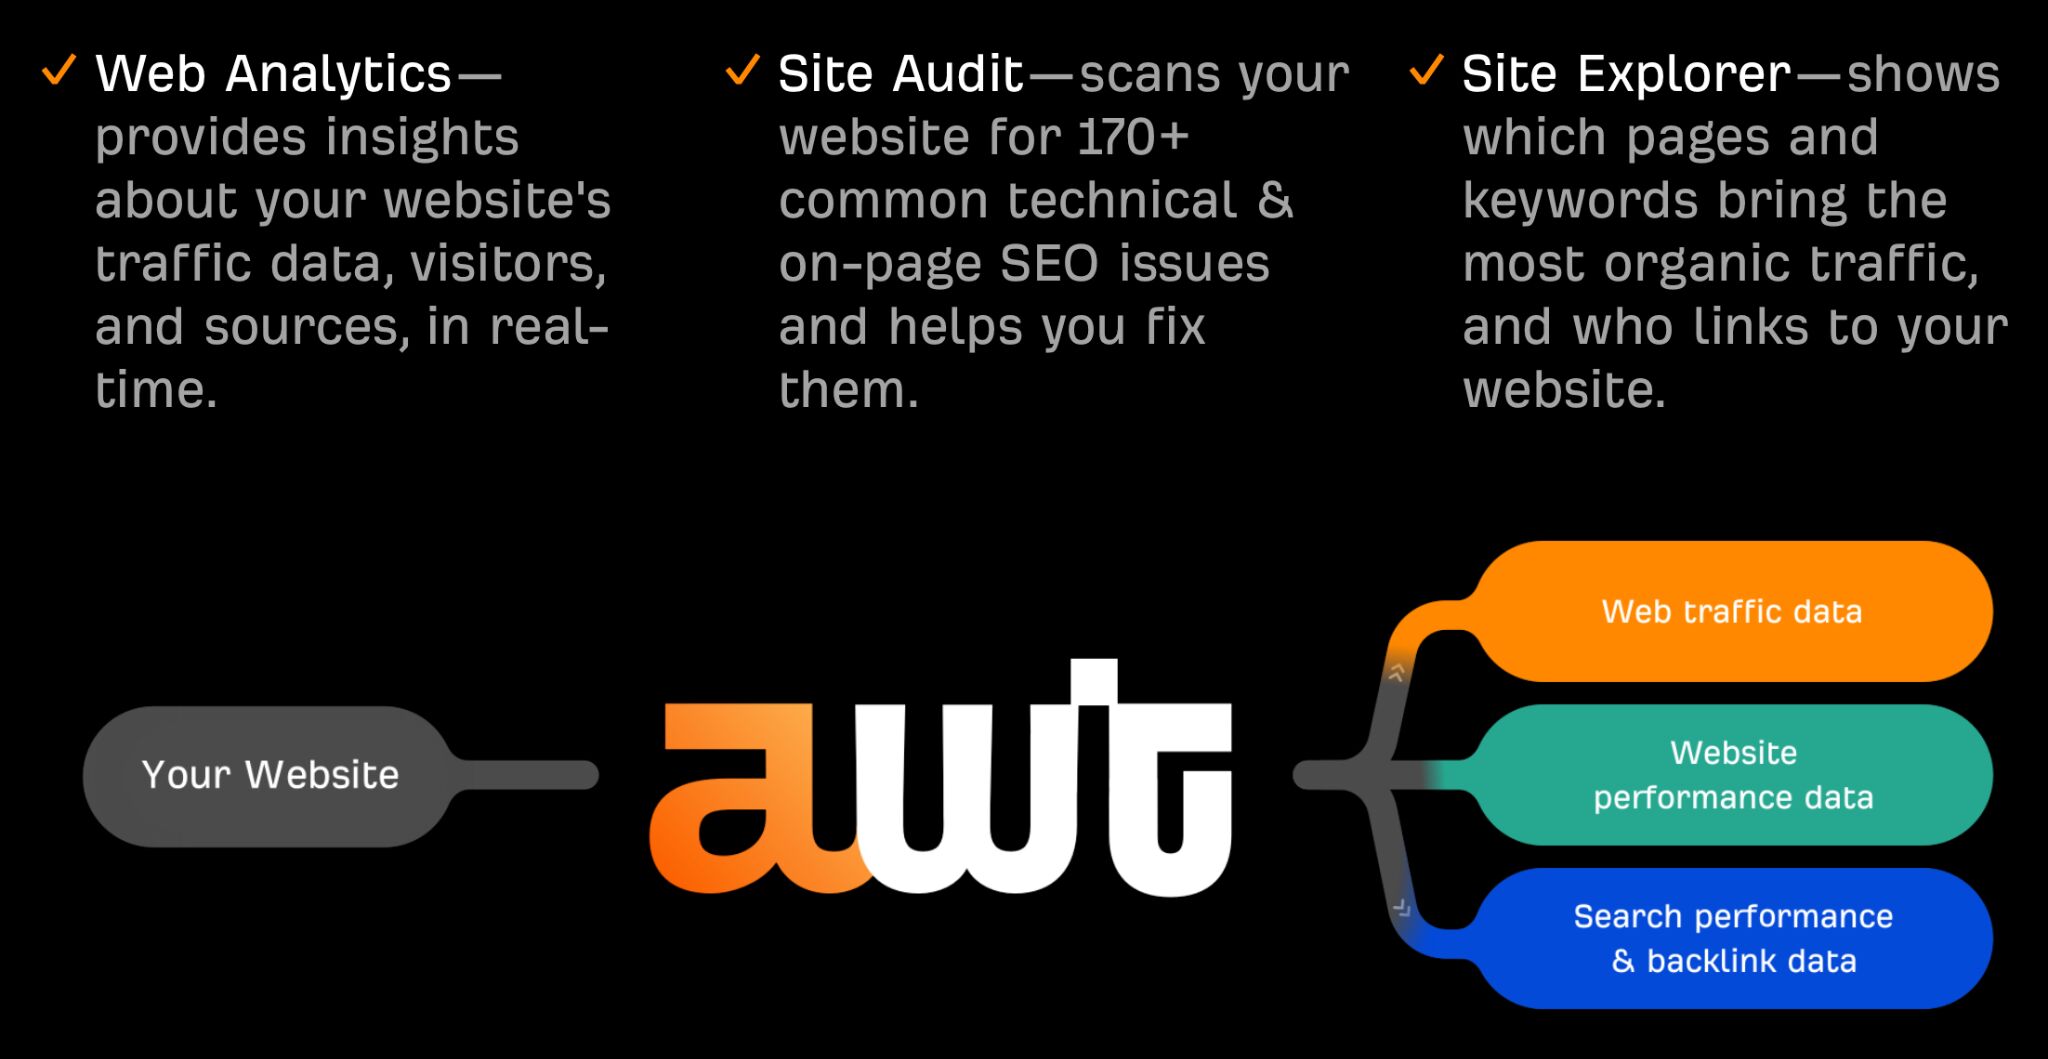
Throughout this article, I’ll be using Ahrefs Webmaster Tools suite. It includes three tools: Web Analytics to track traffic and site performance, Site Explorer to see how your site is doing in search, and Site Audit to check for technical SEO issues.
I’ll also suggest some other tools you can use if you’re looking for different features or have specific needs.
Traffic metrics answer the fundamental question: “How many people are visiting my website, and where are they coming from?”.
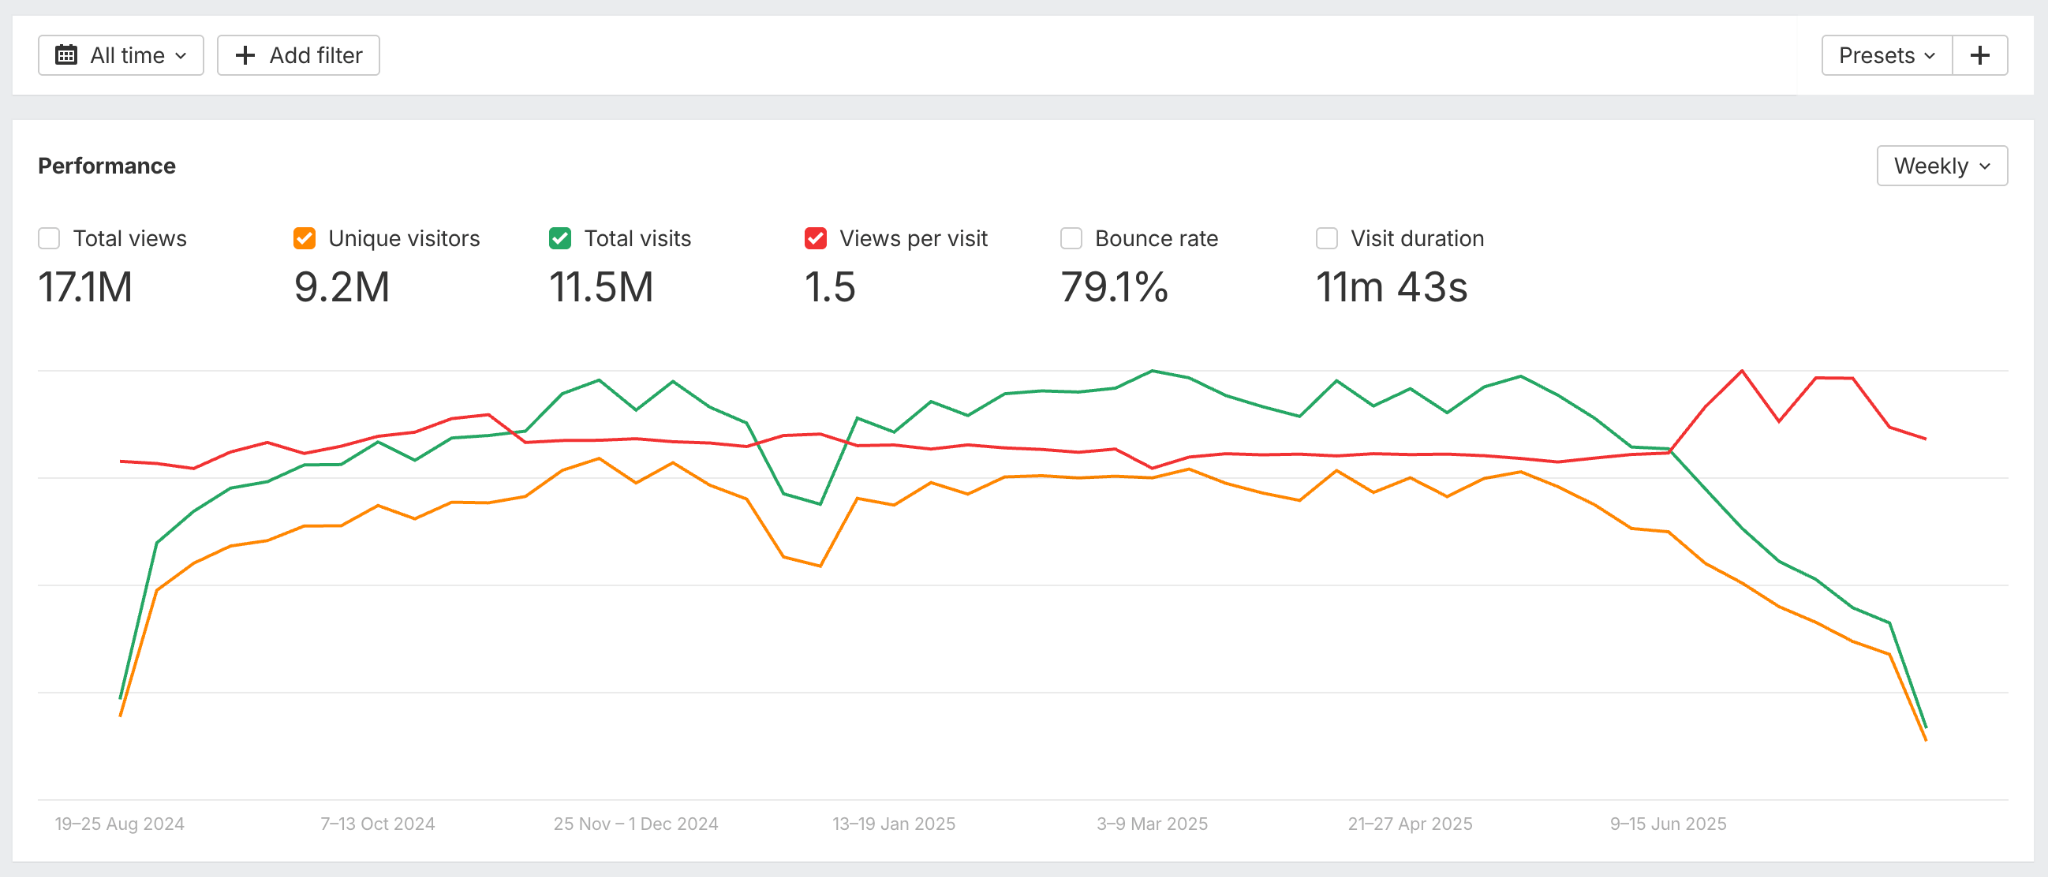
Unique visitors tell you how many individual people are actually visiting your site. This number is more meaningful than total views because it shows your true reach.
Total visits show how many separate times people have used your site. A visit ends if there’s no activity for 30 minutes. So, one person can visit your site five times—counting as five visits—but still only be one unique visitor.
Views per visit reveal whether people are sticking around to explore. If someone lands on your blog post and immediately clicks to read three more articles, that’s a great sign that your content is engaging and well-connected.
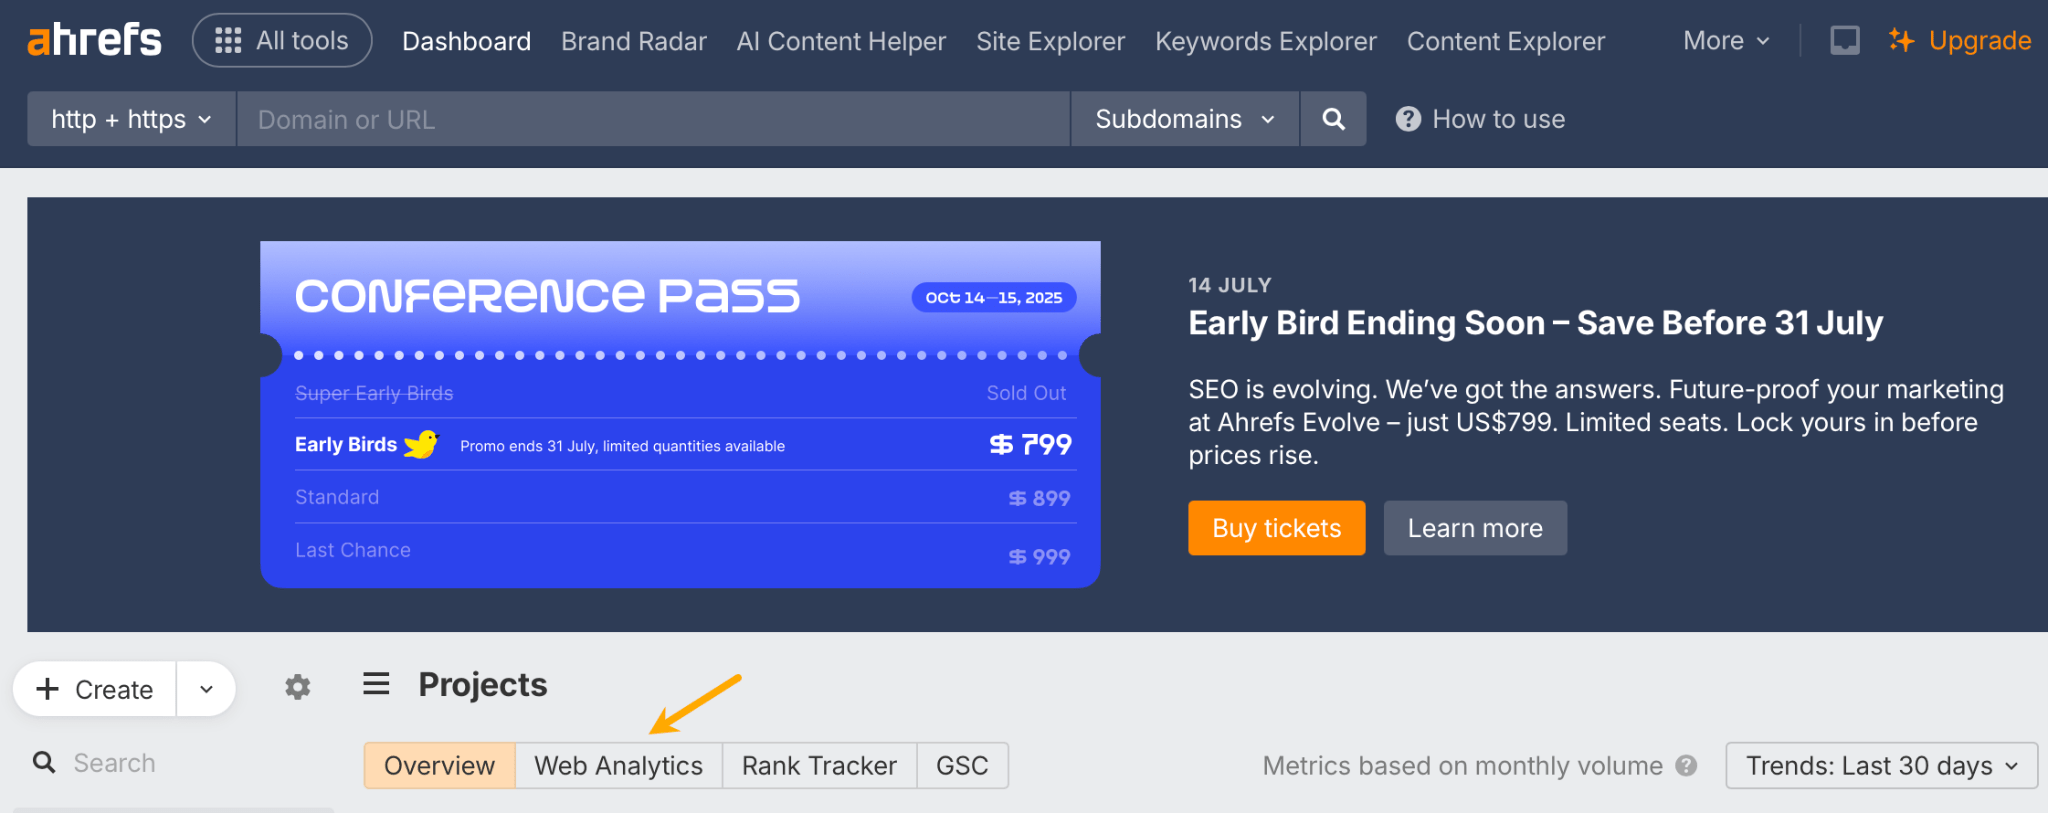
When you open the Web Analytics Tool in Ahrefs Webmaster Tools (AWT), you’ll see these metrics right away.
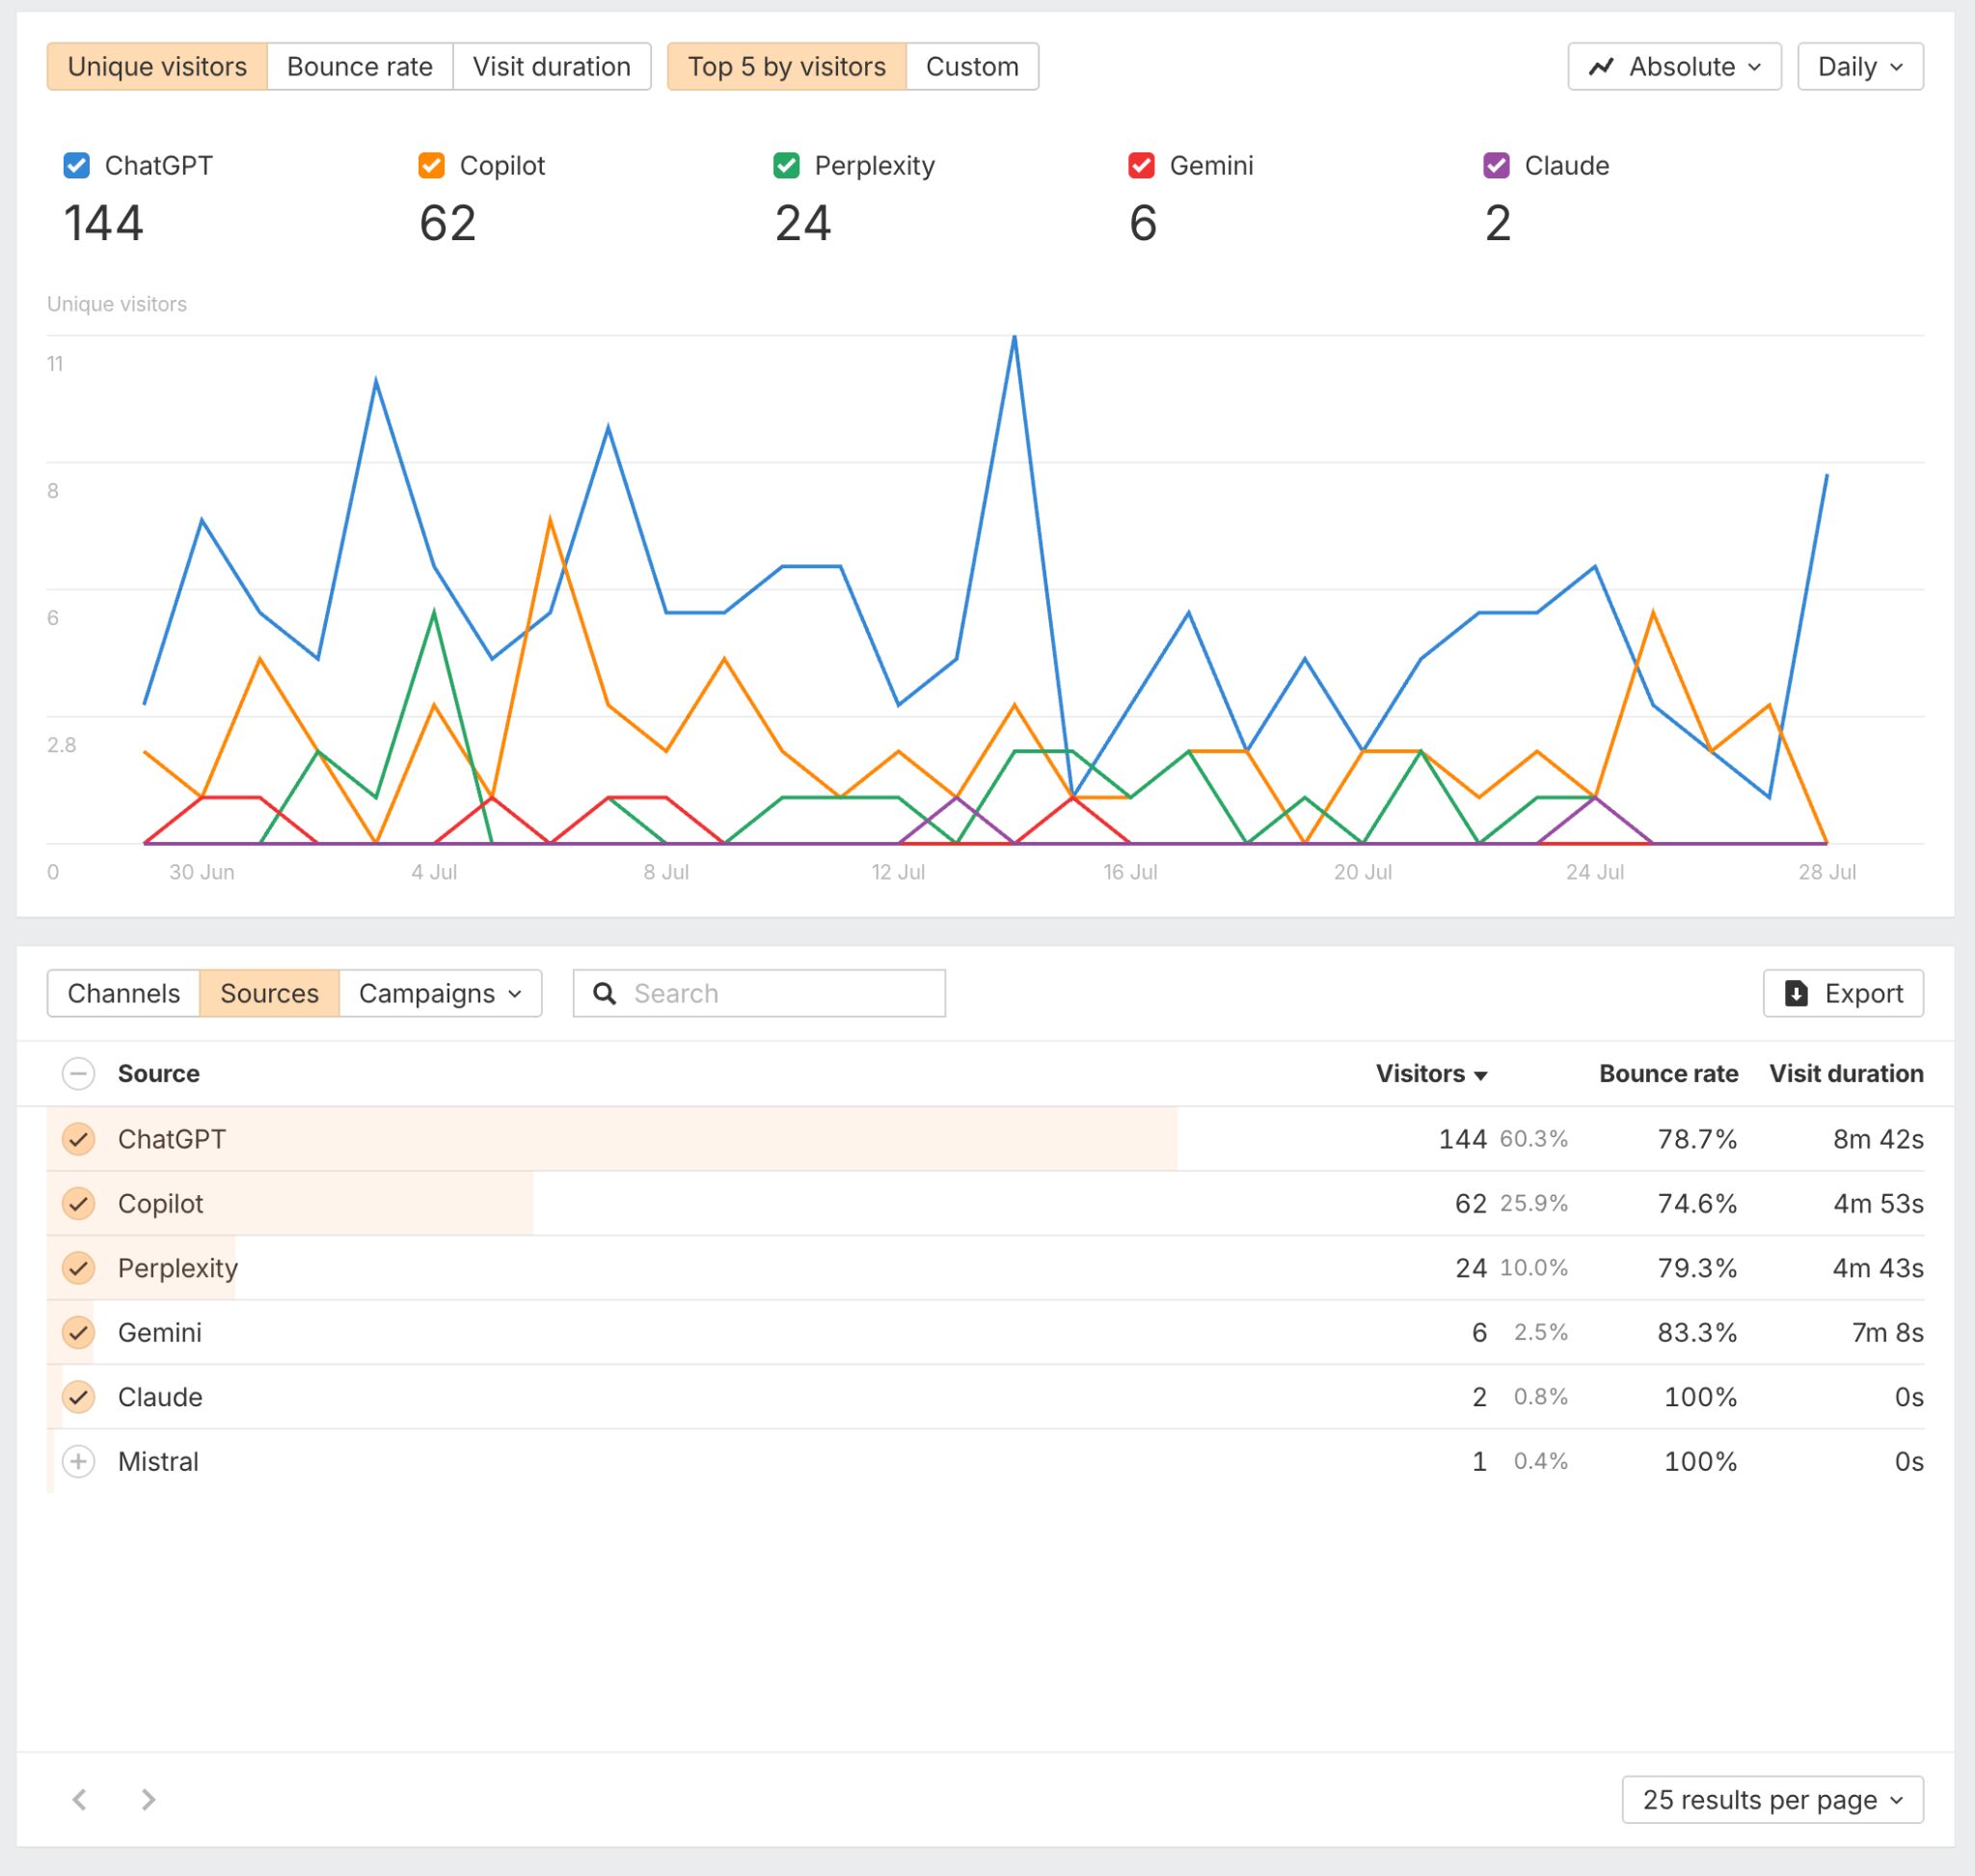
Traffic sources show you exactly where your visitors are coming from. Are they finding you through Google searches? Social media posts? AI assistants?
In AWT, you’ll find traffic sources just below the main performance chart. Clicking on a specific channel gives you a detailed view of all its metrics, along with a list of the individual sources within that channel, like how the AI Search channel includes sources such as ChatGPT, Copilot, and Perplexity.
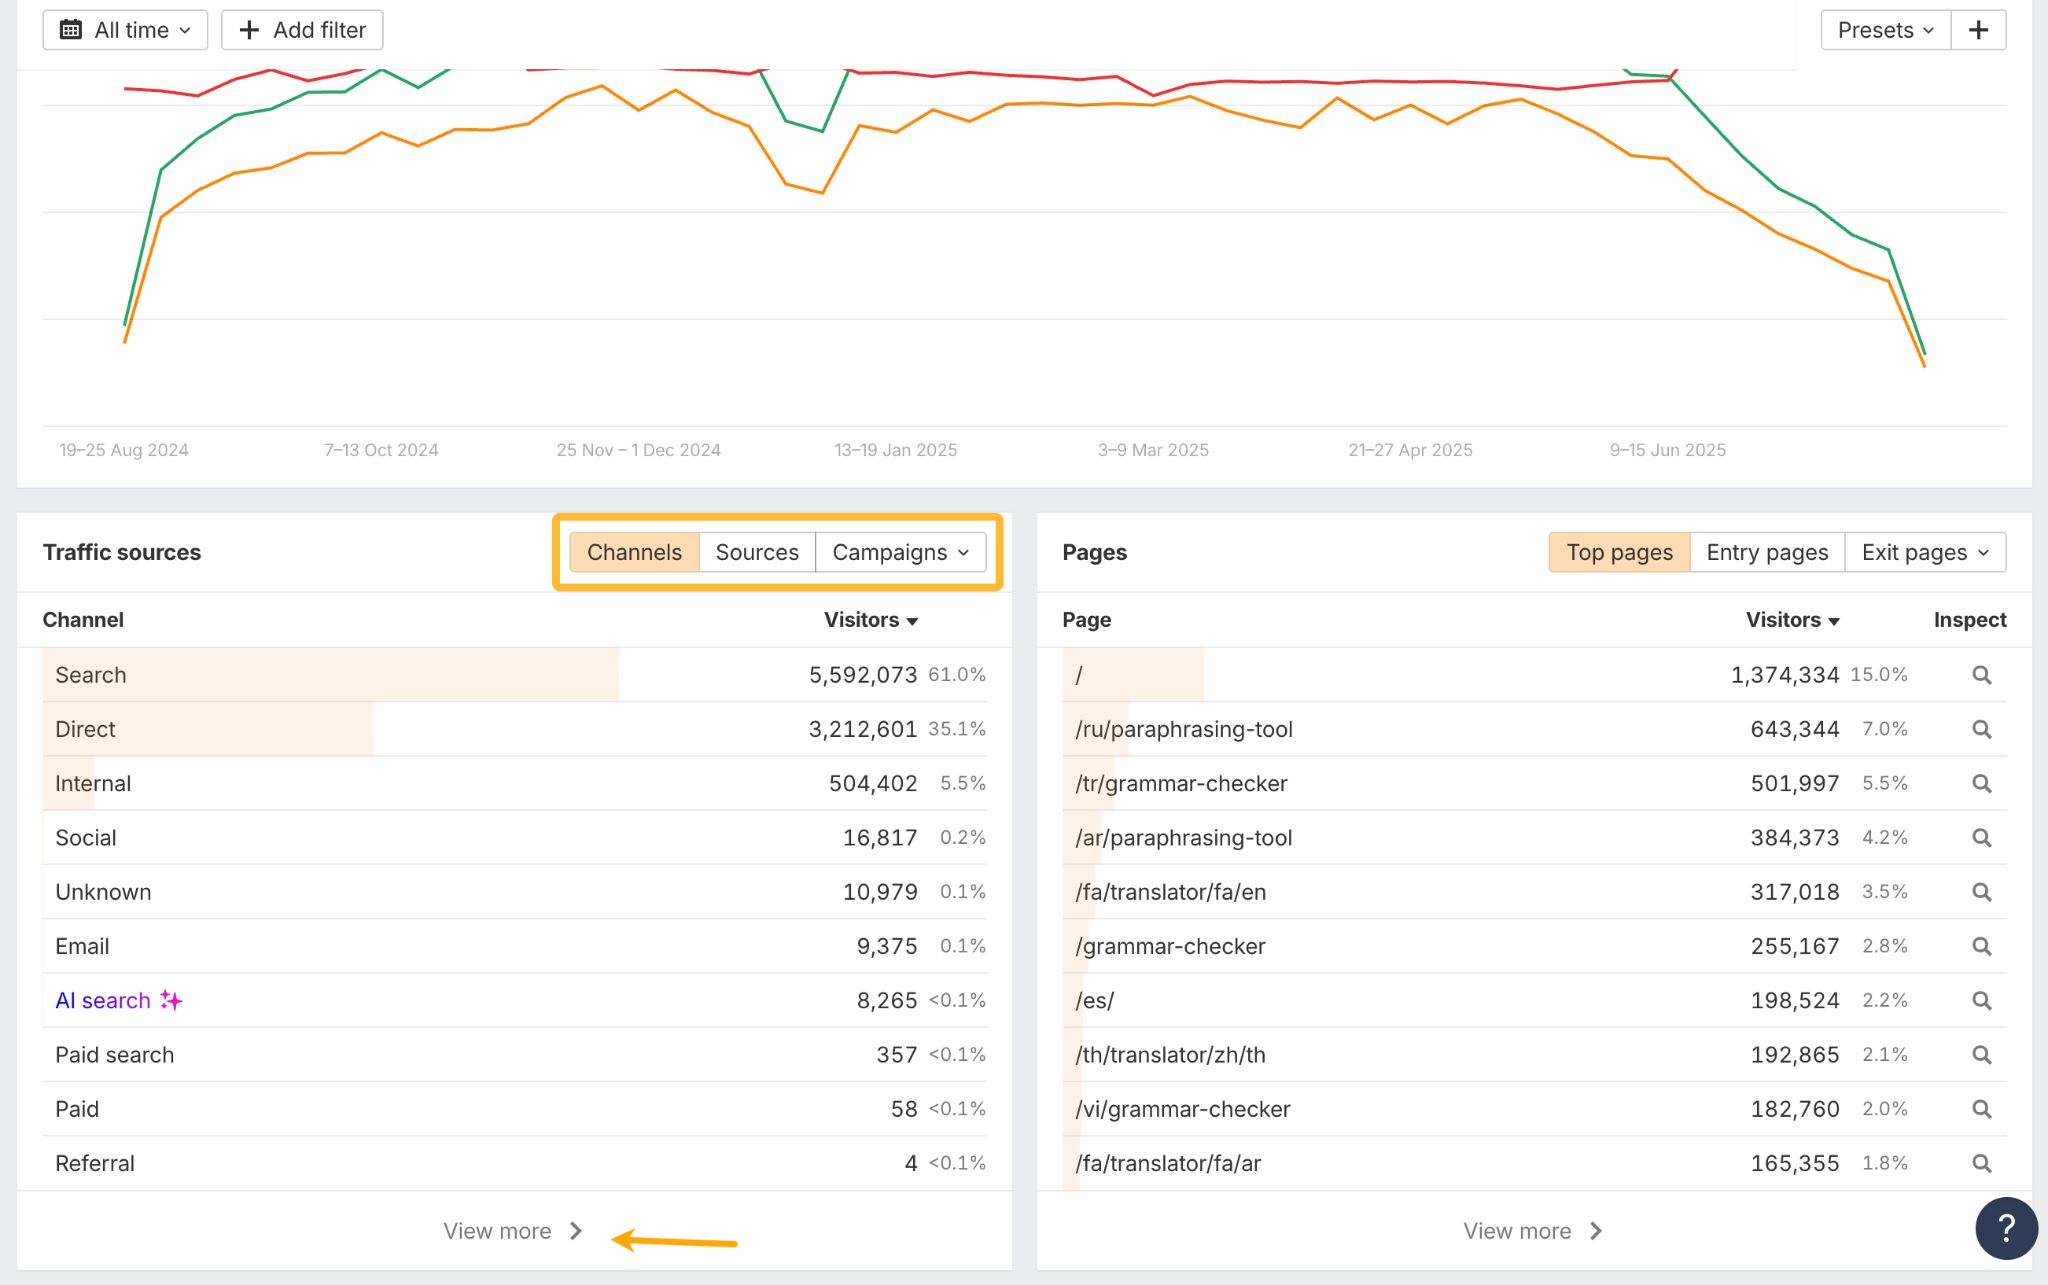
Click the “View more” button below the Channel table to dive deeper into data for a specific channel.
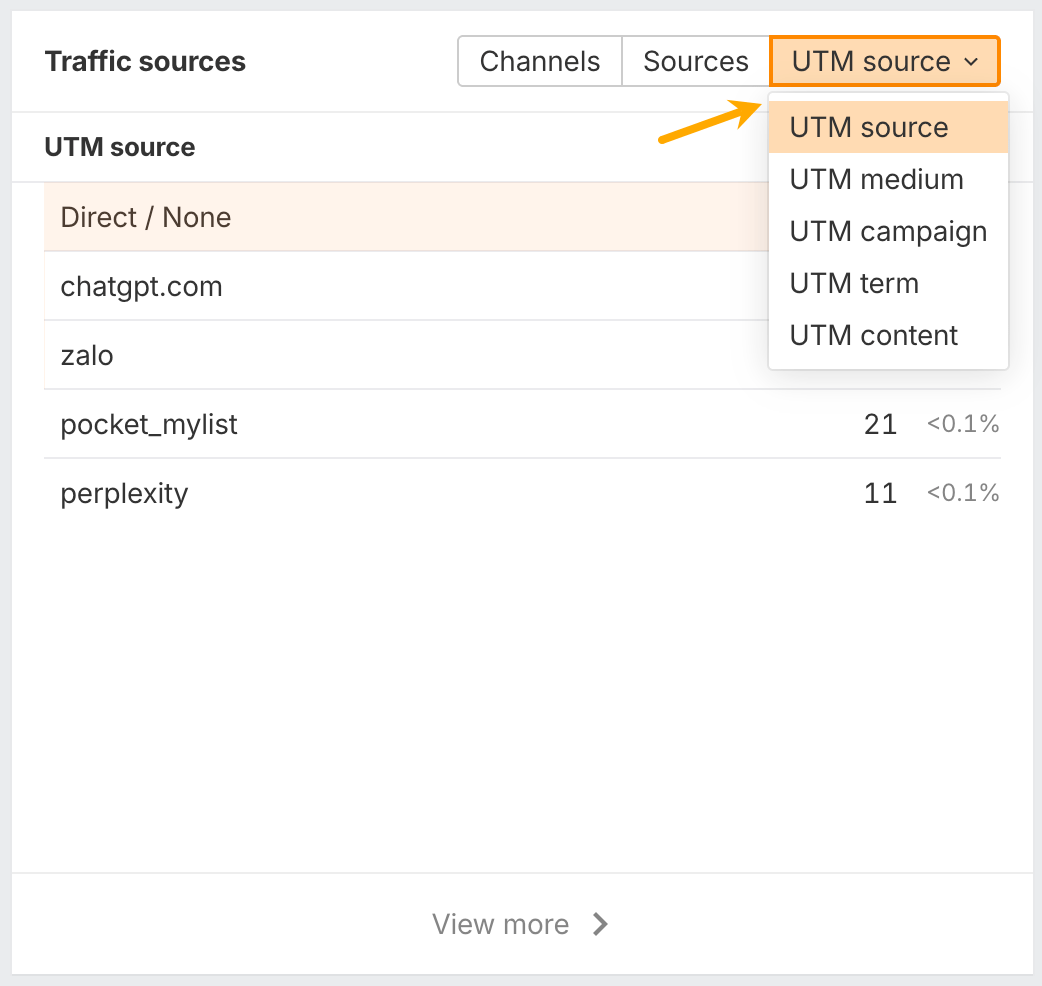
Click the “Campaigns” button in the Sources table to see how your ads, emails, and other campaigns are performing.
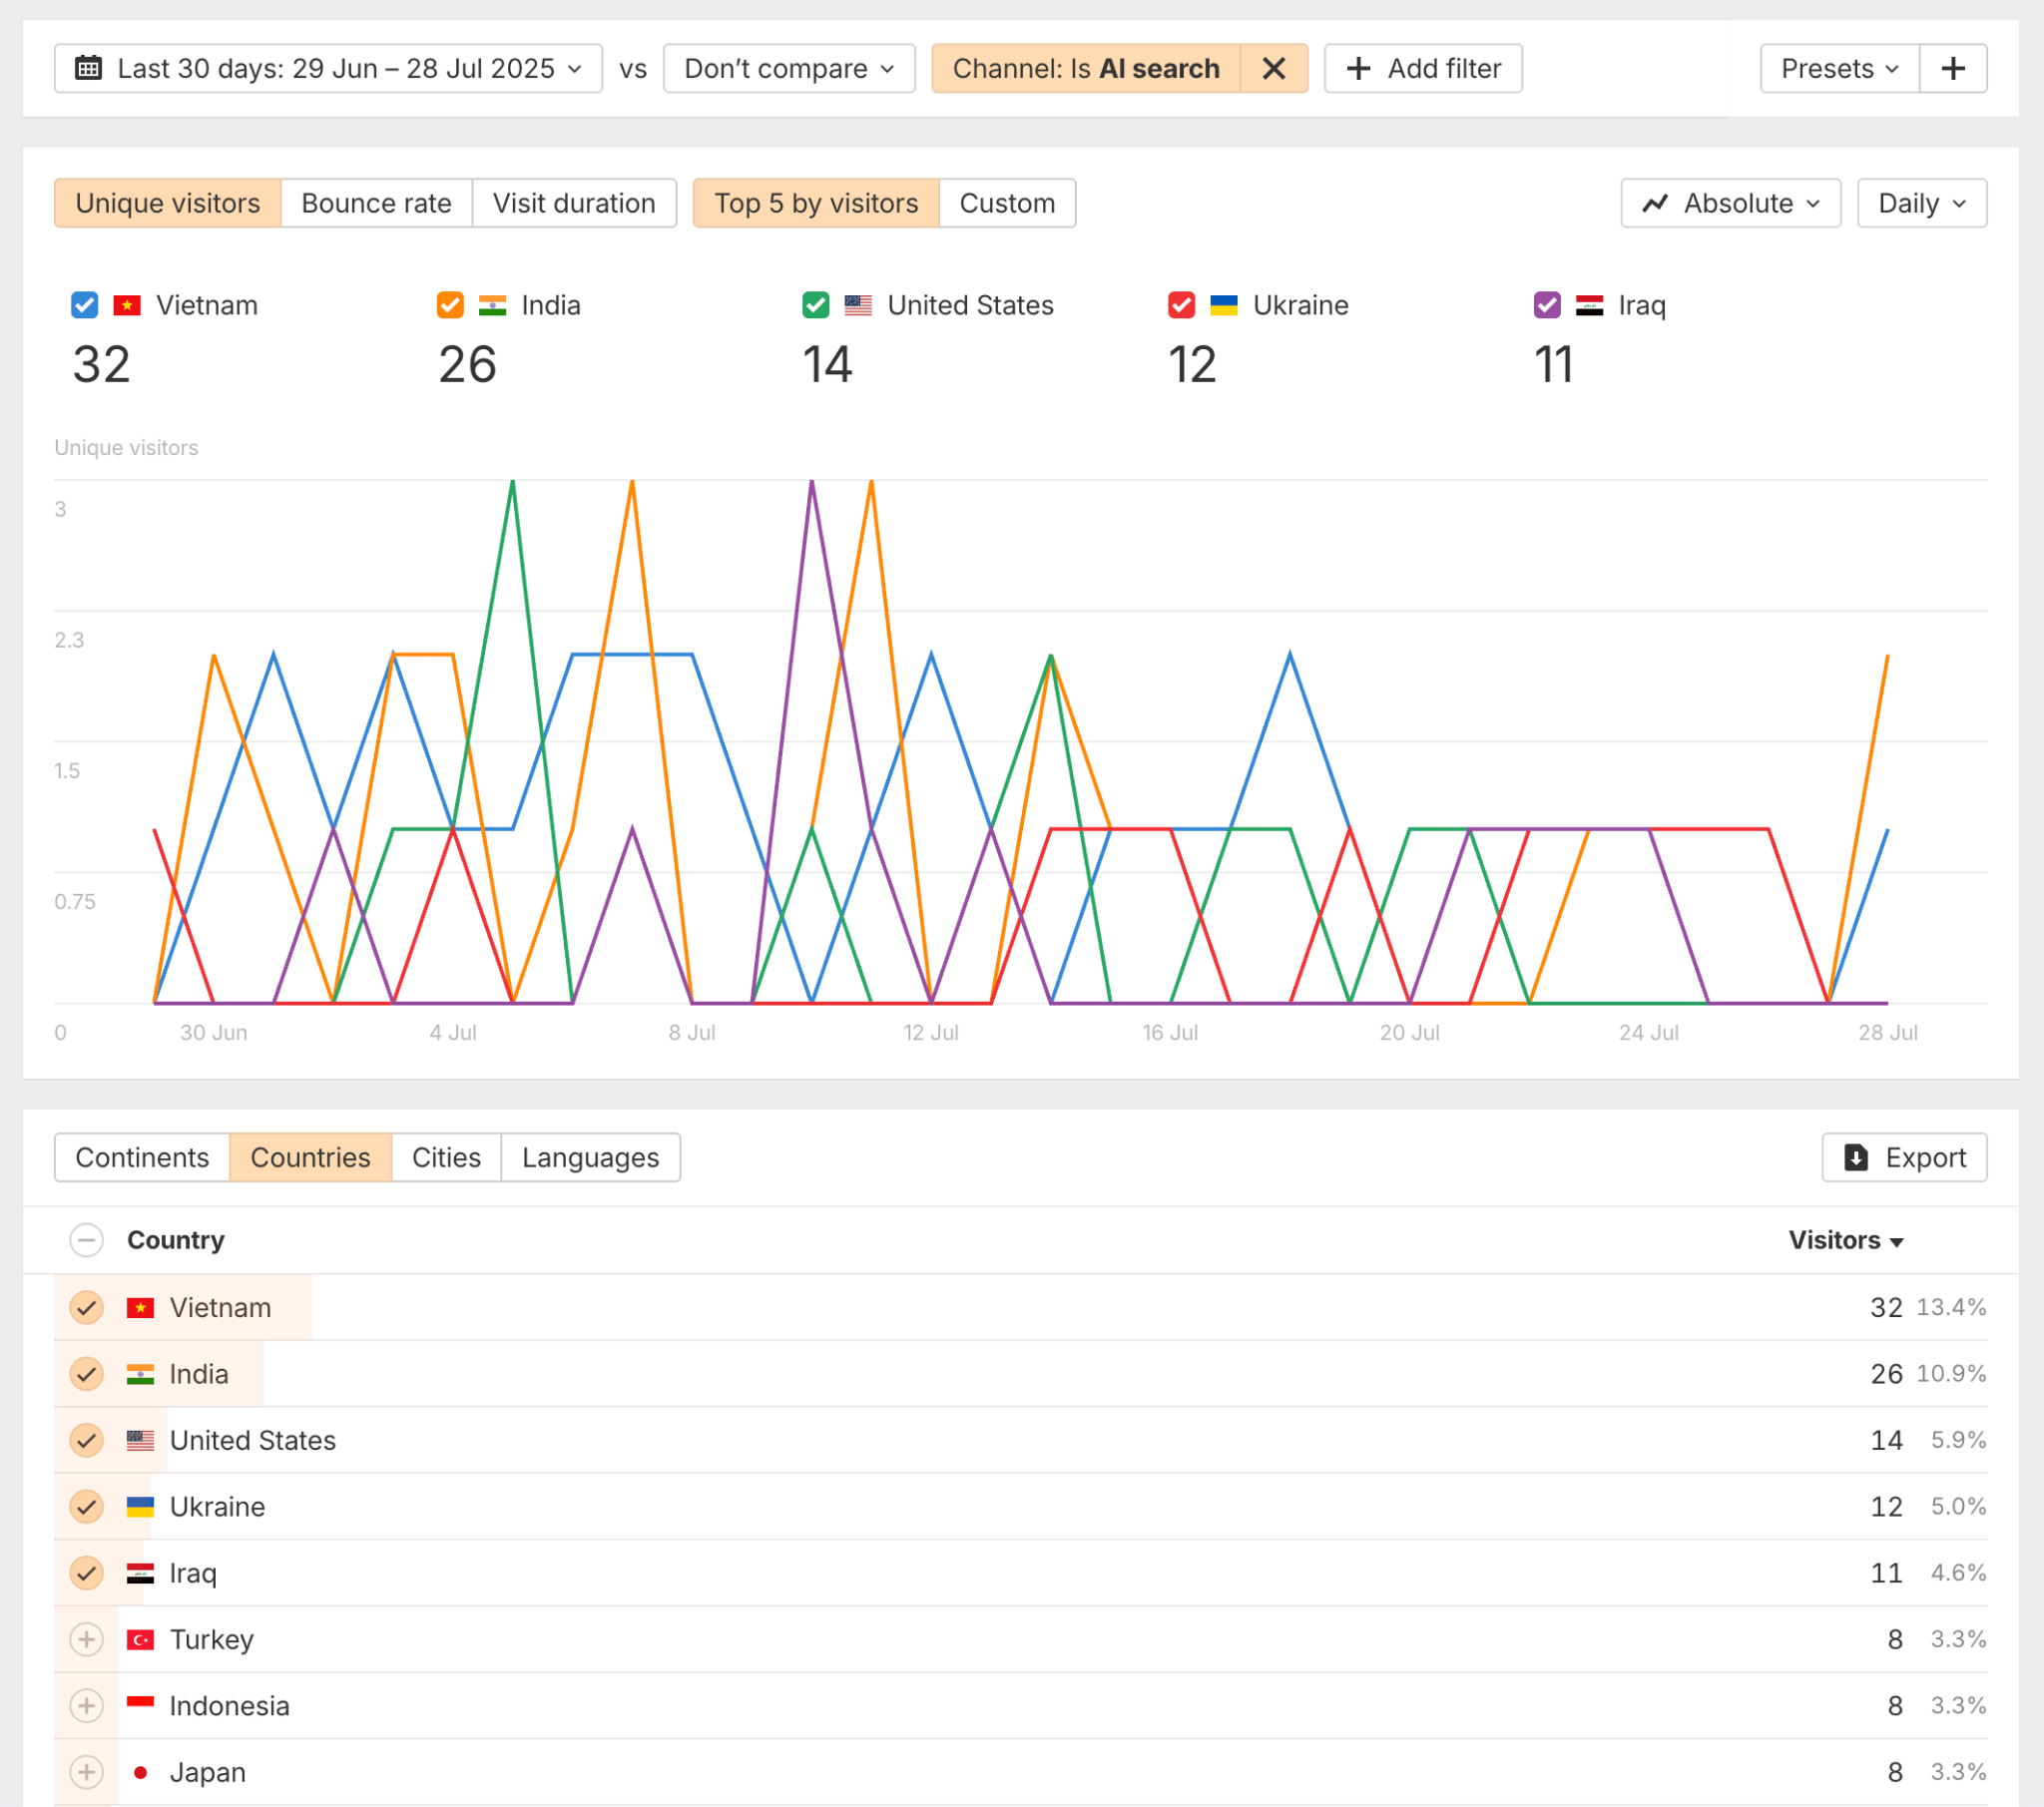
Geography data helps you understand where your audience is located, which can inform everything from your content strategy to your business hours.
Ahrefs Webmaster Tools shows all your traffic metrics in a clean, easy-to-use interface. It also has built-in tracking for AI traffic from tools like ChatGPT and Perplexity; all that without using cookies, so your visitors’ privacy is protected. Plus, you get unlimited historical data (unlike GA4 which only keeps up to 14 months’ worth in the free version ).
If you want to look at some alternatives, try Google Analytics 4 or Simple Analytics.
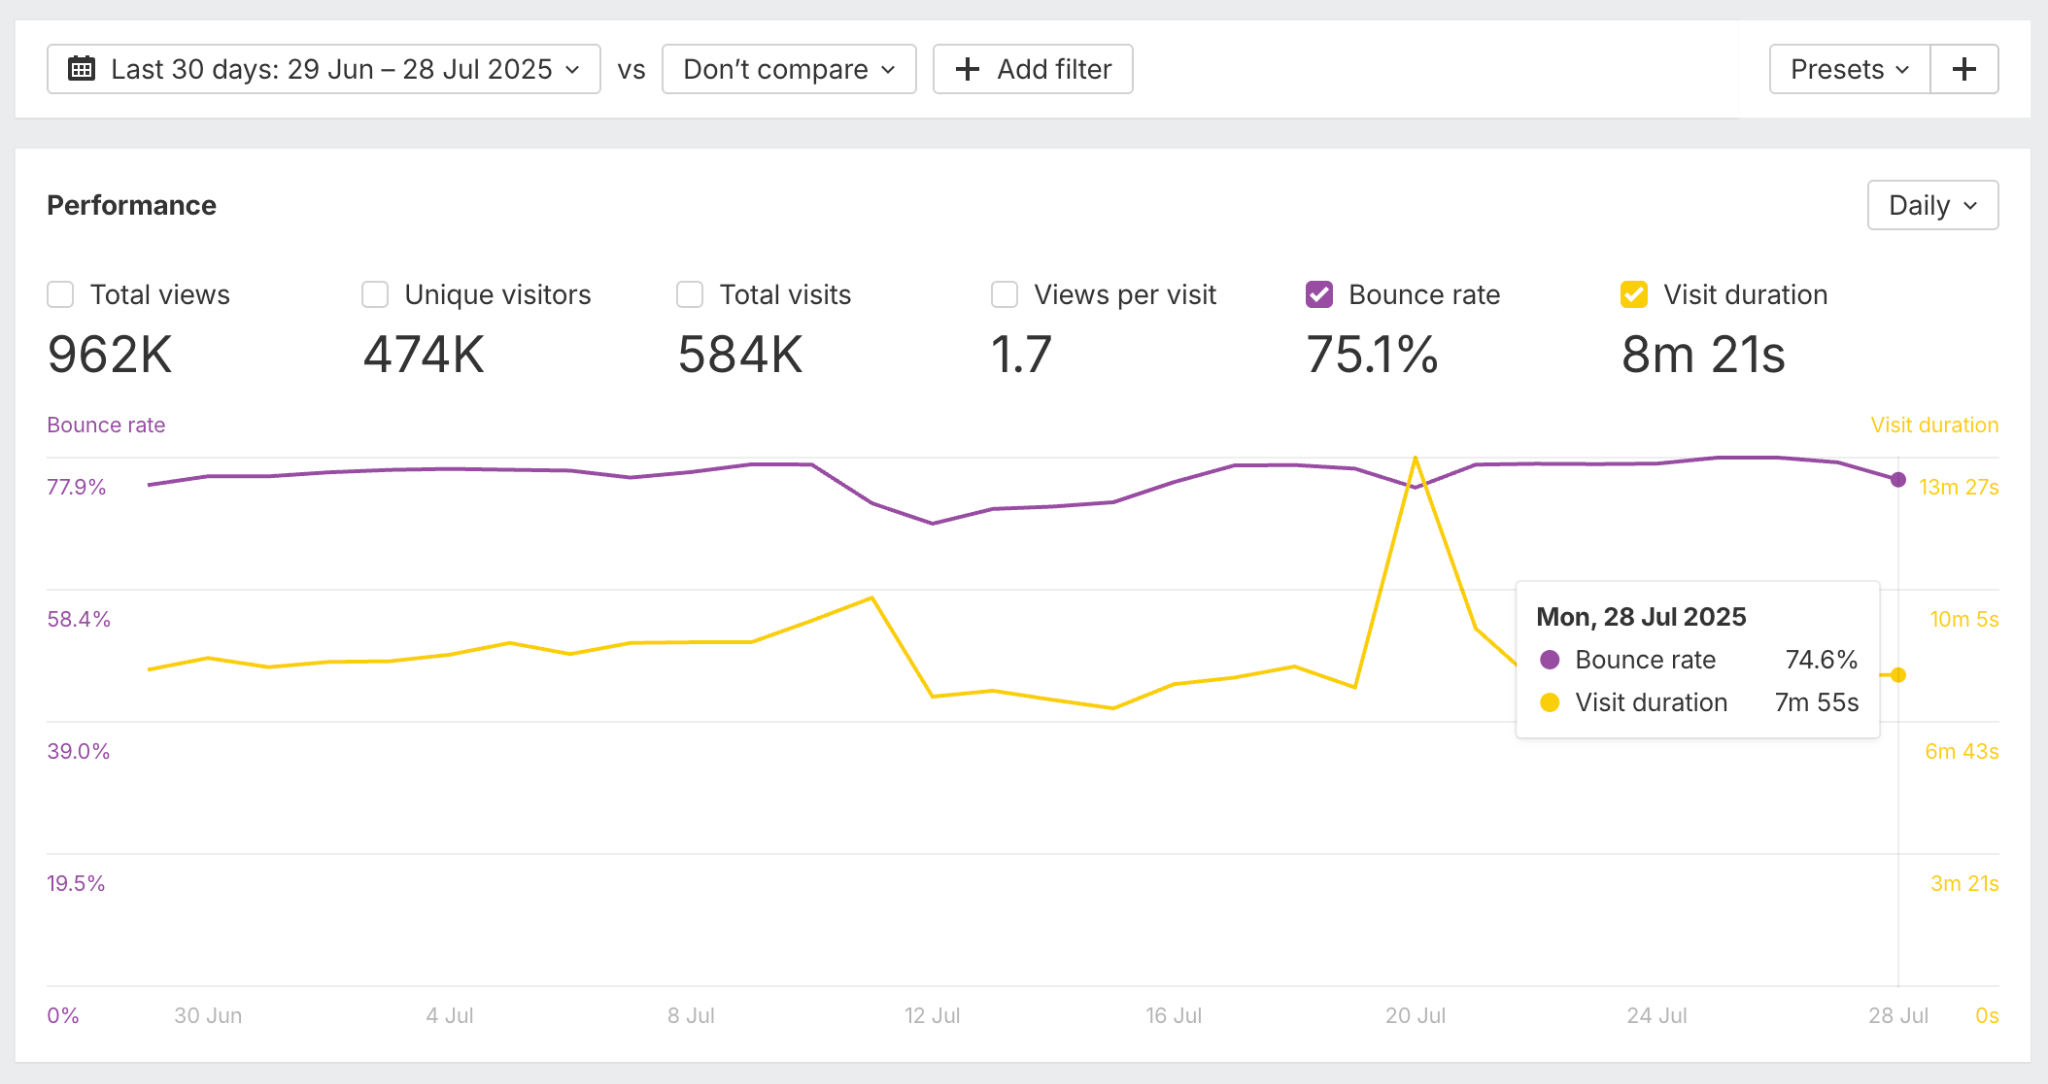
Once someone lands on your site, engagement metrics reveal whether your content is actually connecting with them.
Bounce rate measures the percentage of visitors who leave without clicking to another page on your site.
When it comes to this metric, context matters a lot, because a high bounce rate isn’t always bad.
If someone lands on your blog post, reads the entire thing, and leaves satisfied, that’s still a successful interaction. But if people are bouncing from your homepage or key landing pages, it might mean your content isn’t meeting their expectations or your navigation isn’t clear.
Session duration shows how long visitors explore your site overall before leaving. Longer sessions often indicate that visitors are genuinely engaged with your content and find it valuable enough to invest time in it.
Again, context matters—a quick visit to your contact page might actually be a good thing if someone immediately found what they needed.
All of the above engagement metrics are visible in the main performance chart.
For deeper behavioral insights, you might also consider Hotjar or Microsoft Clarity for heatmaps and session recordings.
SEO metrics reveal how discoverable your website is and how well it performs in search engines. These numbers directly impact how many people can find your content through Google.
Keyword rankings show which search terms bring people to your site without paid advertising. When someone searches for “how to bake sourdough bread” and finds your recipe, that’s organic traffic driven by your keyword rankings.
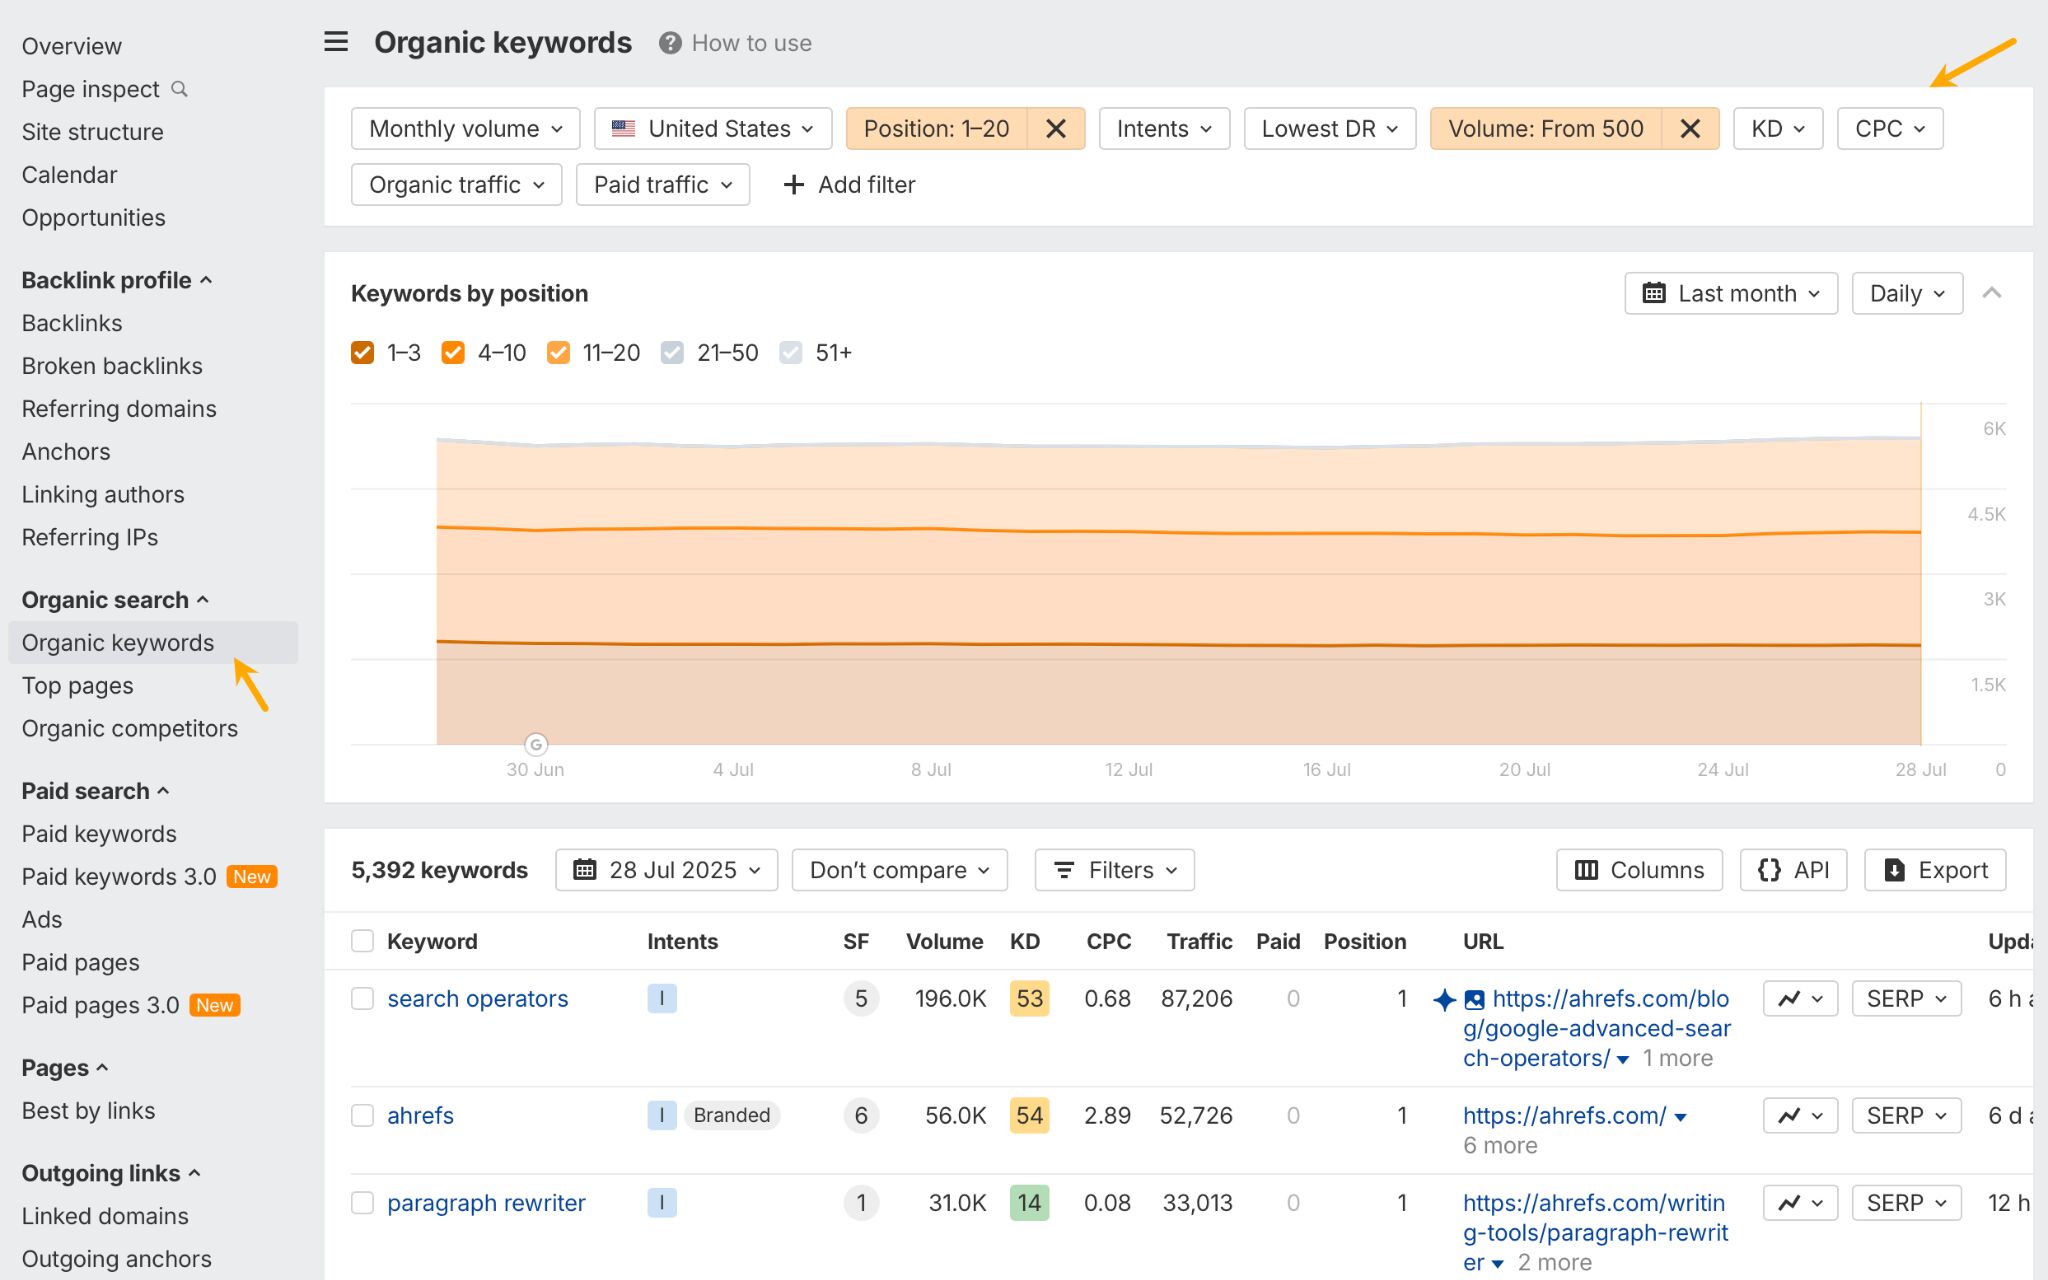
To get data on your Keywords in AWT, open the Site Explorer tool and click on the Organic keywords report. You can also set up a filter to track important keywords. In this example, I’ve set the filters to Positions 1-20, and search volume min. 500. This shows me the best-performing target keywords.
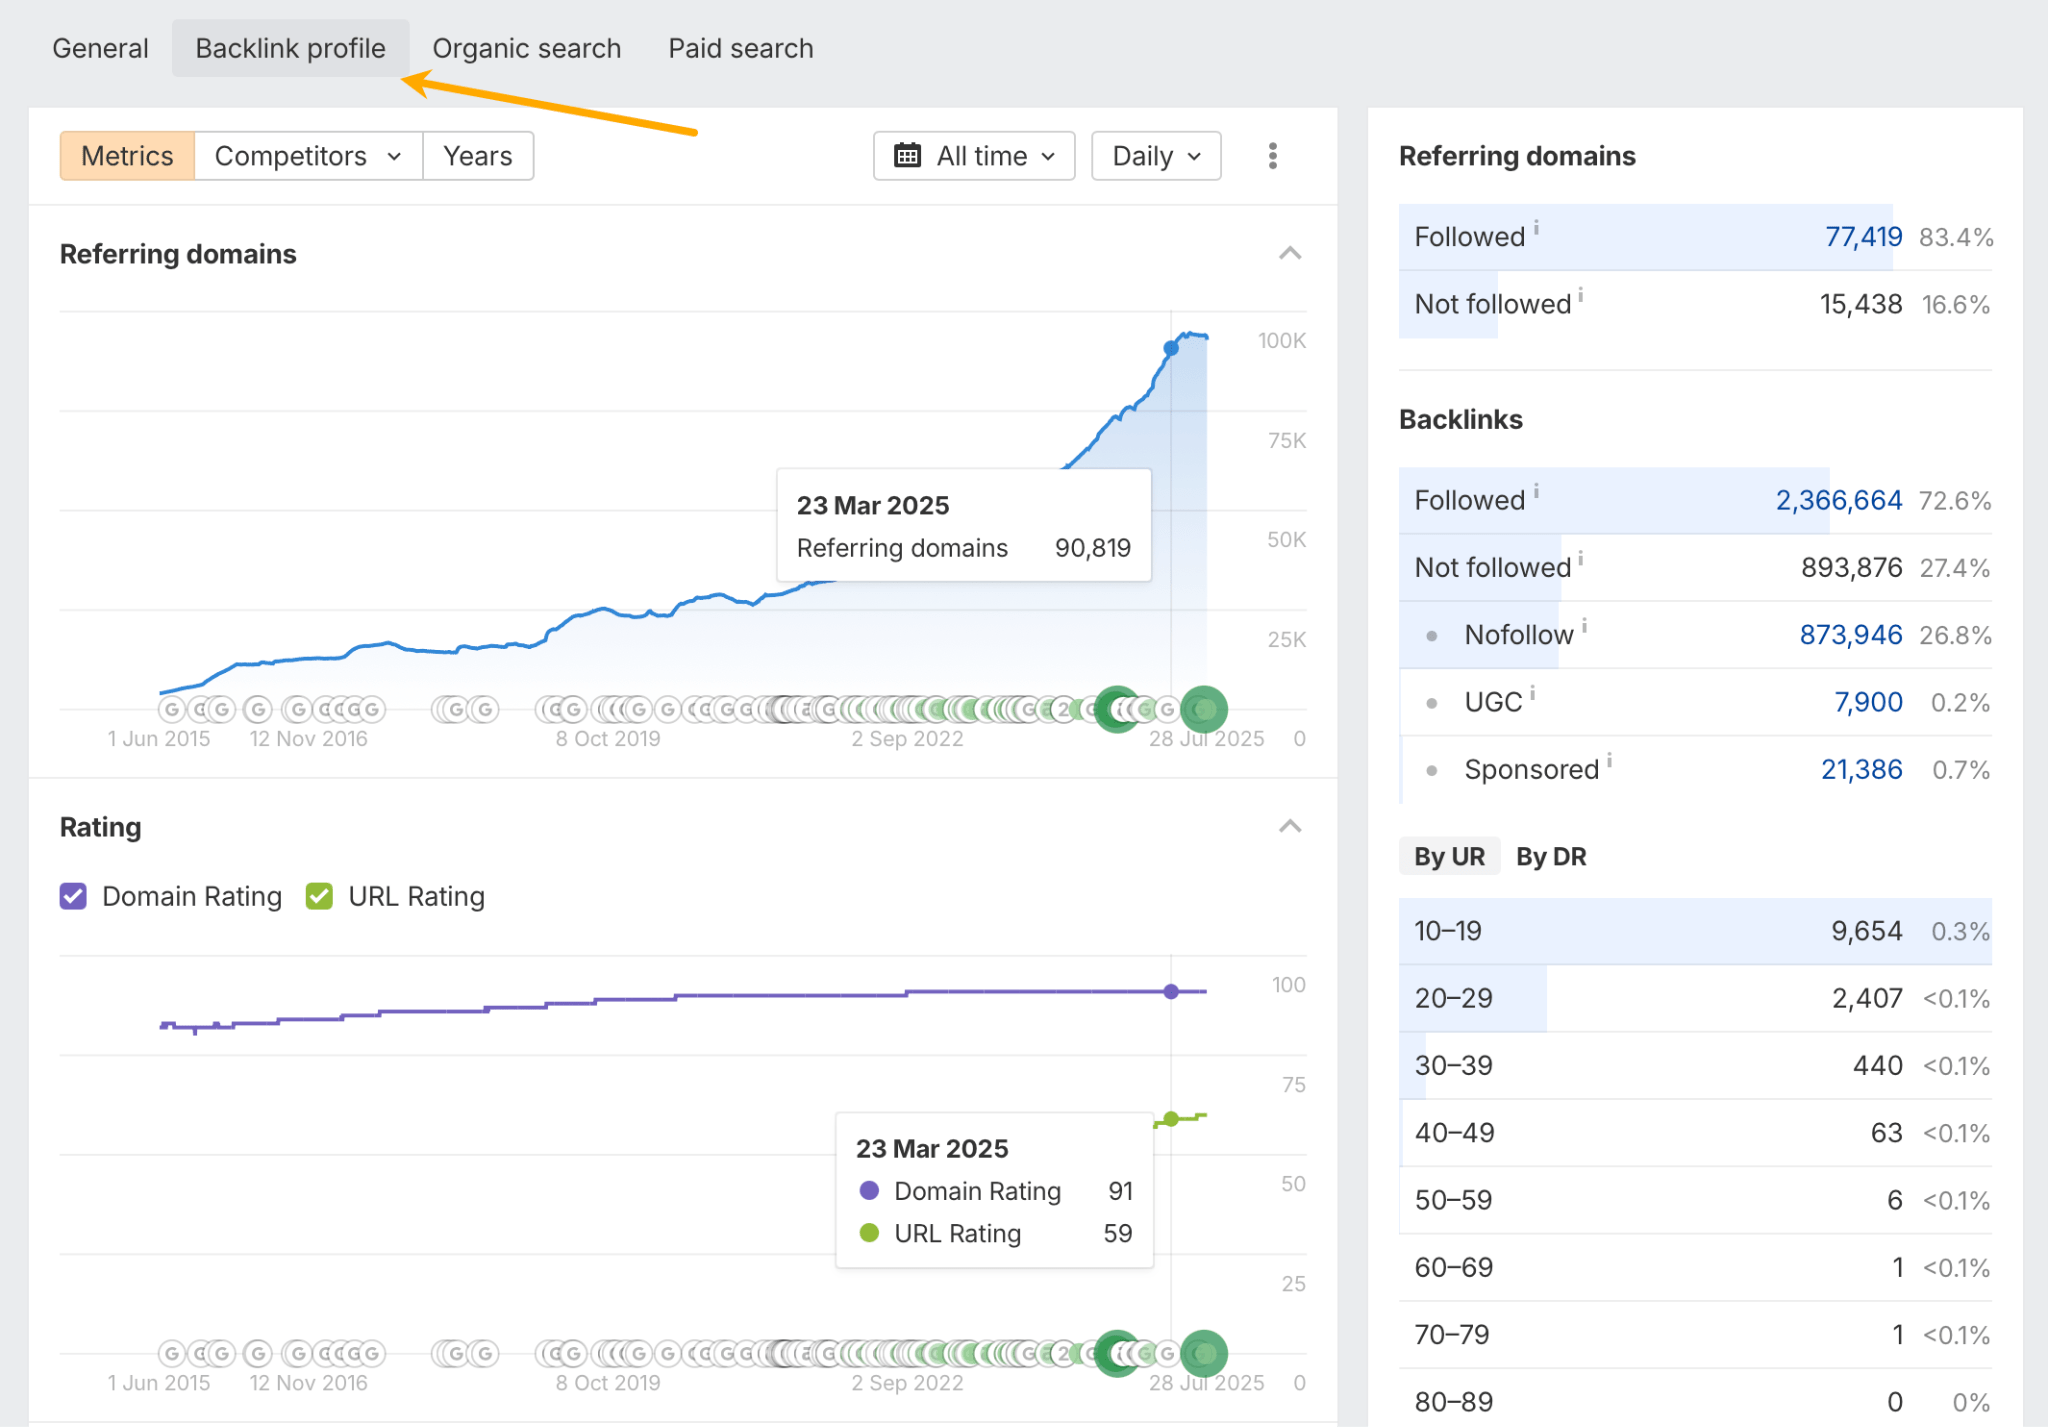
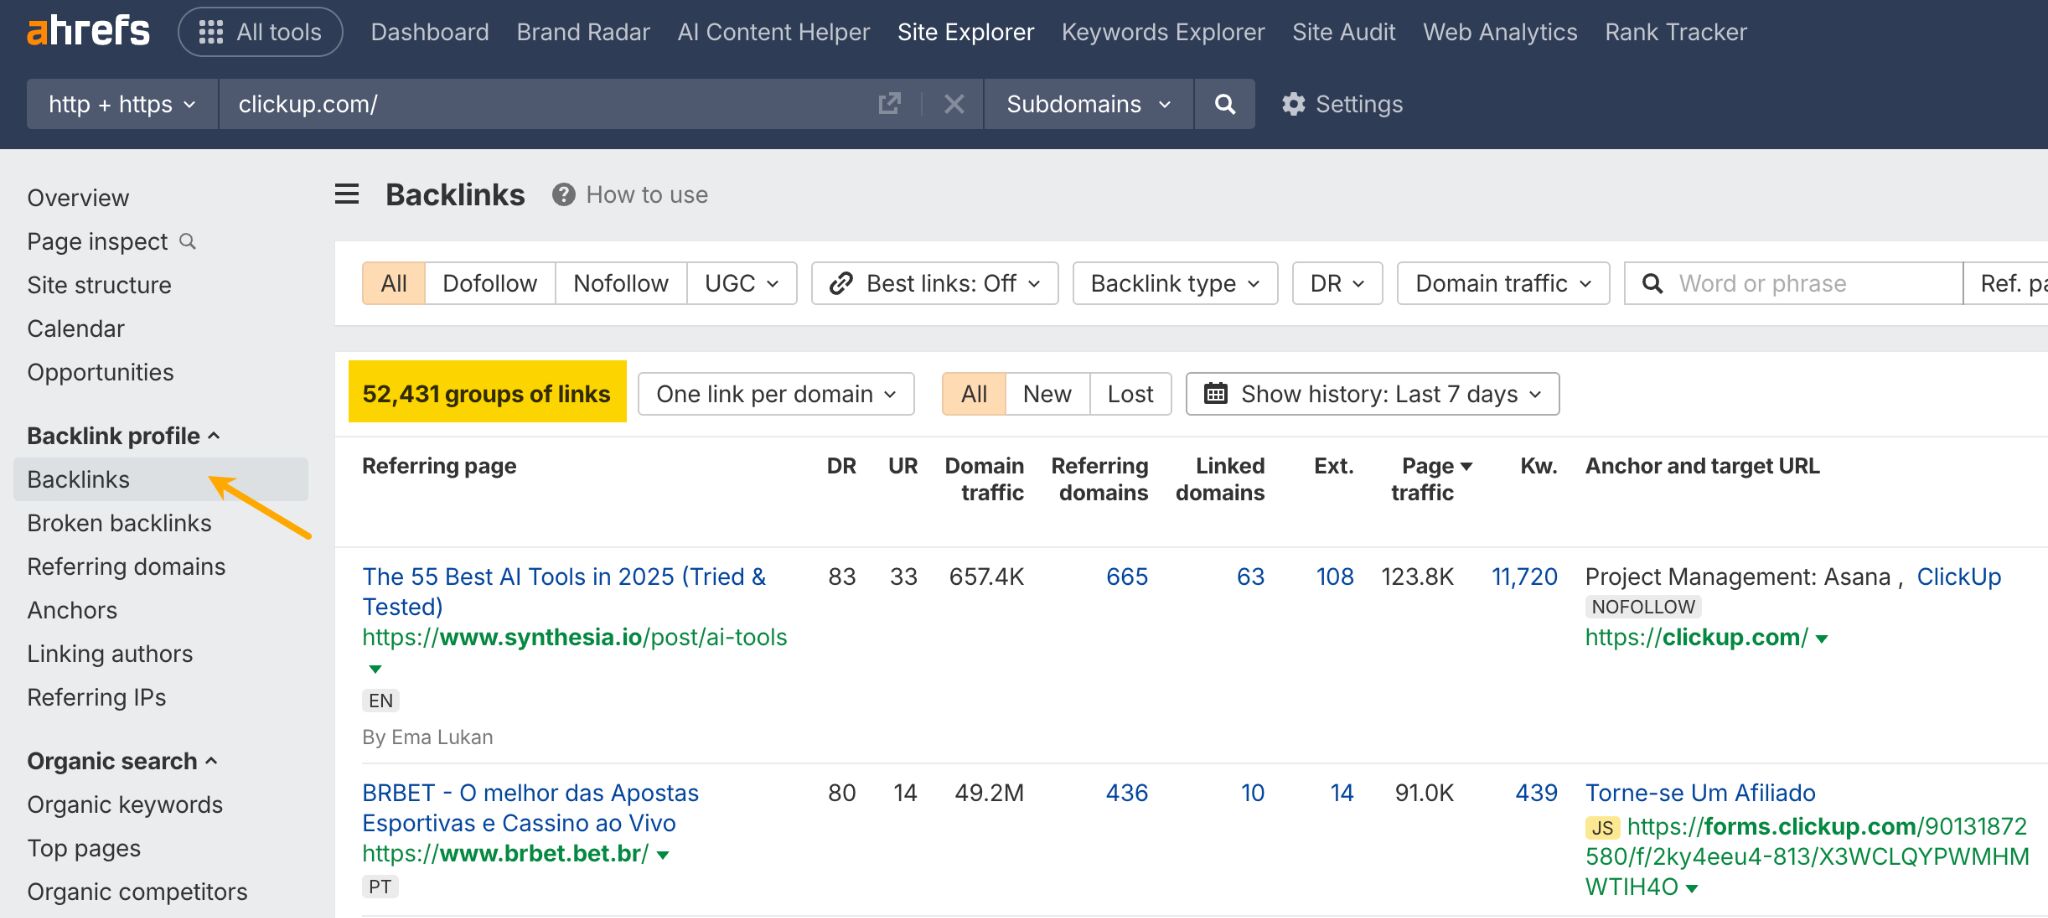
Referring domain growth measures how many other websites link to yours. When a food blog links to your sourdough recipe or a business publication references your marketing guide, those backlinks signal to search engines that your content is valuable and trustworthy.
Quality matters more than quantity; one link from a respected industry publication is worth more than dozens from low-quality sites.
Get referring domain data by clicking on the Backlink profile tab in Site Explorer’s Overview report.
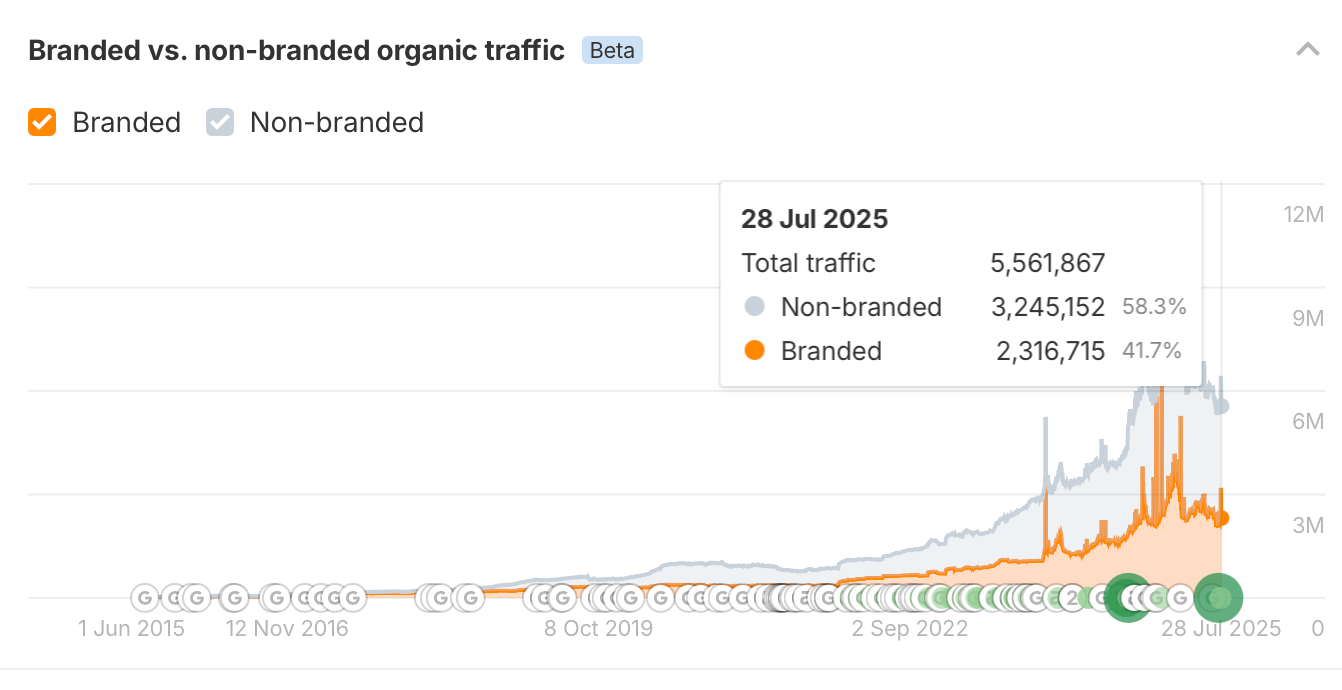
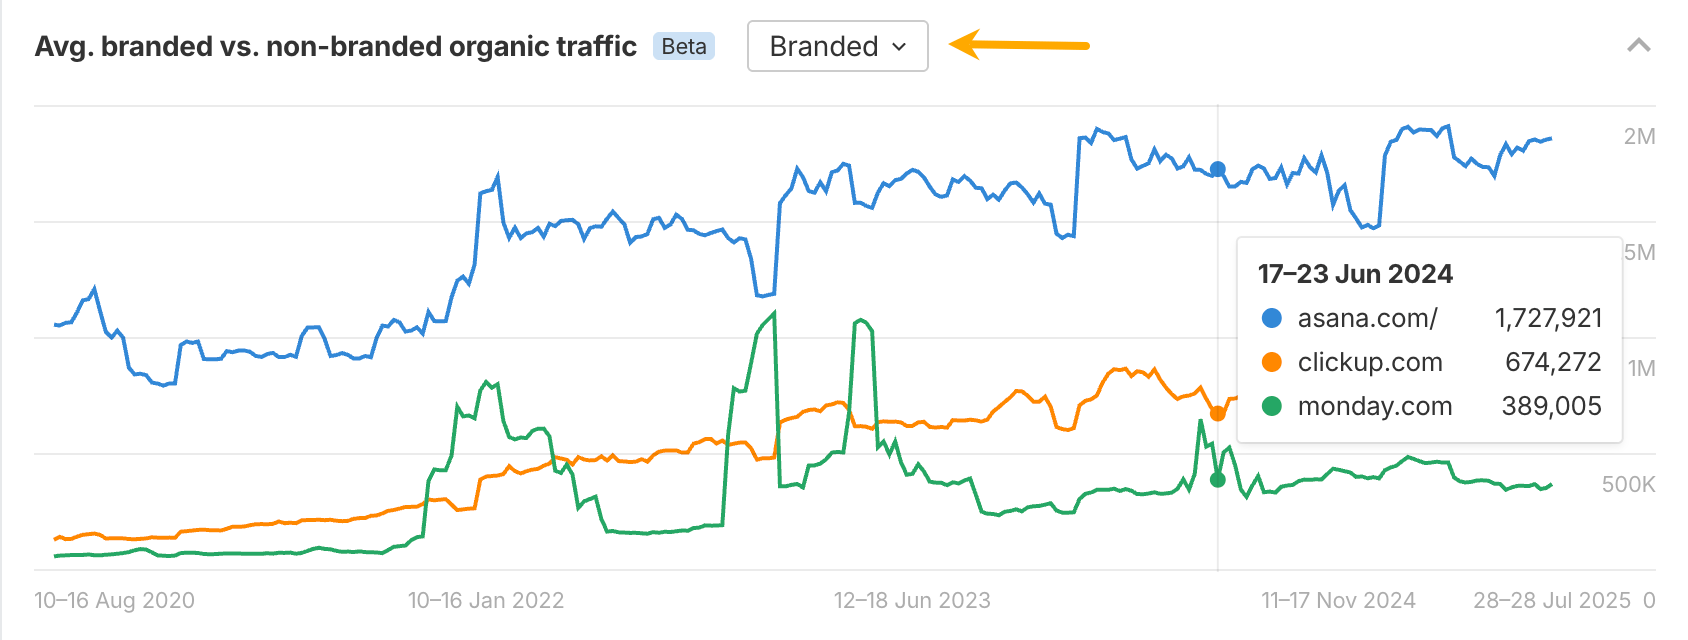
Branded vs. unbranded traffic. Branded traffic comes from people searching specifically for your company or products (like “ahrefs keywords explorer”). Unbranded traffic comes from people searching for general topics you cover (for example, “keyword research”).
Both are valuable: branded traffic shows you’re building recognition, while unbranded traffic demonstrates your ability to attract new audiences who don’t yet know your brand but are searching for solutions you provide.
While in the overview report, scroll down a bit, and you’ll see the branded vs non-branded chart.
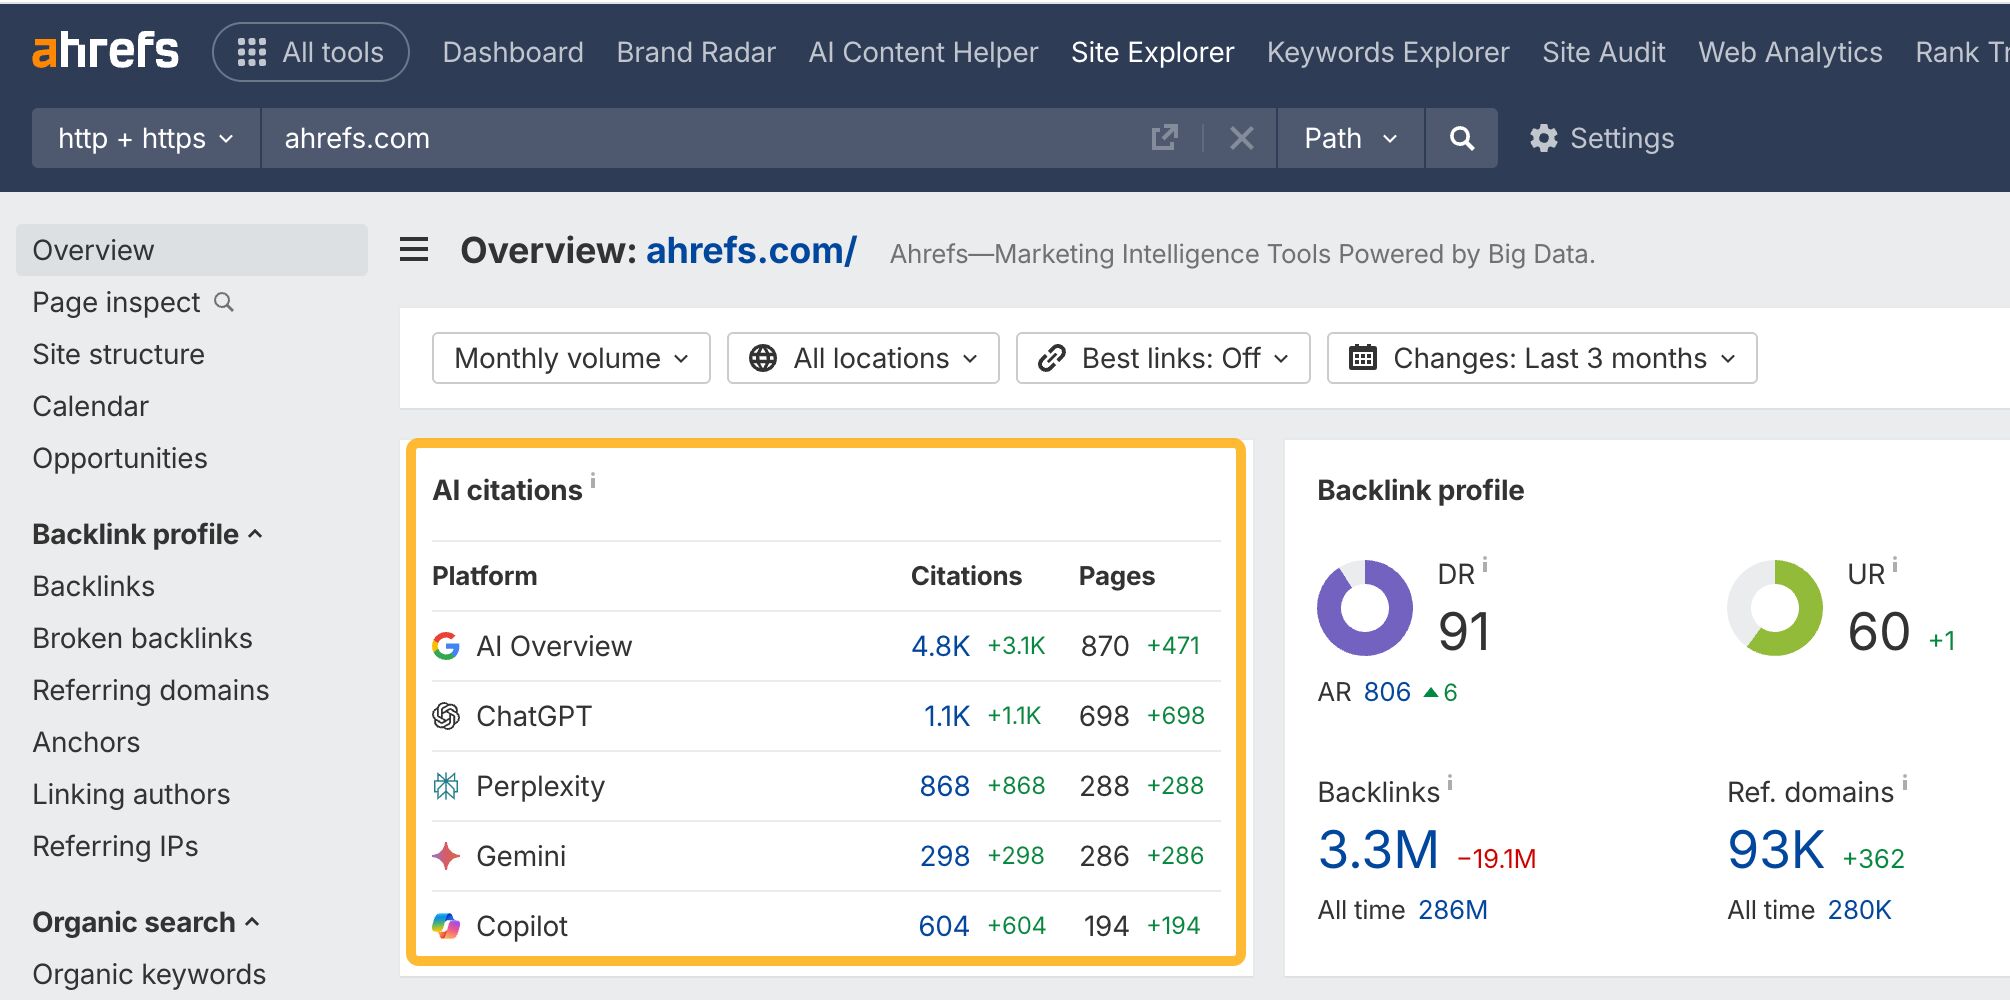
Ahrefs Webmaster Tools also monitors when AI tools cite your content as source material in their responses, even when users don’t click through to visit your website.
Citation visibility shows your content’s influence beyond traditional metrics. When ChatGPT or Perplexity references your research, quotes your expertise, or uses your content to answer questions, that’s valuable brand exposure and authority building, even if it doesn’t generate immediate traffic.
You can find your AI citation count with a breakdown of sources in the Overview report.
If you also want to know when and how your brand was mentioned by ChatGPT, Perplexity, Copilot, and AI Overviews, take a look at Ahrefs’ Brand Radar. It’s got data on your competitors, too.
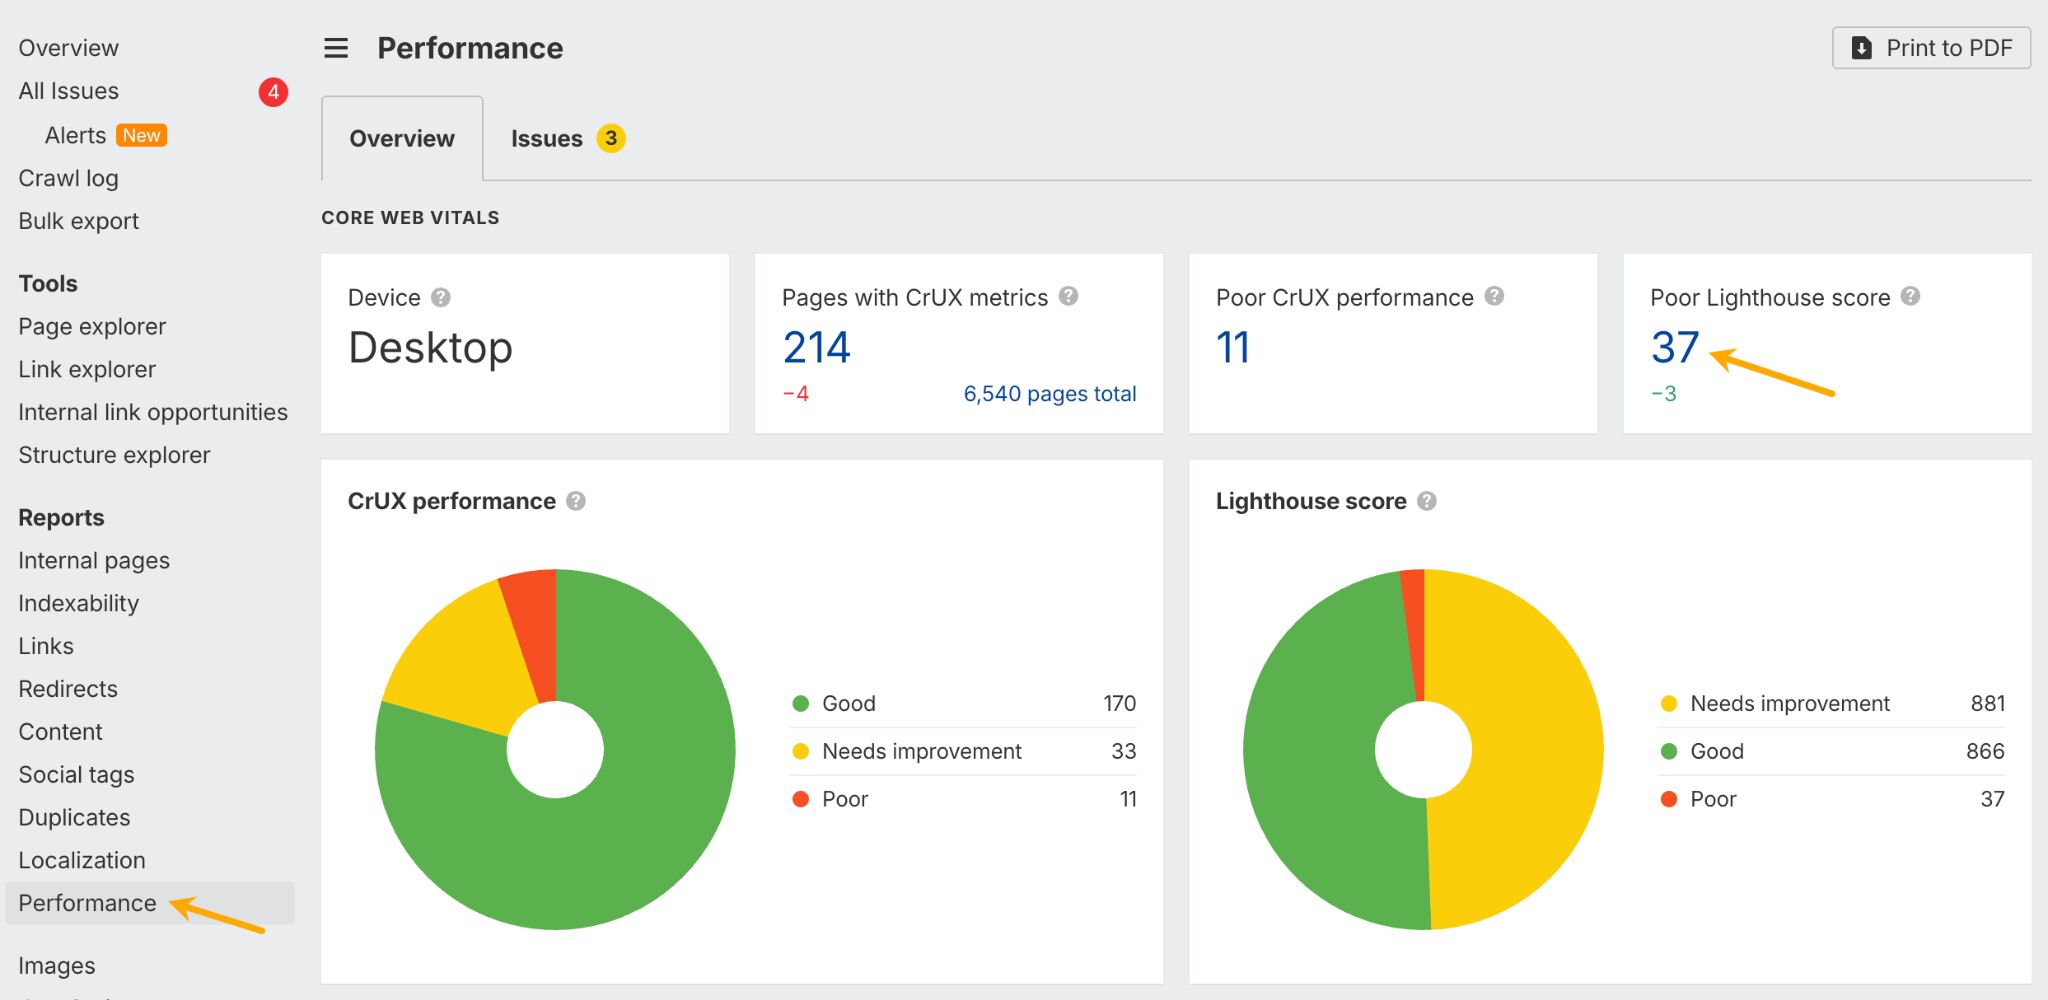
Core Web Vitals measure the technical user experience of your site: how fast pages load, how quickly they respond to clicks, and how stable the layout is while loading. These metrics can affect both your search rankings and user satisfaction. Nobody likes waiting for a slow, clunky website to load.
To enable Core Web Vitals, you first need to get a free CWV API key and provide it in Site Audit’s Settings (here’s how to do that step by step). Next, click on the performance report in Site Audit. You’ll see the number of pages with poor scores—the goal is to improve them to reach a “Good” grade (we’ve got a guide on that, too)
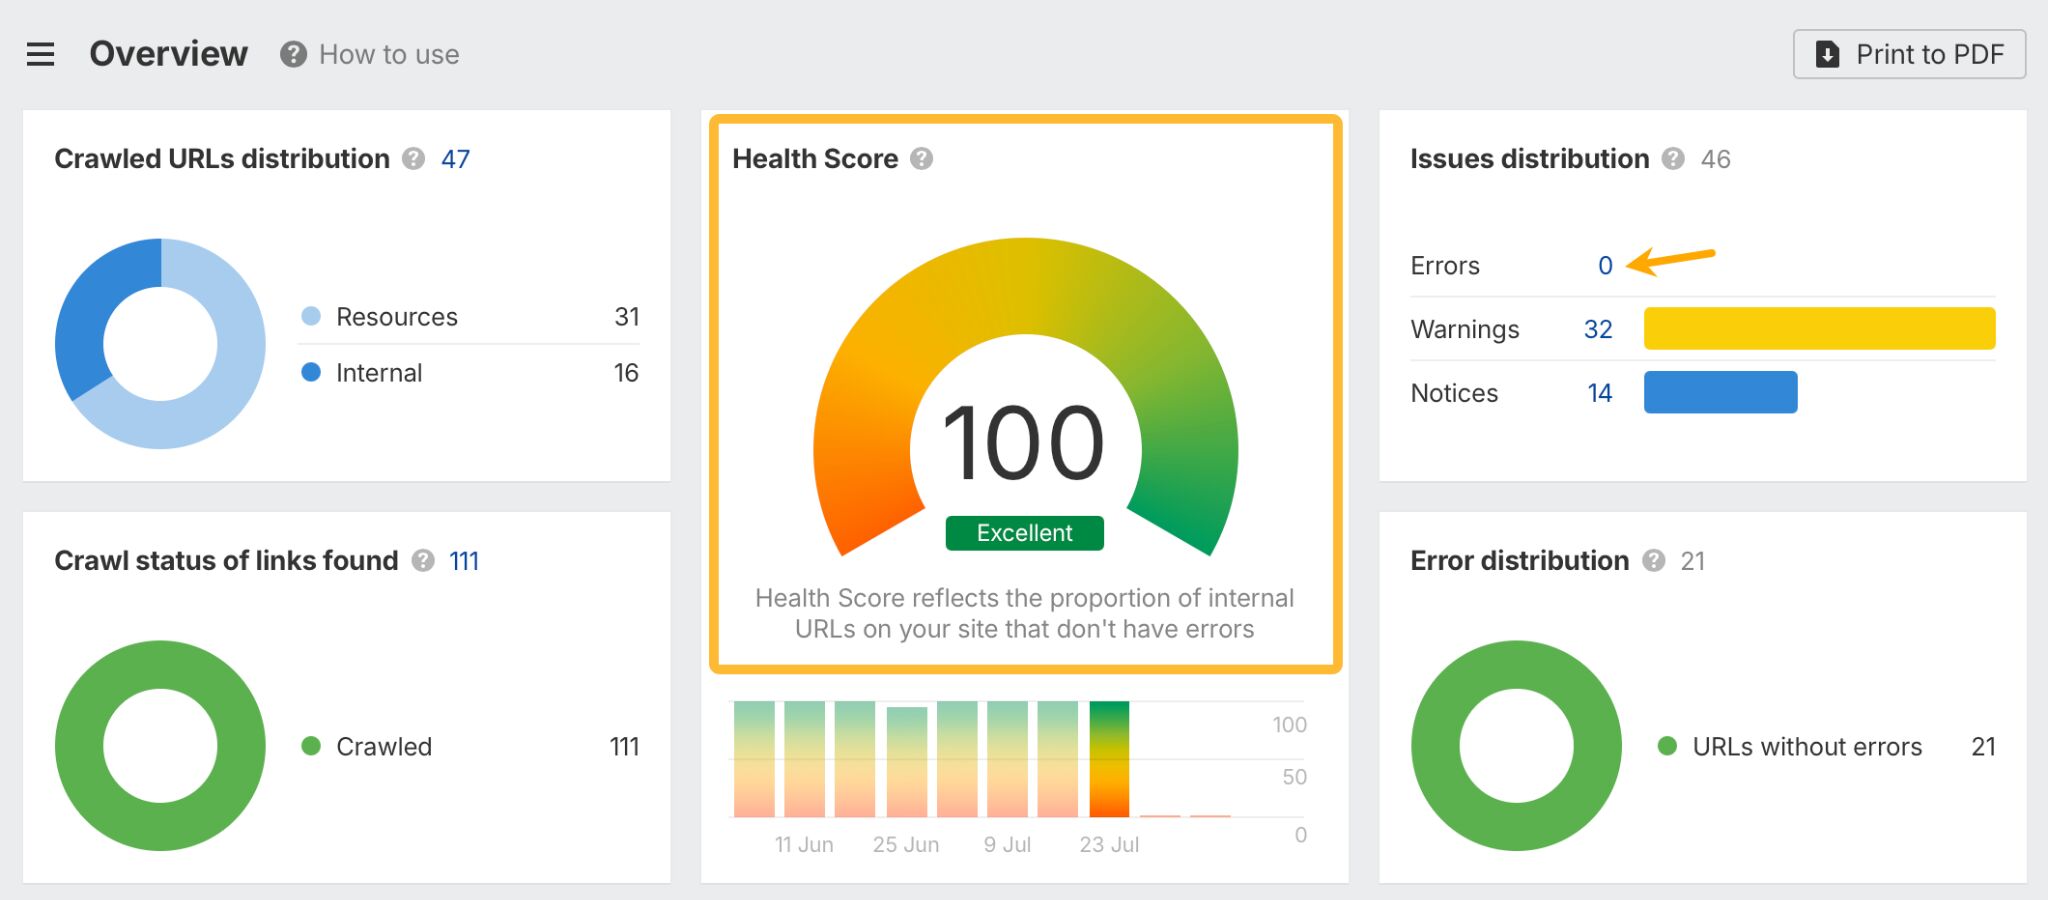
SEO health encompasses all the technical factors that help search engines access and understand your site. This includes checking for broken pages, pages with few or no internal links, mobile experience issues, and other issues that might prevent your pages from ranking well.
Check your SEO health by opening Site Audit—the data is right at the top. Click on “Errors” to see which pages have major SEO issues and how to fix them. The tool also keeps an eye on your site on autopilot and can send you email updates.
SEO is where Ahrefs Webmaster Tools really shines, offering comprehensive backlink analysis, keyword tracking, and technical SEO auditing that goes far beyond what you can see in Google Search Console alone.
But you don’t need to choose. AWT integrates with Search Console so you can get Google’s data right inside Ahrefs.
This is where everything comes together. Conversion metrics measure whether your website is accomplishing its purpose—turning visitors into subscribers, customers, or whatever action matters most to your business.
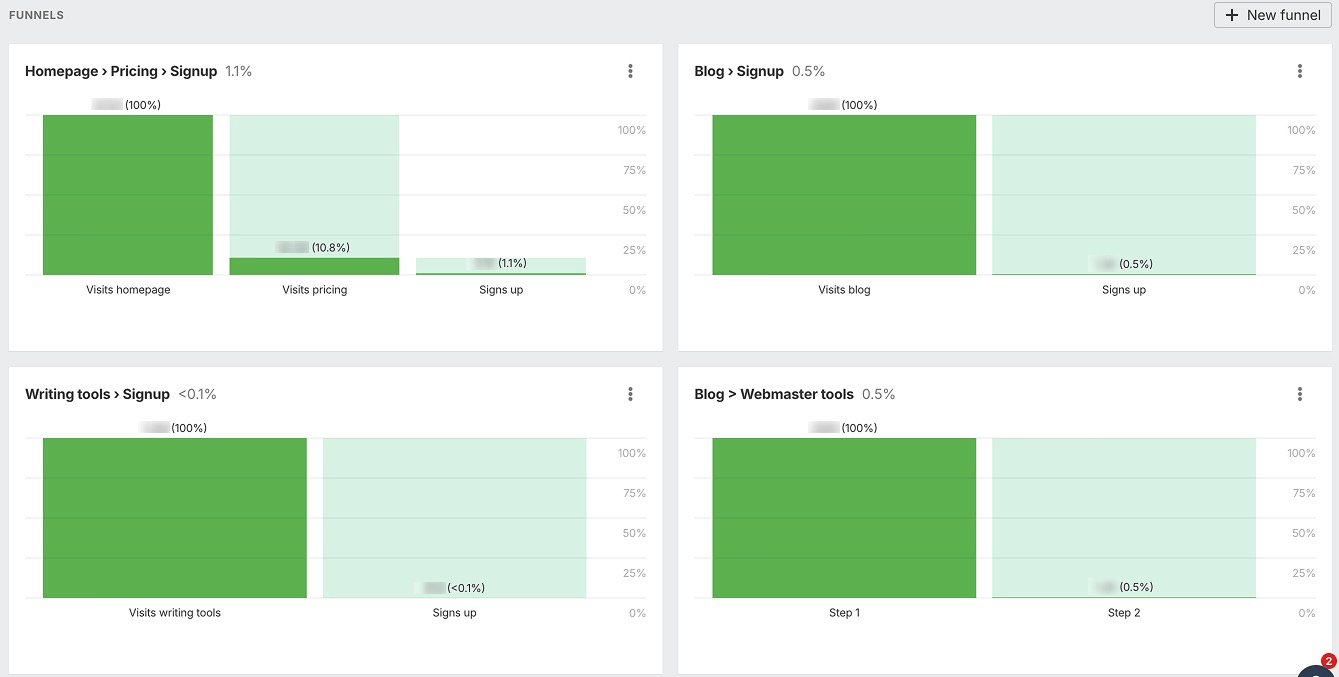
Funnel completions track how many users complete important processes on your site. For an e-commerce store, this might be completing a purchase. For a blog, it could be signing up for the newsletter. For a service business, it might be filling out a contact form or scheduling a consultation.
Check out how to set up funnels in Ahrefs.
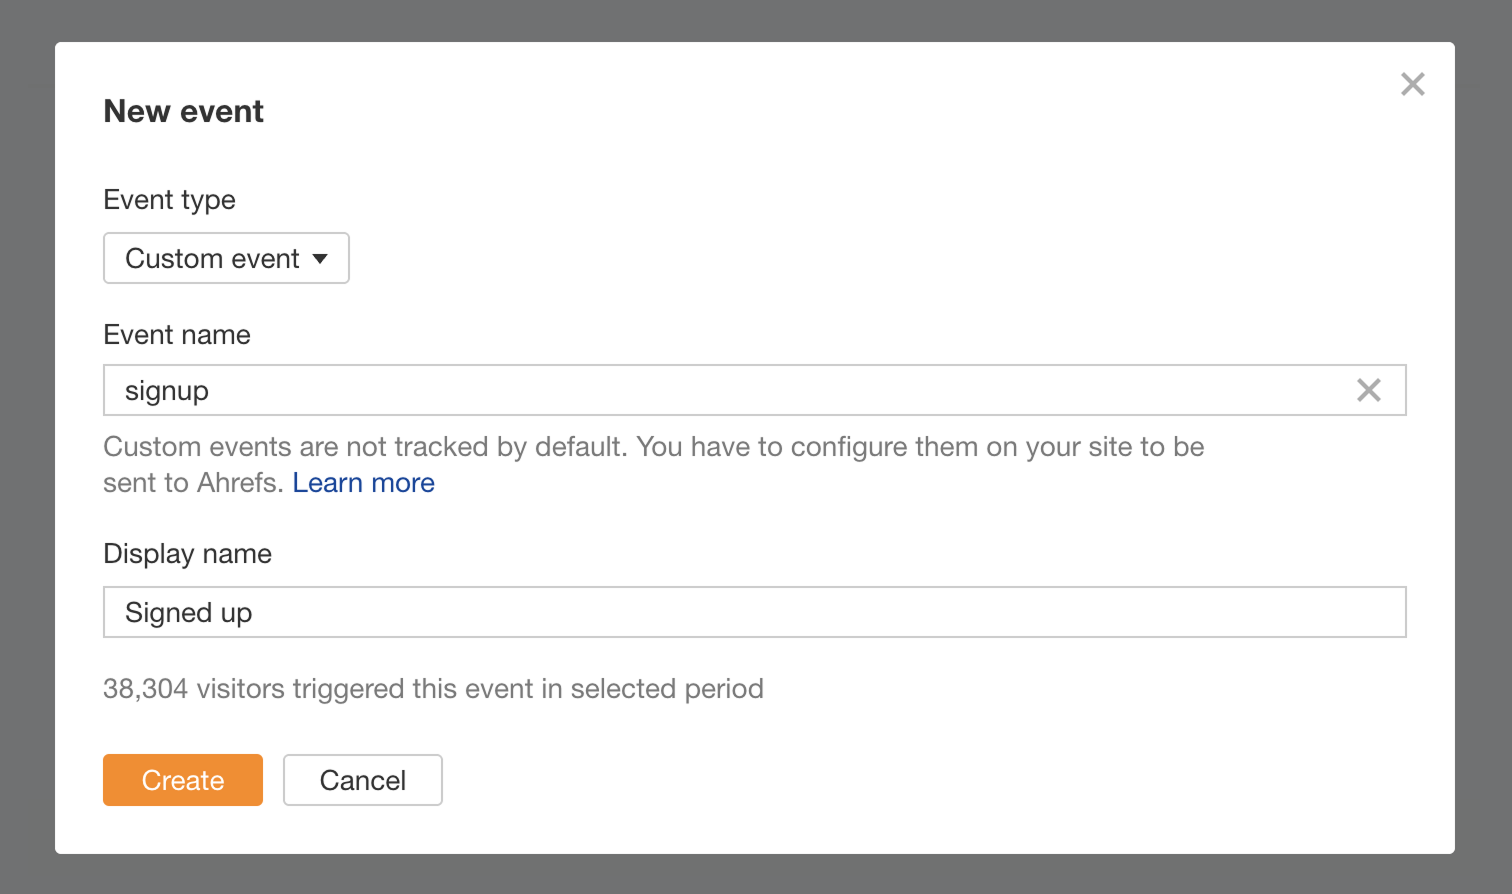
Events capture all the micro-conversions that happen along the customer journey—email signups, download clicks, video plays, or any other action that indicates engagement. These smaller actions often predict larger conversions down the line.
Here’s a quick guide on how to set up events in Ahrefs.
AWT allows you to set up custom events and track funnel completions for the conversions that matter to your business. For more advanced conversion analysis, you might also consider Mixpanel or Hotjar.
Metrics are any measurable data points about your website—page views, bounce rate, time on site, conversion rate, traffic sources, and dozens of others. Think of these as raw ingredients in your analytics kitchen. You have access to lots of data, but not all of it is equally important for your specific situation.
KPIs (Key Performance Indicators) are the specific metrics that matter most for your business goals. They’re the handful of numbers that actually determine whether your website is succeeding or failing at its primary purpose.
Your KPIs should be the metrics that, if they improve significantly, would make a real difference to your success.
Patterns help you see what really drives results by cutting through the noise, showing long-term impact, and revealing insights single data points can’t.
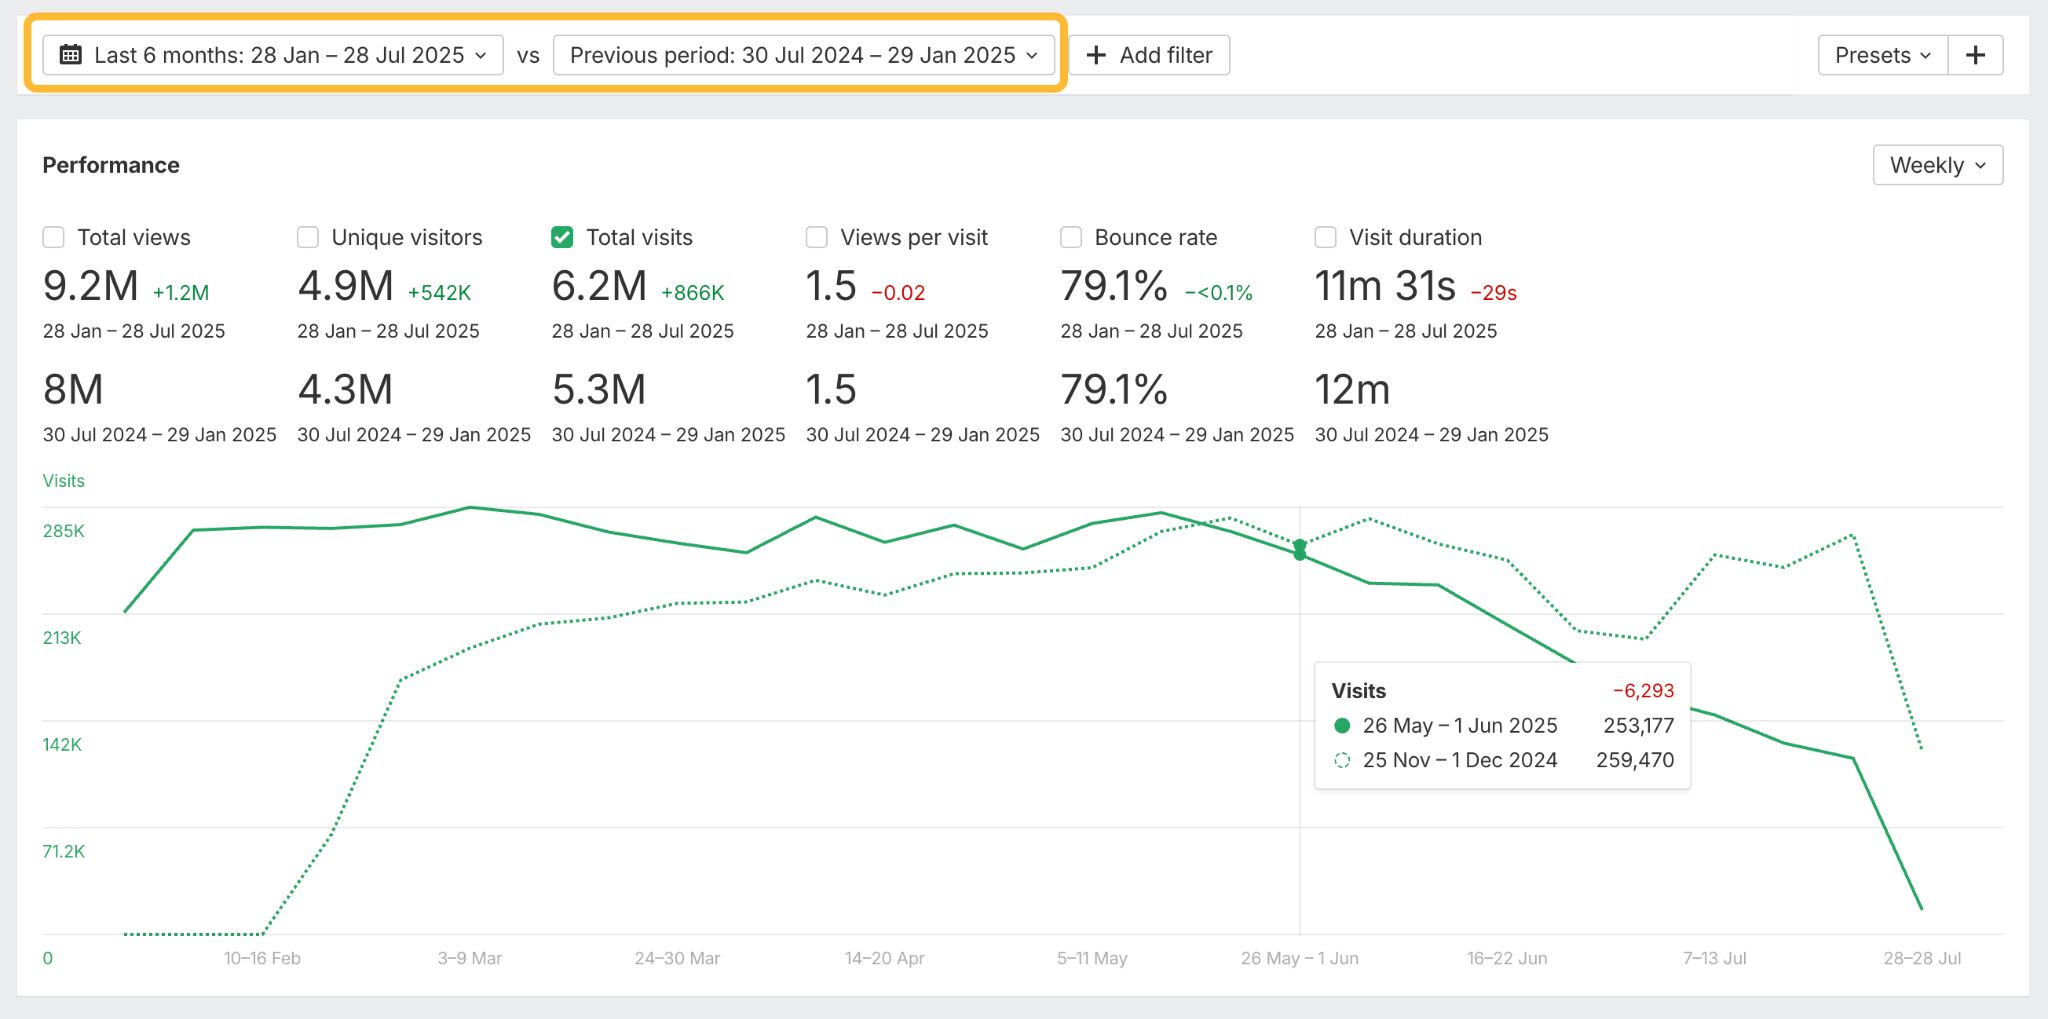
Sudden changes: the spikes and drops that demand attention
Traffic spikes can be thrilling, but they’re also diagnostic opportunities. When you see a sudden jump in visitors, investigate. Break down the spike by traffic source, location, and device to understand what drove it.
For instance, below I’m analyzing a short period of a surge in traffic to one of my articles. I’ve set the upper filter to show only the data for that page. In the traffic breakdown, I can see that the surge was mostly from Google (likely Google Discover), but I was also featured in a newsletter.
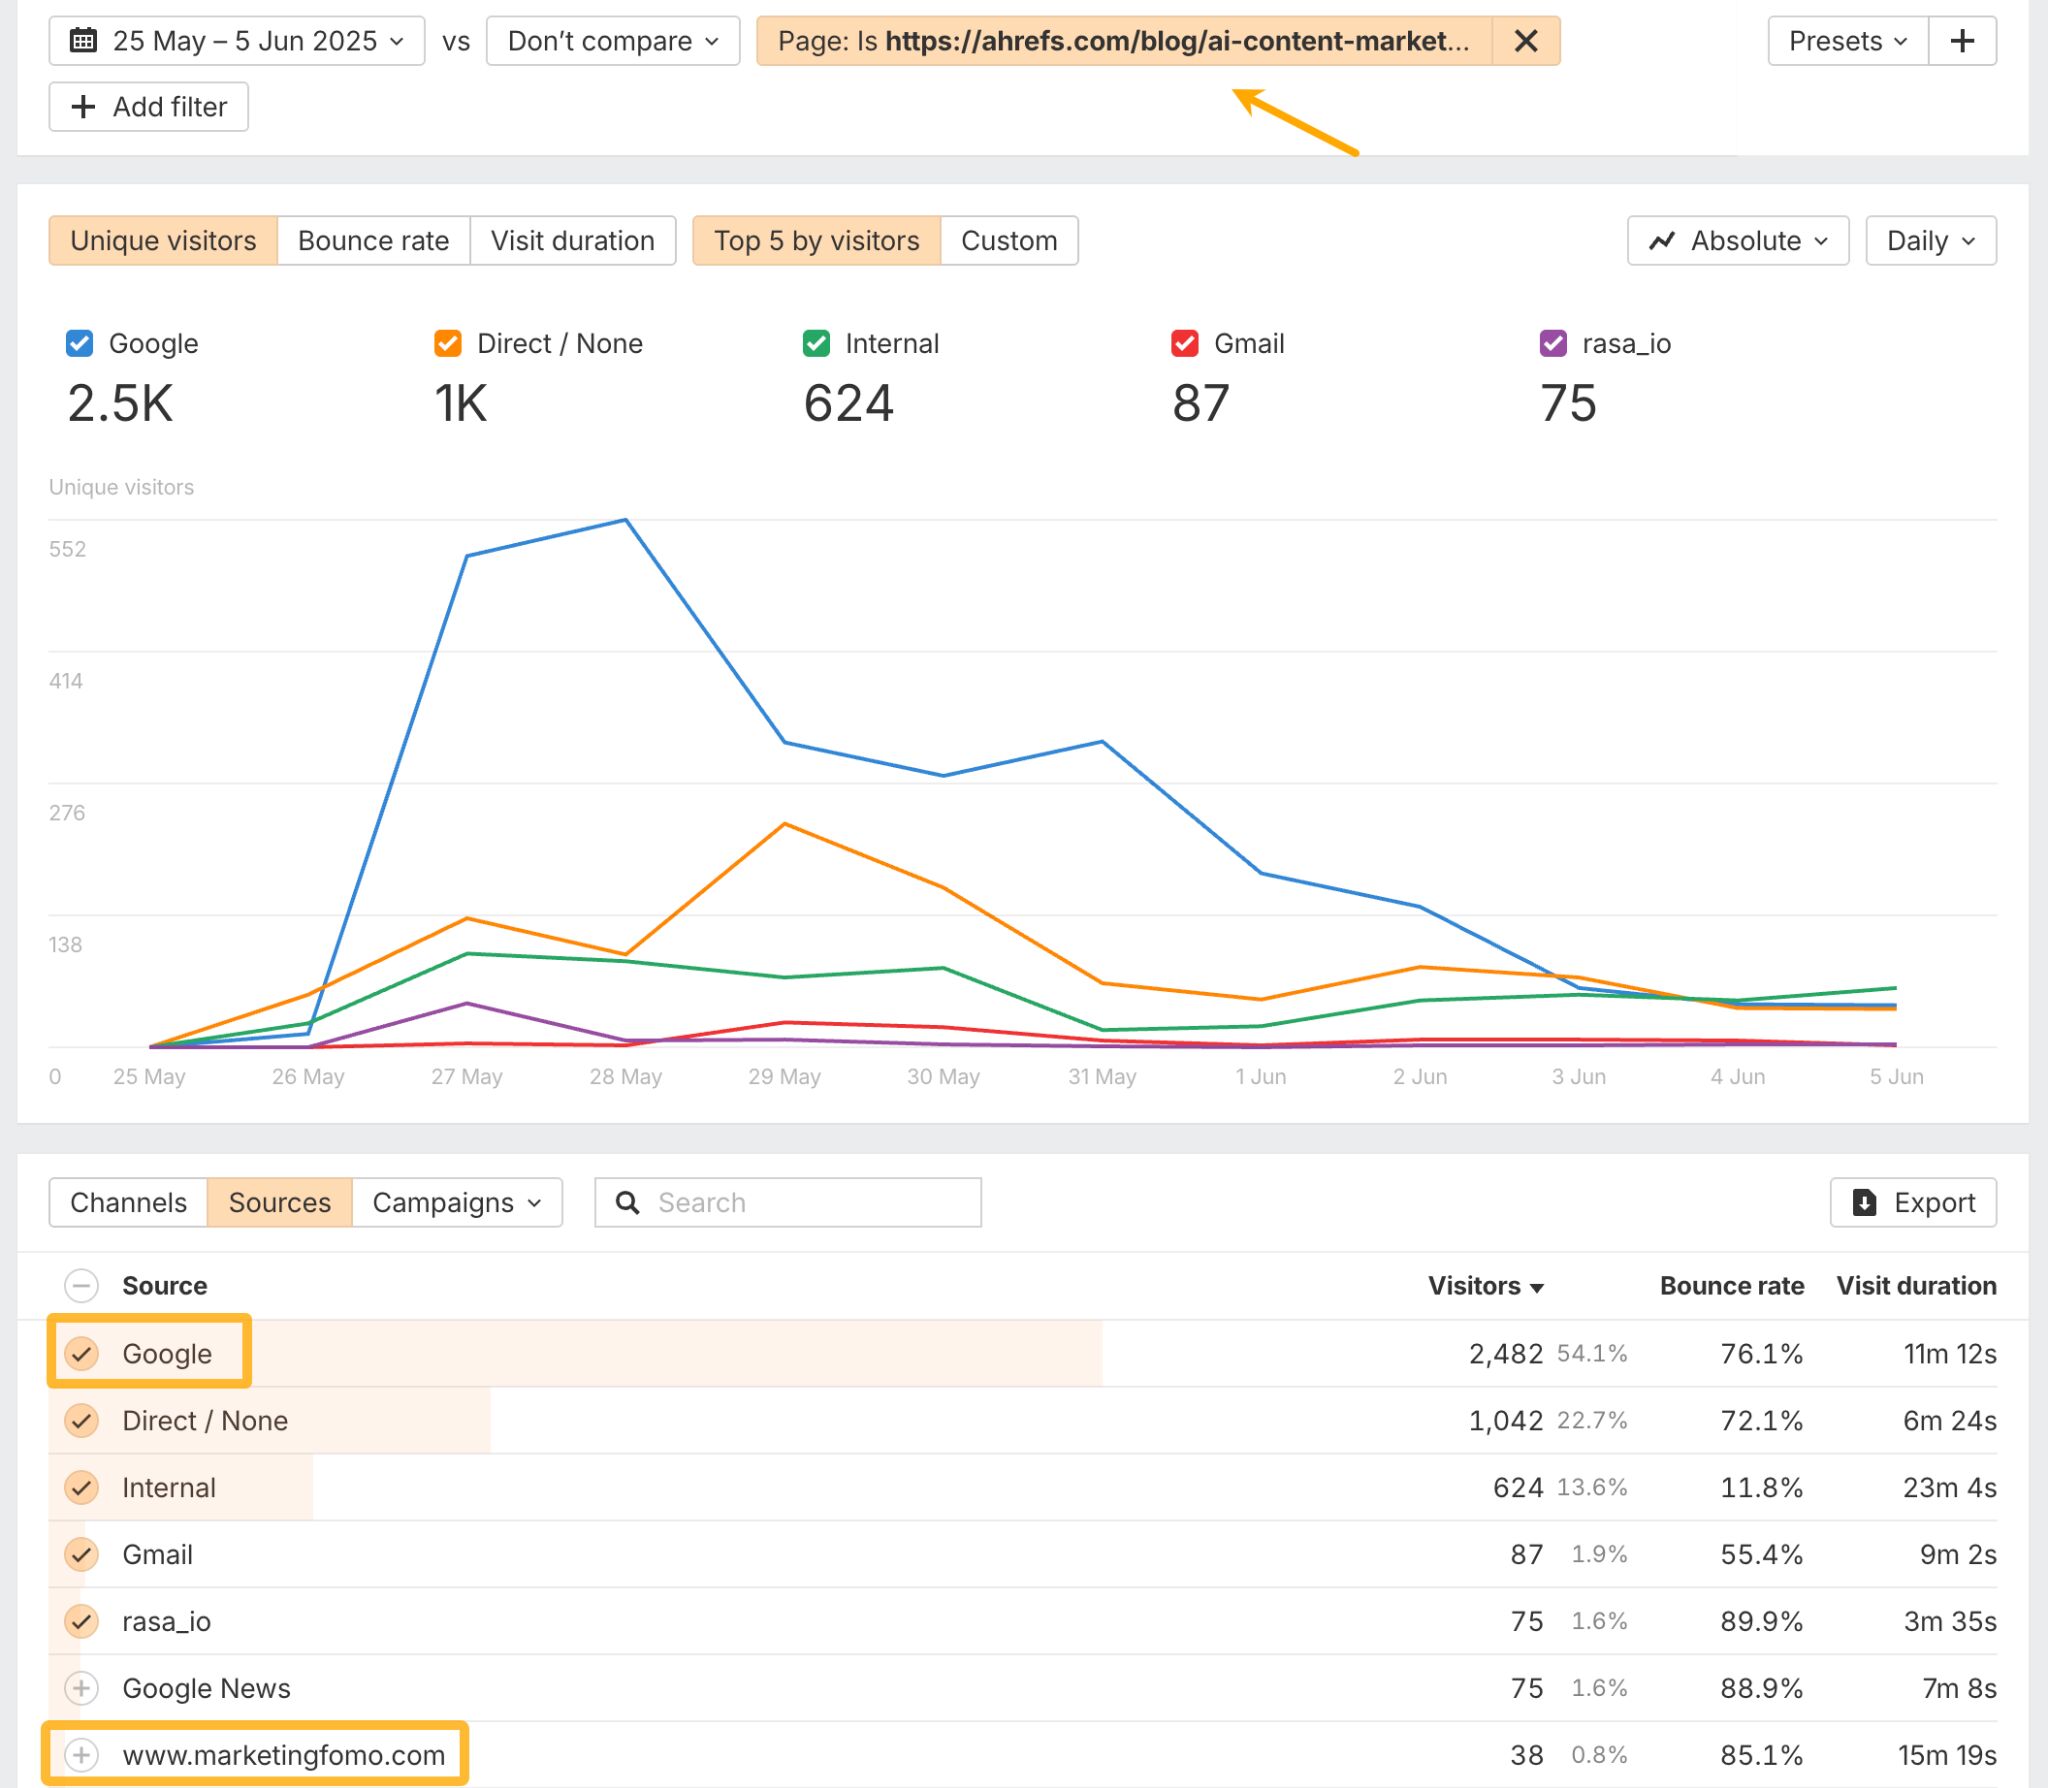
More importantly, look at what happened to those spike visitors. Did they bounce immediately, or did they stick around and explore your site? A traffic spike that brings engaged visitors who sign up for your newsletter is very different from one that brings curious but uninterested browsers.
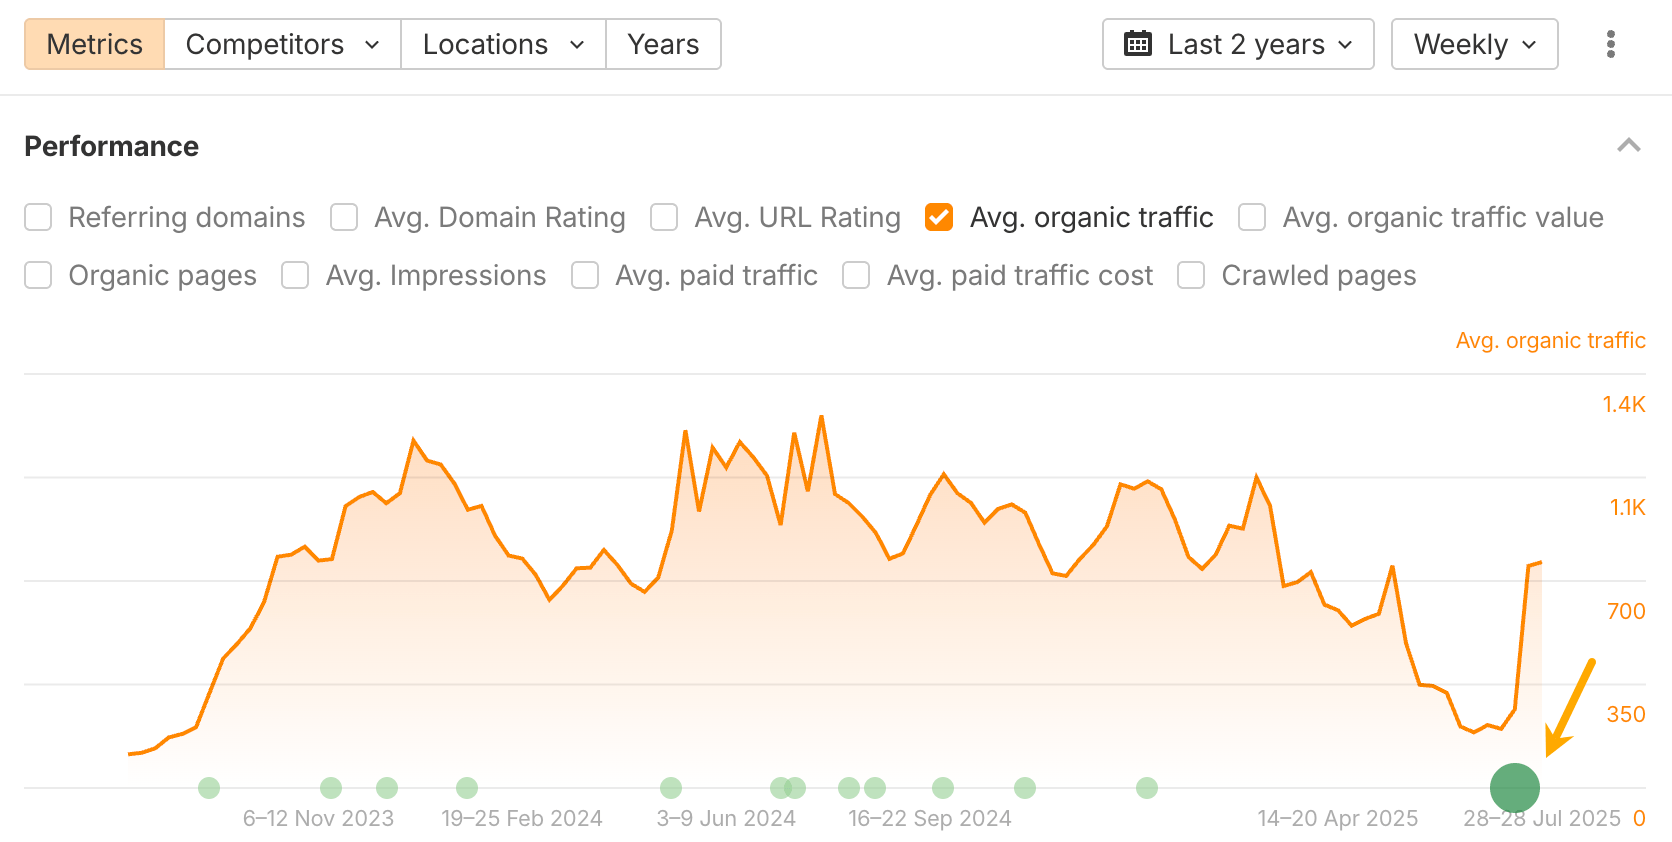
Traffic drops need quick attention. A sudden dip could mean anything from server problems to a Google penalty, or simply that a competitor outranked you. Here’s a checklist to help you investigate.
In this example, I realized my article had just gone out of date. It was already 2025, but I was still recommending tools from 2023. After updating it, the traffic returned.
Ongoing trends: the slow and steady signals
Gradual growth patterns are often more valuable than dramatic spikes because they indicate sustainable improvement. If your organic traffic increases by 10-15% each month for six consecutive months, that suggests your SEO strategy is working and your content is steadily gaining authority.
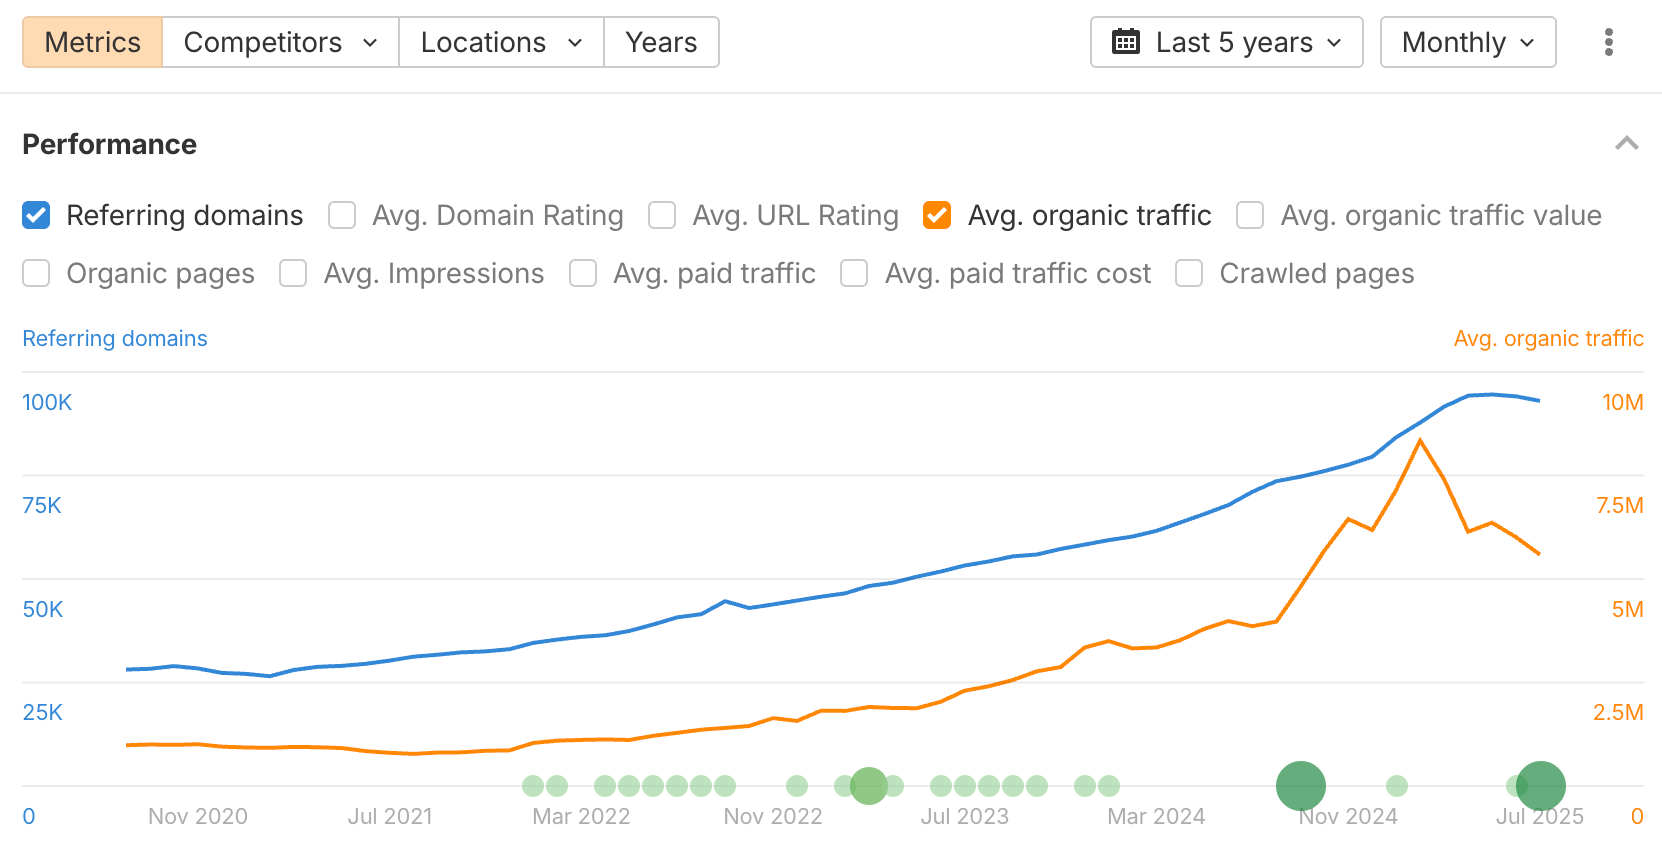
And here’s an example: the steady year-over-year growth of organic traffic and referring domains to ahrefs.com.
Seasonal patterns reveal important timing opportunities. Many businesses see predictable fluctuations. Recognizing these patterns helps you prepare content calendars, adjust marketing budgets, and set realistic expectations for different times of year.
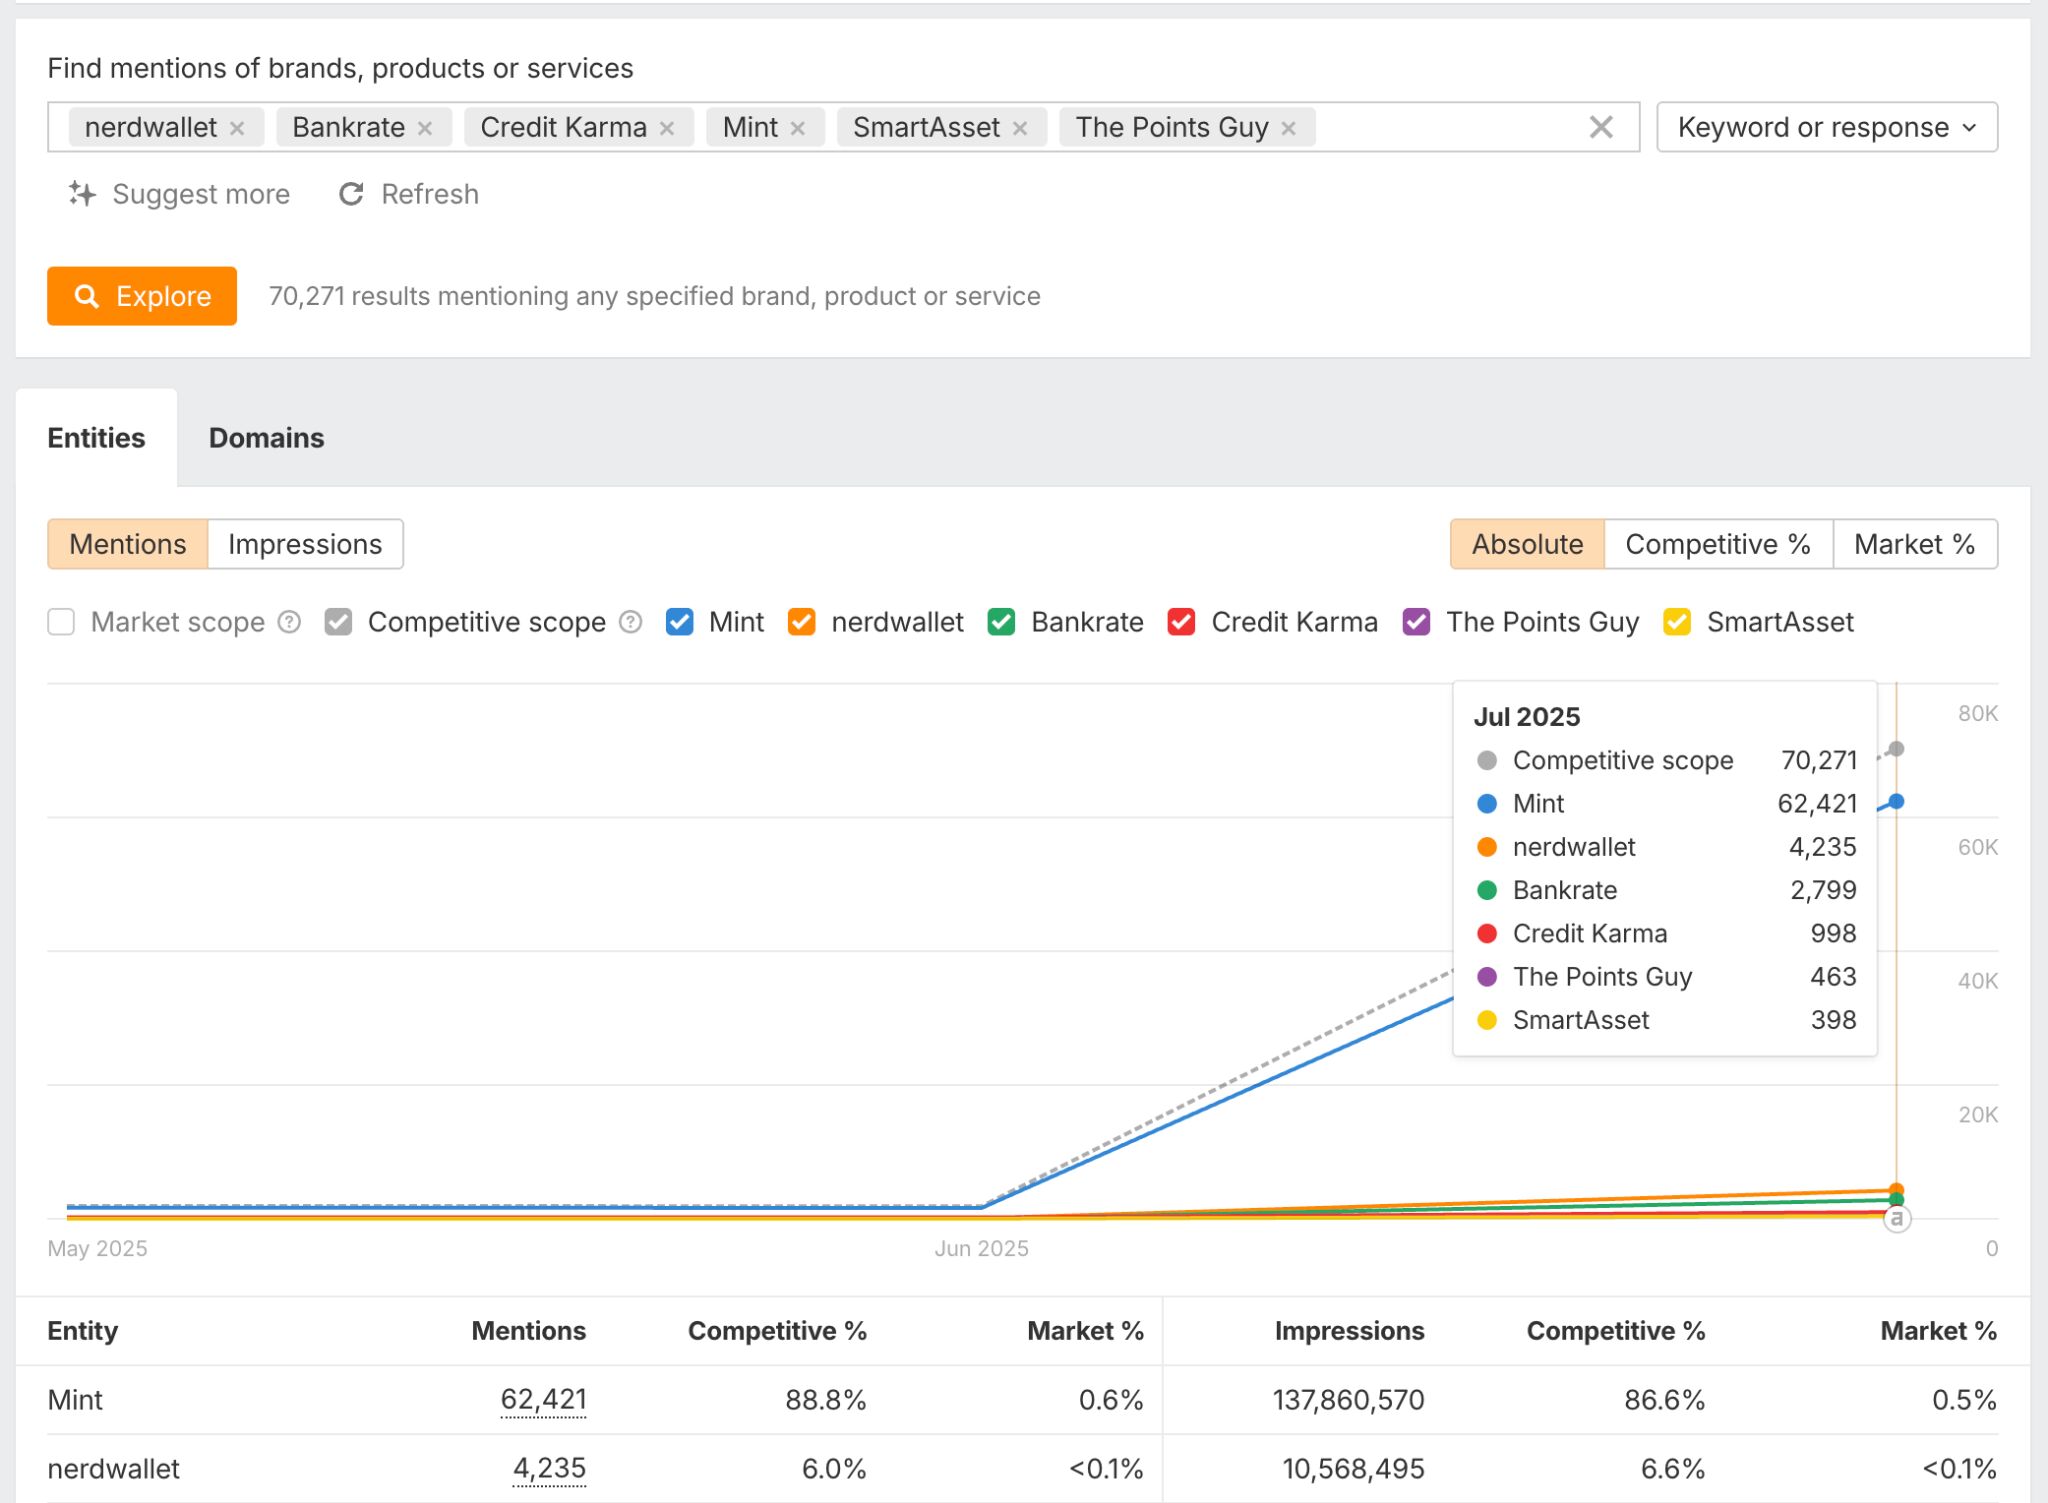
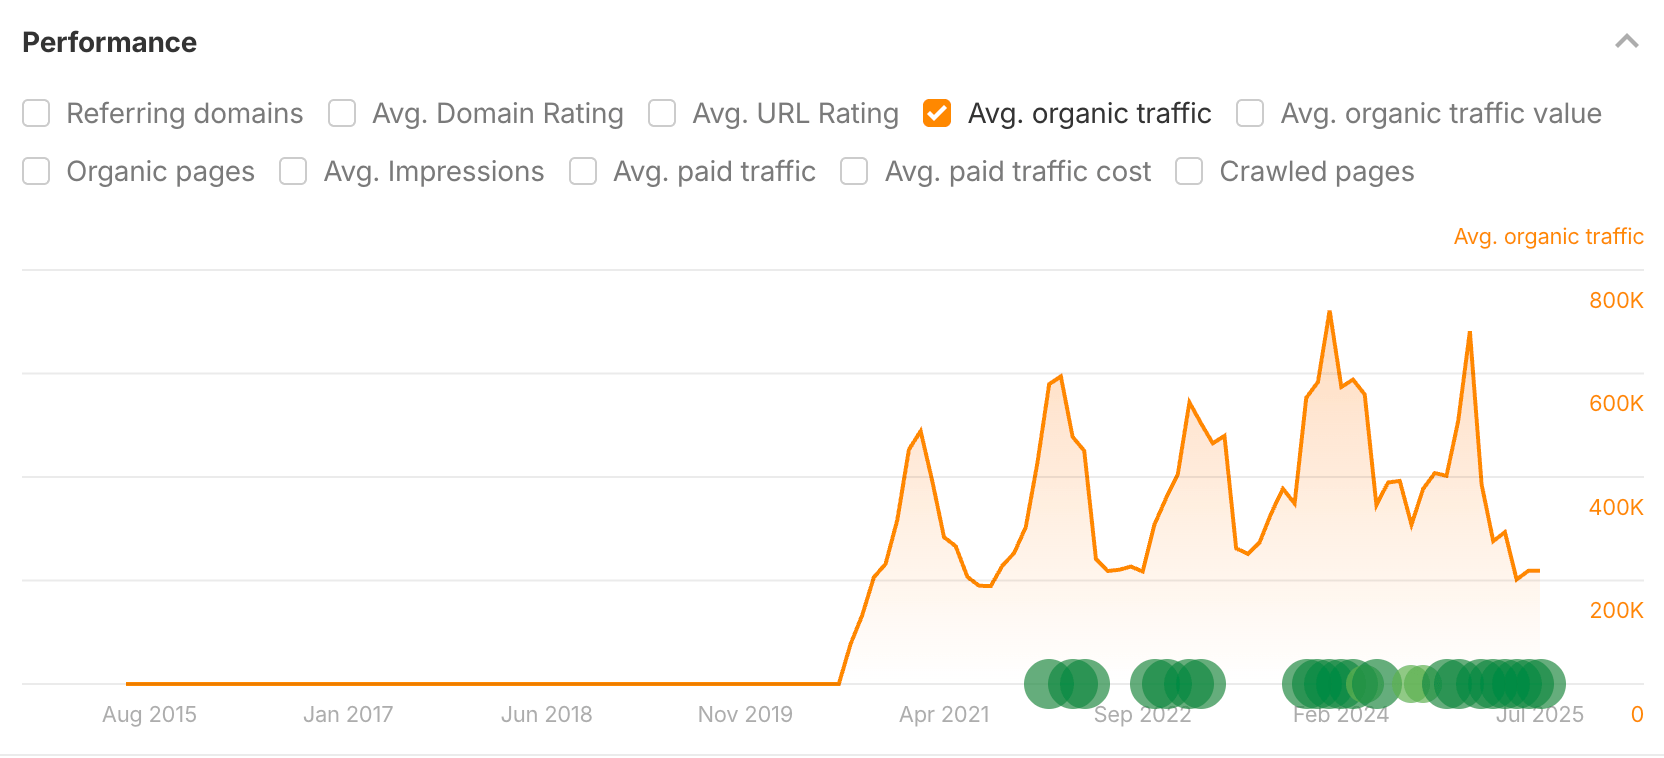
For example, Nerdwallet’s article on tax brackets shows a clear seasonal trend. No matter what they do, traffic to that page will always rise and fall at certain times of the year, because that’s simply when people are most likely to look for that information.
Correlation spotting: finding the hidden connections
The most valuable insights often come from noticing how different metrics move together. When organic traffic increases alongside time on page and conversion rates, you’re likely creating content that attracts the right audience and serves them well.
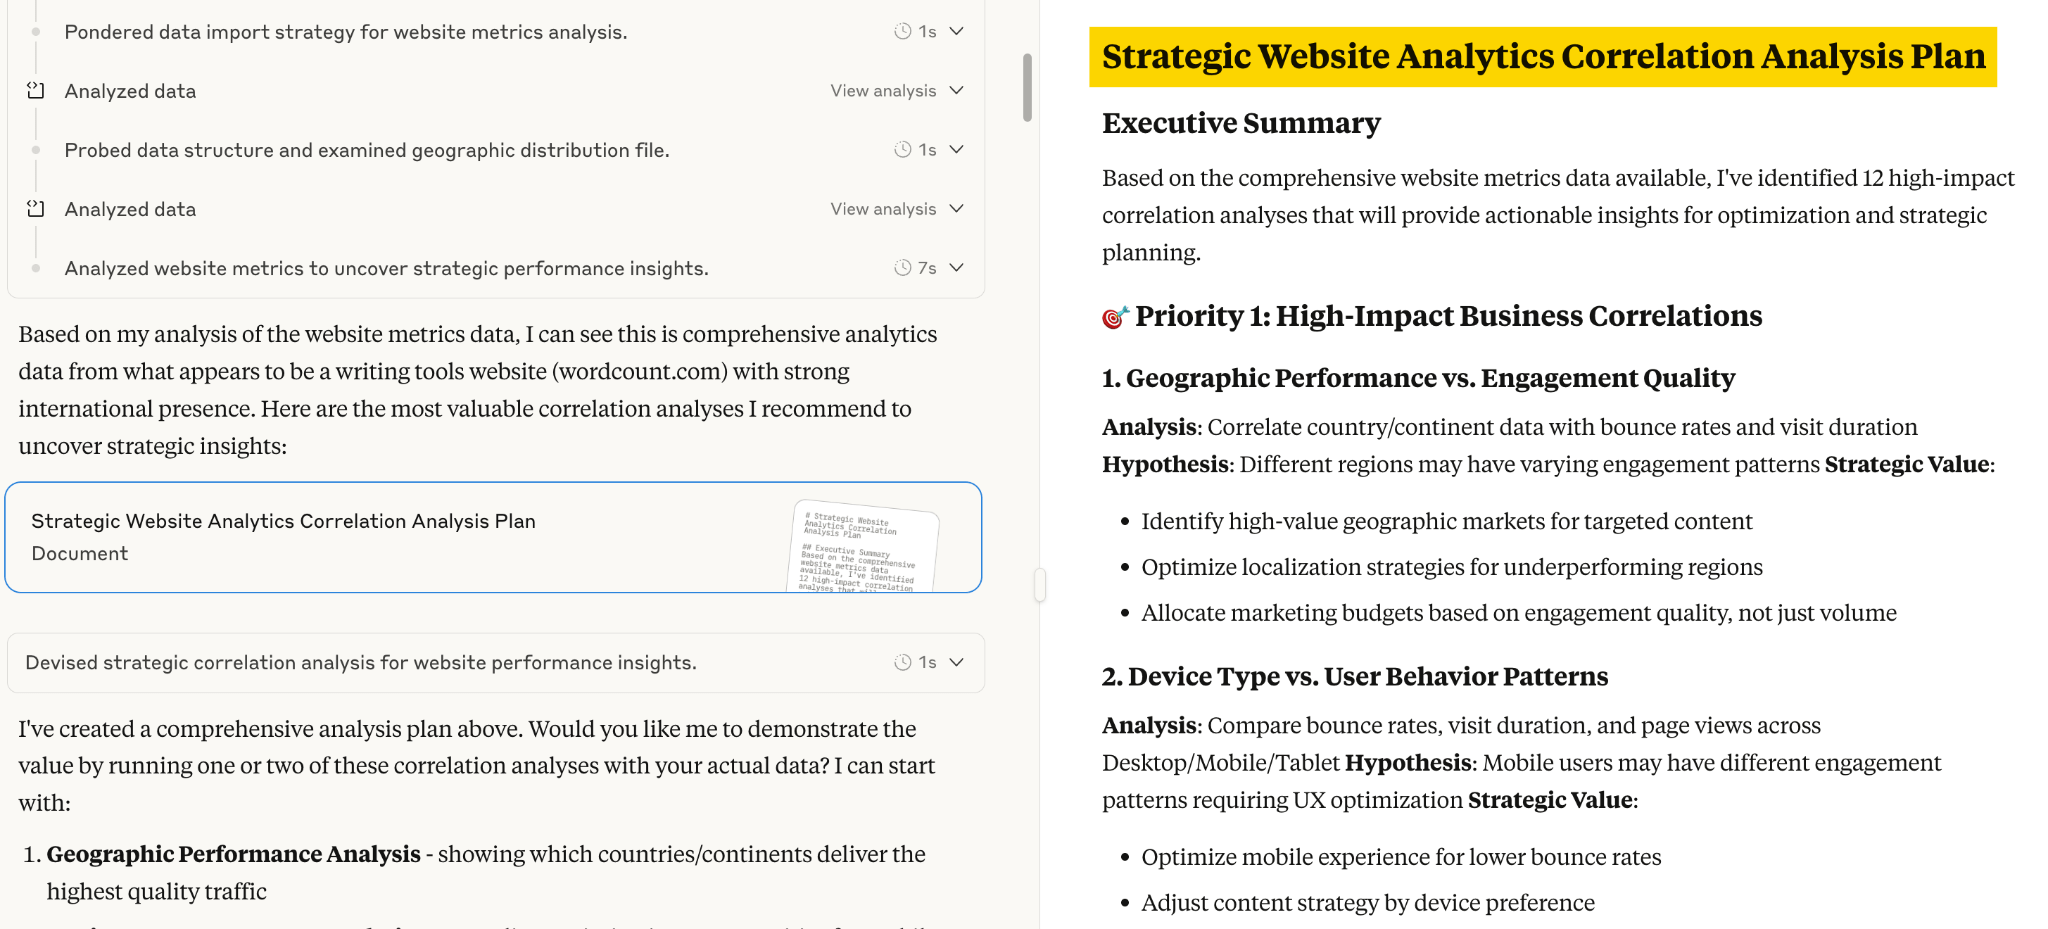
Use an AI assistant like Claude or ChatGPT to help analyze and visualize your data. Just export the data from Web Analytics (top right corner) and ask the AI to look for patterns or connections. For example, here’s an analysis plan that Claude gave to me.
Spotting these red flags early can save you from bigger issues down the line:
- Steady drop in organic traffic could mean SEO trouble, stronger competition, or technical problems stopping search engines from indexing your site.
- High bounce rates on key pages like your homepage or product pages suggest visitors aren’t finding what they expected, often due to slow load times or mismatched content.
- Low conversion rates show that while people are visiting, they’re not taking action. This usually points to a poor user experience or unclear calls to action.
- Slow load times (over 3 seconds) drive visitors away before your site even loads, which hurts both user experience and your rankings.
- Relying too much on one traffic source (like Google or a single social platform) puts you at risk. One algorithm update or policy change can tank your traffic overnight.
Check your analytics as often as you can act on what you find.
It’s like checking your bank account—don’t obsess over every small change, but review it often enough to catch real issues in time.
First, you can skip daily check-ins and use automated alerts instead. Daily traffic swings are normal and usually not worth stressing over. Set up alerts to flag major drops or technical issues so you stay informed without constant worry.
Weekly reviews work best for most sites. A once-a-week check helps you spot real trends and plan your next moves based on what’s actually working.
As you zoom further out—monthly, quarterly, yearly—you shift from reacting to results toward spotting patterns, measuring long-term progress, and making strategic decisions.
You can run these broader time comparisons using the top-level date filter.
Looking at your website alone only shows part of the story. Competitive analysis reveals how your growth compares to others in your space, highlights missed opportunities, and shows what’s possible when strategies are executed well.
You can start exploring your competitors with our free tools, like the Website Traffic Checker.
To get a full picture, you’ll need more advanced data. Before we wrap up this article, let me give you a quick tour of the competitive data you can uncover with the Ahrefs Starter $29/mo plan.
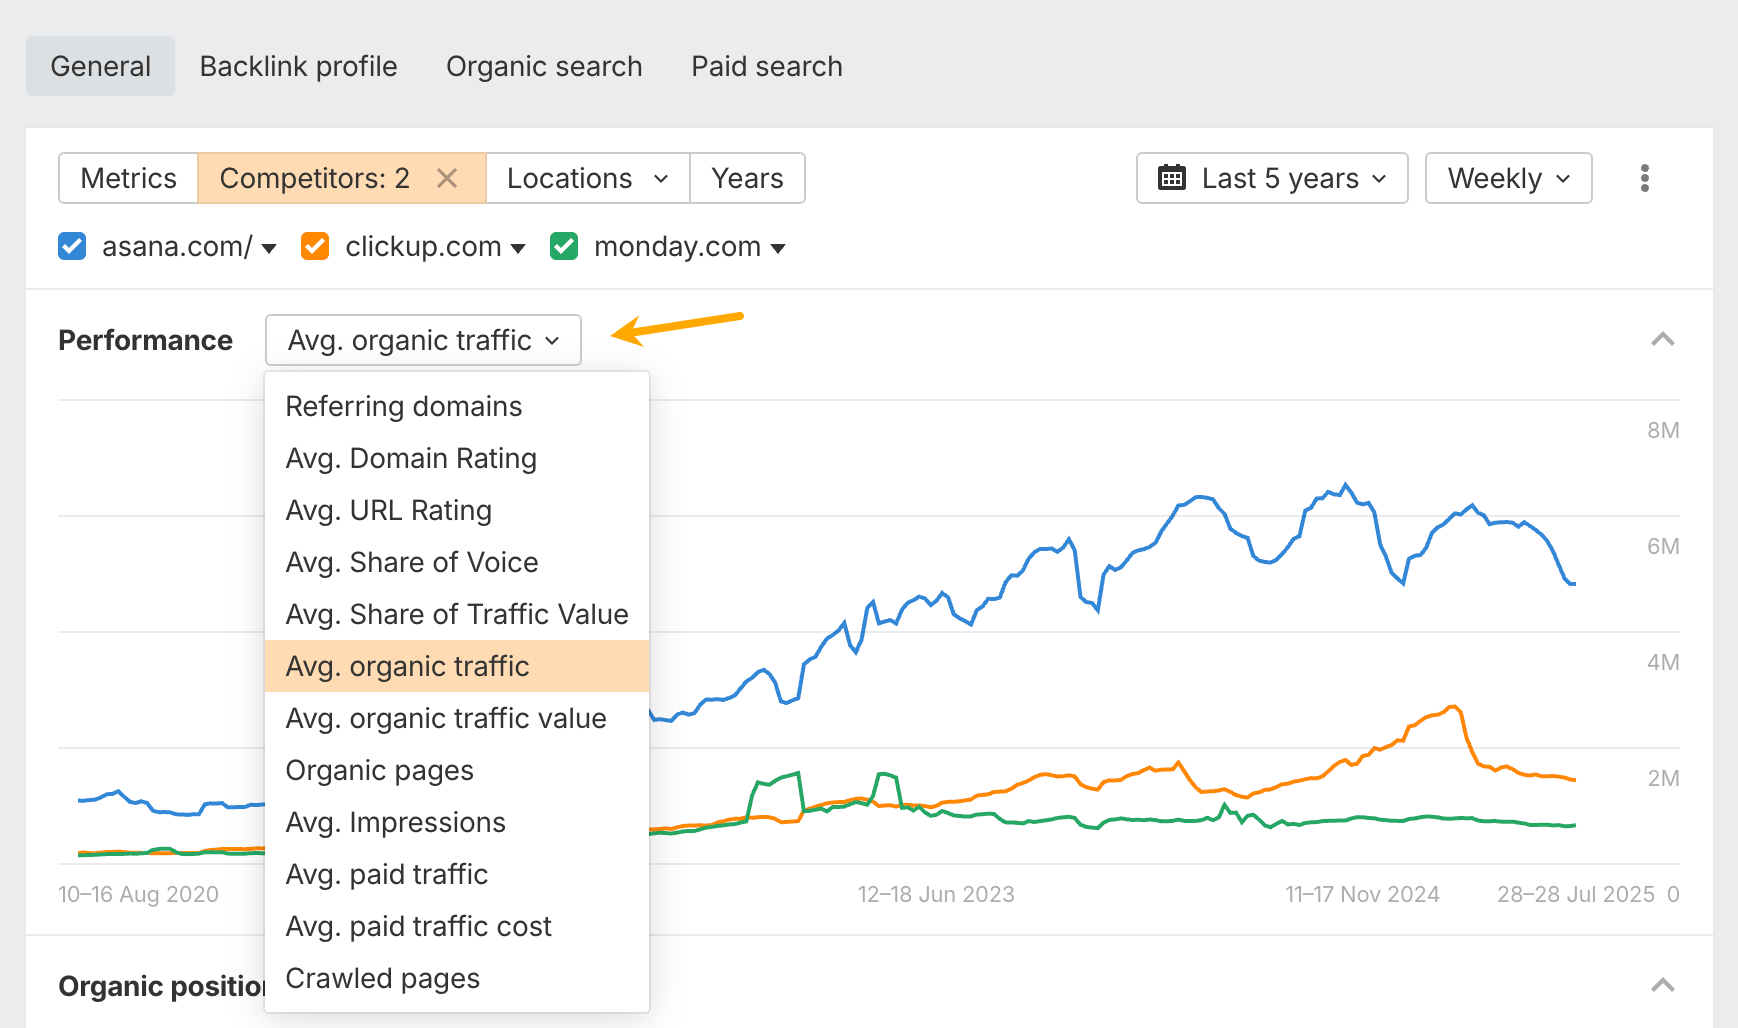
Organic traffic comparison
How many visitors come to your site through unpaid search compared to competitors? This shows you the scale of opportunity in your market. If competitors get 50,000 monthly organic visitors while you get 5,000, that gap represents potential growth if you can improve your SEO strategy.
Share of voice measures your visibility in search results versus others in your space. This shows what percentage of total search visibility in your industry you’re capturing compared to competitors.
Traffic value reveals the monetary worth of your rankings. If you had to pay for your organic traffic through ads, what would it cost? A competitor with $10,000 worth of monthly organic traffic is capturing much more valuable search terms than one with $1,000 worth, even if their visitor numbers are similar.
You can uncover all this data in Site Explorer by plugging in your competitors’ domains and choosing the type of metric from this dropdown:
And if you want to see which keywords generate traffic for your Competitors, simply open the Organic keywords report and see which ones would work for your website as well. 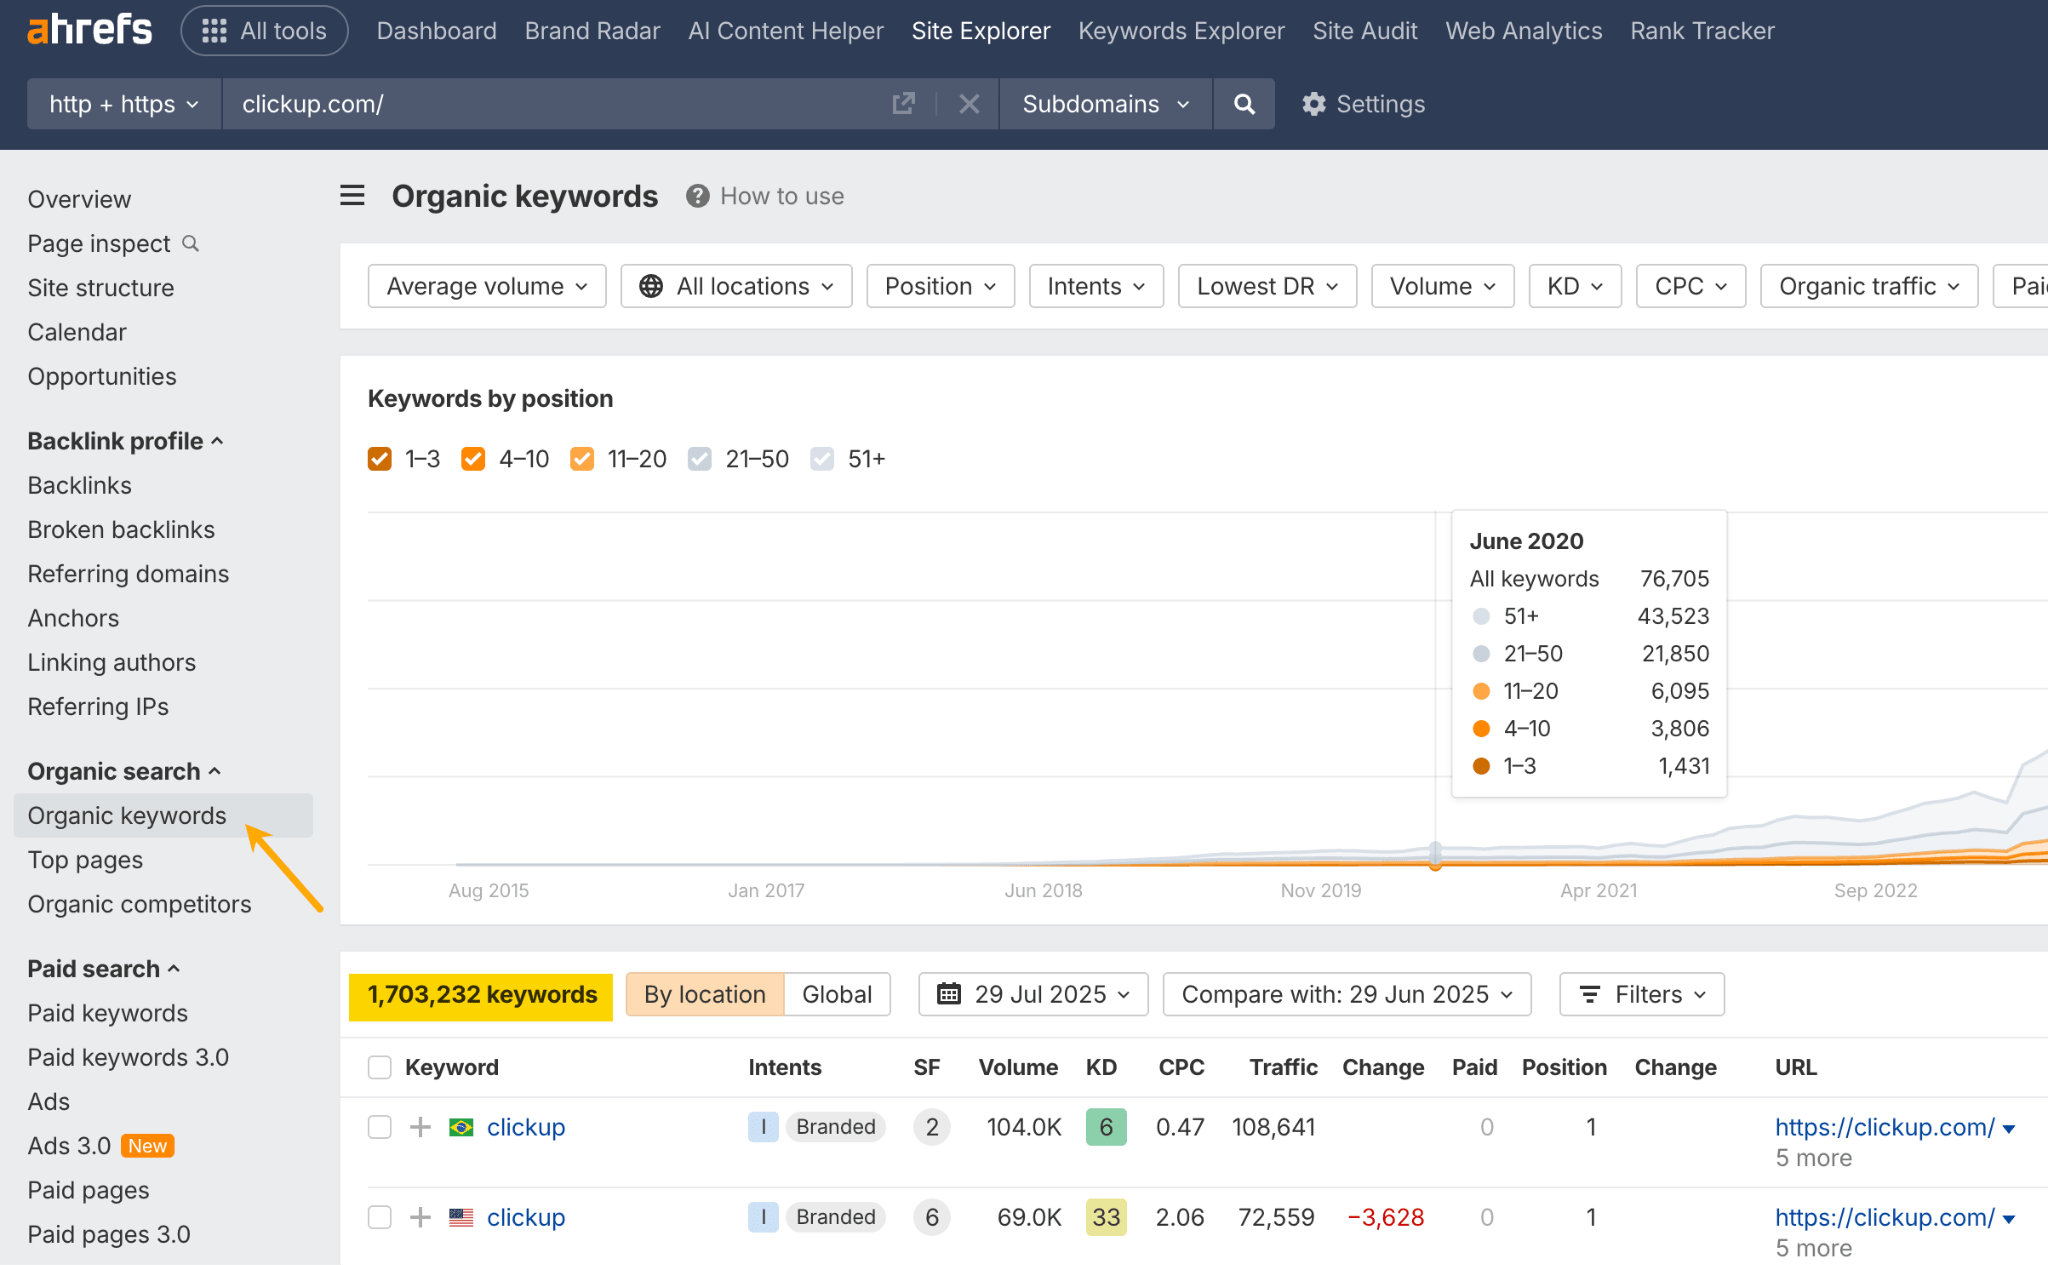
Brand recognition vs. content performance
Branded traffic shows how many people search specifically for your company name. It’s a strong sign of brand awareness and customer loyalty. If your competitors are seeing more branded searches, it likely means their brand is more recognized and in higher demand.
Unbranded traffic reveals content performance on competitive keywords. This is traffic from people searching for general topics, not brand names. High unbranded traffic means your content ranks well for broader, competitive search terms that anyone in your industry could target.
All of that data is available in Site Explorer’s Overview report.
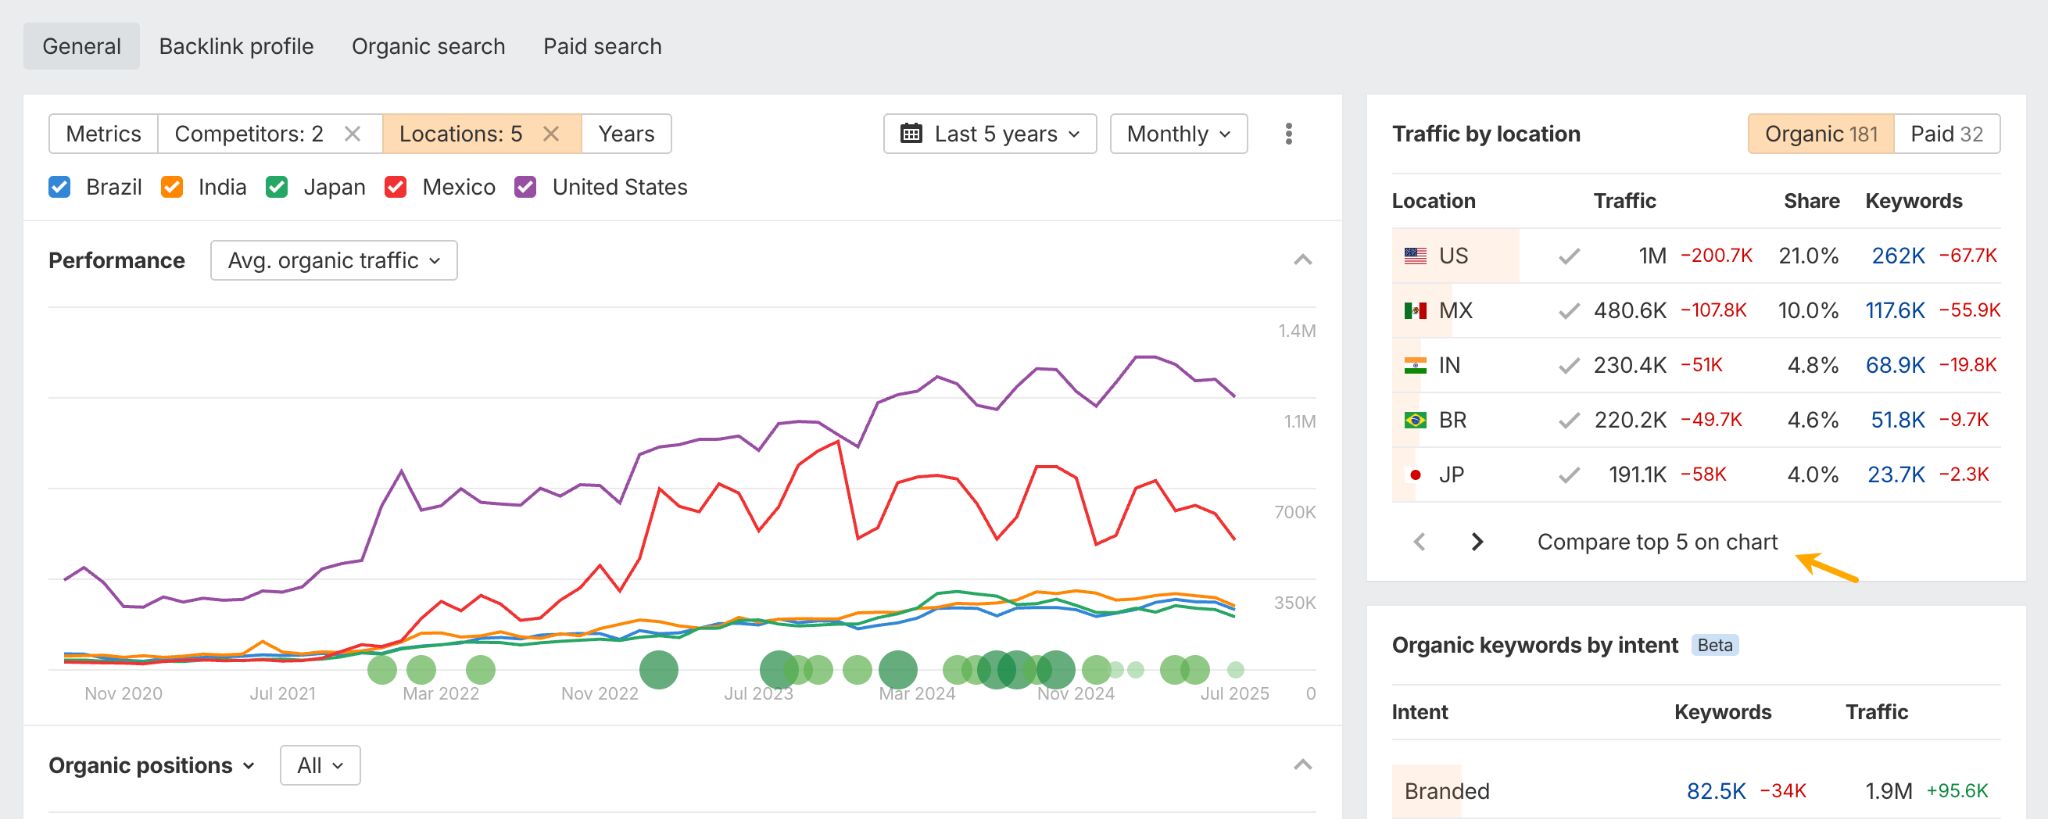
Geographic and audience insights
Where are your visitors located compared to competitors? Geographic analysis can reveal untapped markets. If competitors get significant traffic from regions where you have little presence, those areas might represent expansion opportunities.
All you need to do here is plug in your competitors’ domains in the Overview and click on the Compare top 5 on the chart, as shown below.
Backlink profile comparison
How many websites link to yours, and how does that compare to competitors? More importantly, what’s the quality difference? A competitor with 500 high-quality backlinks from respected industry sites will typically outperform one with 5,000 low-quality directory links.
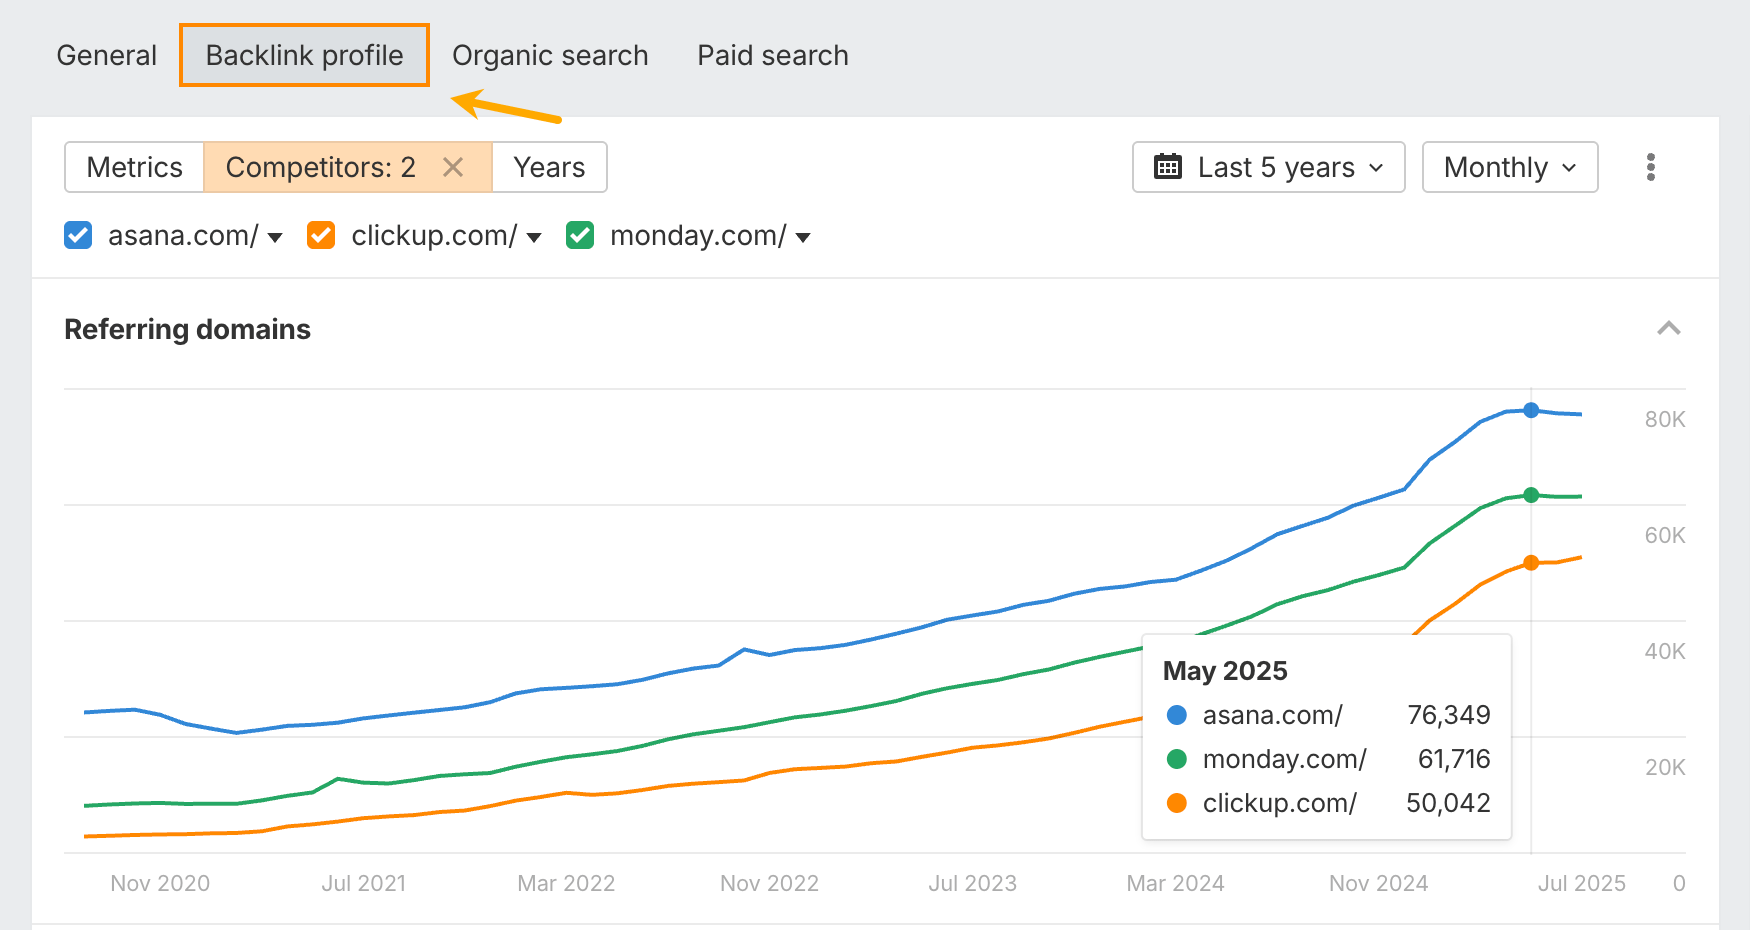
To see where competitors get their backlinks, click on the Backlinks report.
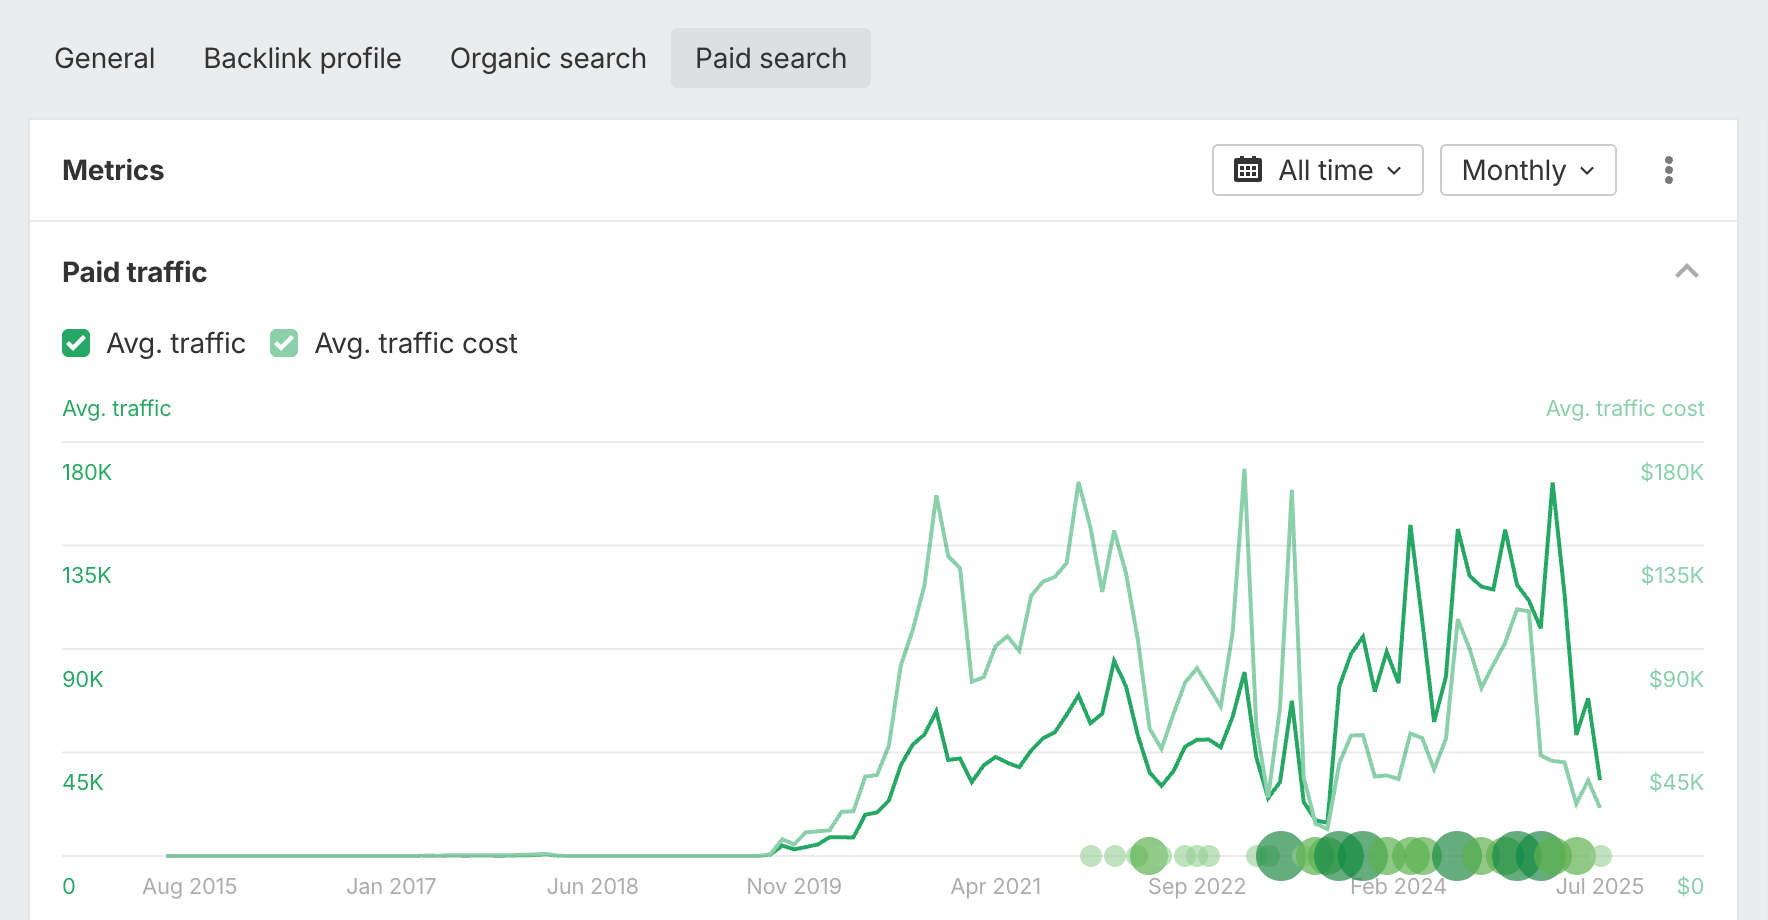
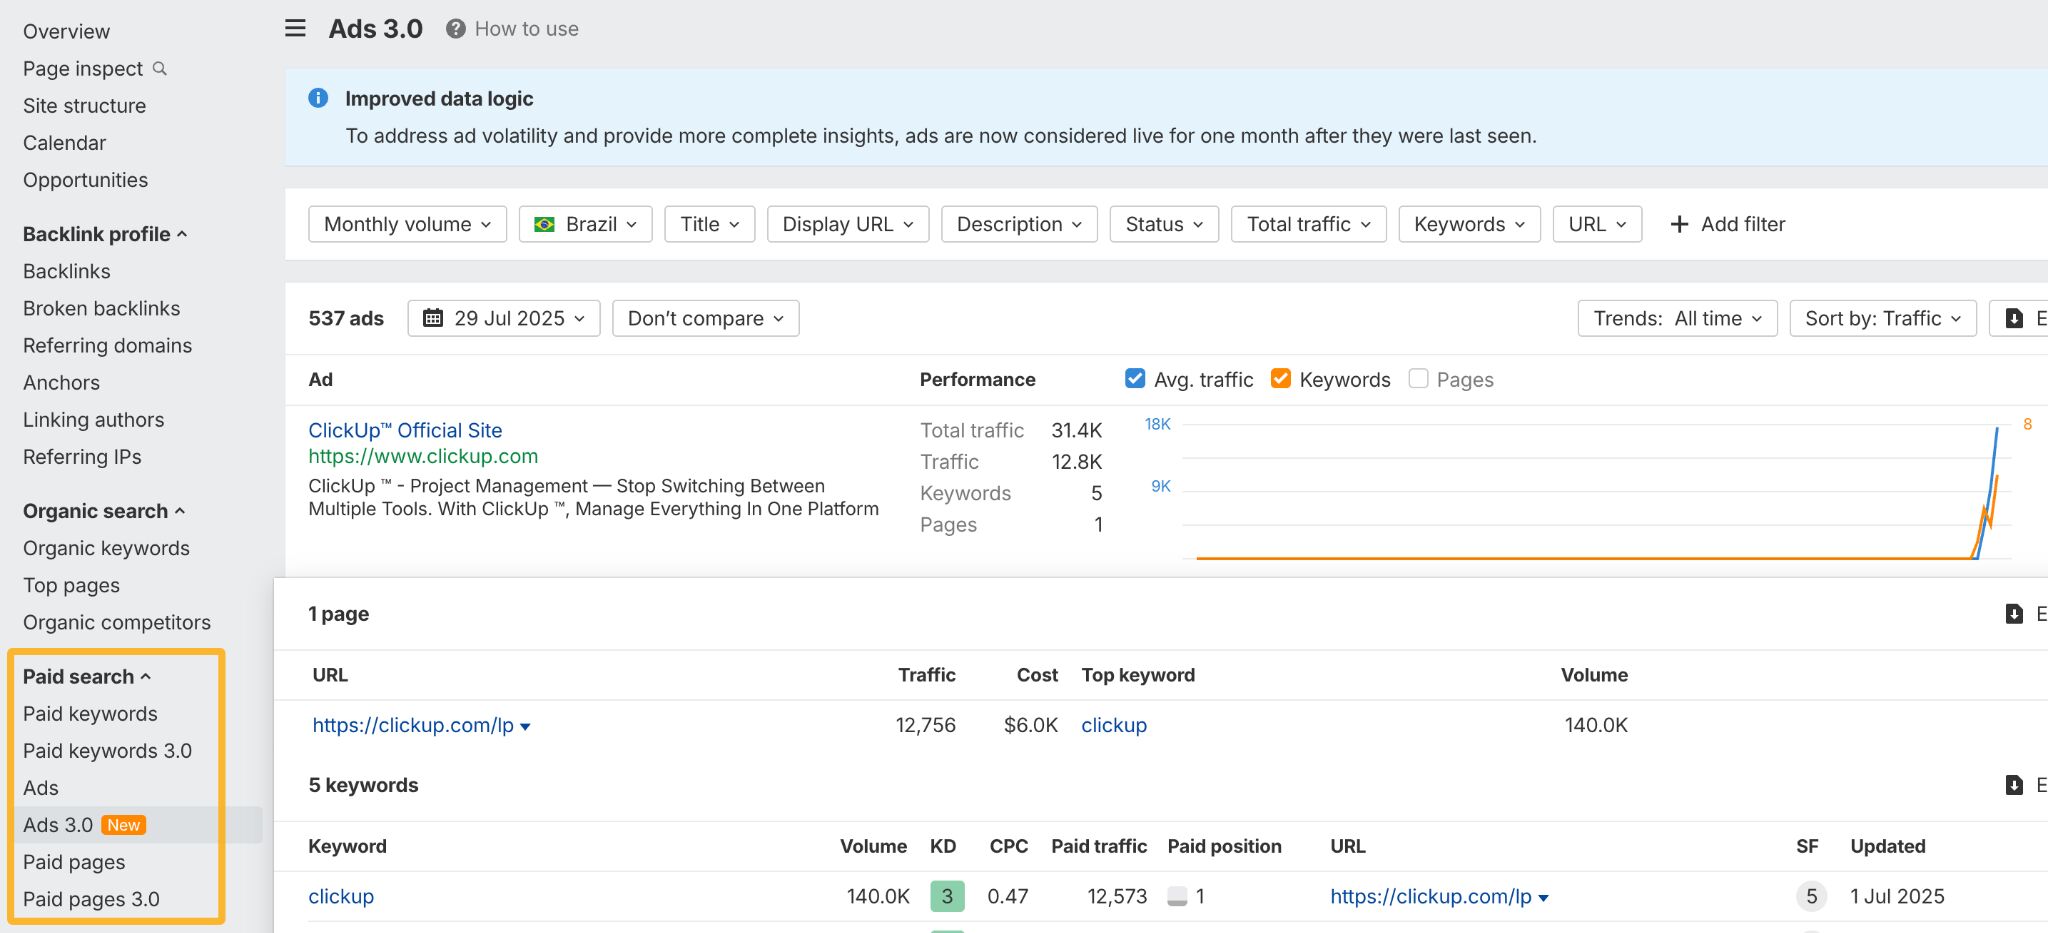
Paid search competitive intelligence
Top-level paid search analysis reveals which competitors are running ads, how much they’re likely spending, and how much traffic they’re getting from it. If they’re consistently investing in paid search, it’s a strong sign that it’s working for them, and worth considering in your own strategy.
Just open the Overview report in Site Explorer and click on the Paid search tab.
Ad copy, keyword, and landing page insights reveal what messaging works for others in your space, helping you craft better campaigns and identify differentiation opportunities.
You can check all of the above in the Paid search reports.
In case you need to report your metrics to a boss or client, here’s how to make it count.
- Keep it short. Your report should take under five minutes to read. Use bullet points and lead with your most important insights. Save the details for follow-up discussions.
- Tailor it to your audience. A CEO wants to know if the investment is paying off. A marketing manager needs to see what to tweak. A content team wants direction on what to create next. Shape your report to match what each person needs.
- Use meaningful numbers. Go beyond raw stats—connect metrics to results. Instead of saying “We had 15,000 visitors this month,” explain “Organic traffic grew 25% this month, with our how-to guides driving 40% of that growth and converting twice as well as our older content.”
- Always include next steps. Every insight should lead to an action. Don’t just report issues—share what you plan to do next, and be specific.
And remember, AI can help with this too. Tools like Claude or Gemini can even generate interactive reports based on exported data from Ahrefs’ tools.
Final thoughts
Website metrics don’t have to be complicated to be powerful. Focus on the four core types, track them consistently over time, and look for patterns that guide your decisions rather than getting lost in daily fluctuations.
Got questions or comments? Let me know on LinkedIn.