
Look at their SEO reports.
- Bad SEO reports – Don’t communicate the work you’ve done effectively
- Good SEO reports – Share useful insights and provide a logical overview of the work
I’ve seen many SEO reports from consultants, in-house teams, and agencies. I discussed them with SEO experts from our Ahrefs Insider community.
Using this knowledge, I’ve created an SEO report template that you can build on and expand yourself to create your very own SEO report.
To get started, make a copy of our SEO report template and personalize it to your client’s needs. You’ll have a perfect SEO report in no time.
But before you steal our SEO report template, let’s consider the following:
An SEO report is an overview of important SEO metrics reflecting business growth, performance in search engines, backlink portfolio strength, and website health.
It’s the main resource for your clients, managers, or bosses that tracks the progress of your work and its impact. After all, these stakeholders want to see that their investment in SEO is returned.
While you can’t always win at SEO every month, an effective SEO report should convey that your work will return a positive ROI in the long term.
This leads us nicely to…
While the content of an SEO report largely depends on a client’s business type, most SEO slide deck reports usually contain the following:
- Title Card – The front page of your SEO report
- Executive summary – Bulleted summary of the most important points from the report
- Performance summary – An overview of your SEO performance for the time period
- Organic traffic – Chart of your organic traffic performance over the tie period
- SEO KPIs – Evaluate SEO metrics that are closely tied to revenue growth, like conversions, organic traffic
- Keyword rankings – See how rankings of the most important keywords have changed
- Winner and loser keywords
- Links – Share the most relevant updates with the website’s link profile
- New and lost referring domains – Share new and lost referring domains
- Backlink growth – Share new, valuable referring pages that drive traffic and/or pass link equity
- Link opportunities – Identify areas for improvement
- Content – Provide an update on the website’s content performance
- Content performance – Provide a detailed look at content performance
- Content opportunities – Share relevant content opportunities
- Technical SEO
- SEO health – Know that the website is doing well from the technical SEO perspective
- Next steps – Outlining the most important SEO tasks to be completed in the next time period
Your work doesn’t end with just dumping a bunch of metrics into a document. You’ll need to interpret them and provide useful commentary.
Your SEO reports should convey the impact of your work in the most succinct and coherent way possible.
Now, let’s get back to the expectations between you and your client. The report should primarily contain what you’ve previously discussed. If you sent an SEO report without educating the client beforehand, you’d get a lot of questions and demands to show more data. This is even if the SEO report is perfect. That’s because you’re the SEO expert, not the client.
I’ll explain all the used metrics and data as we go through the slides later. But I also highly recommend you check out our articles on SEO KPIs and SEO metrics that actually matter.
Based on what I’ve heard, SEOs can spend anywhere from 30 minutes to a few hours per month on each SEO report. This depends on several factors:
- Your responsibilities in the project
- Complexity of the project
- Your SEO experience and knowledge
- Your data analytics experience and knowledge
- Reporting format you and your clients prefer
Let me expand on the last point. It seems most SEOs prefer using the good old PDFs and decks for reporting purposes:
Our SEO report template is also in a slide deck format because it’s the easiest to use and read for everyone. The downside is you have to go through new data every month and put it together manually.
Some seasoned marketers prefer to use data dashboards like Google Looker Studio, Tableau, or Power BI. These can take you a lot of time to set up. But they have the advantage of updating all the data automatically, saving you time in the long run.
If this seems too complex, another more simple way to keep your clients updated on your SEO progress is to use Ahrefs’ Reports, which are now built into the heart of Ahrefs.
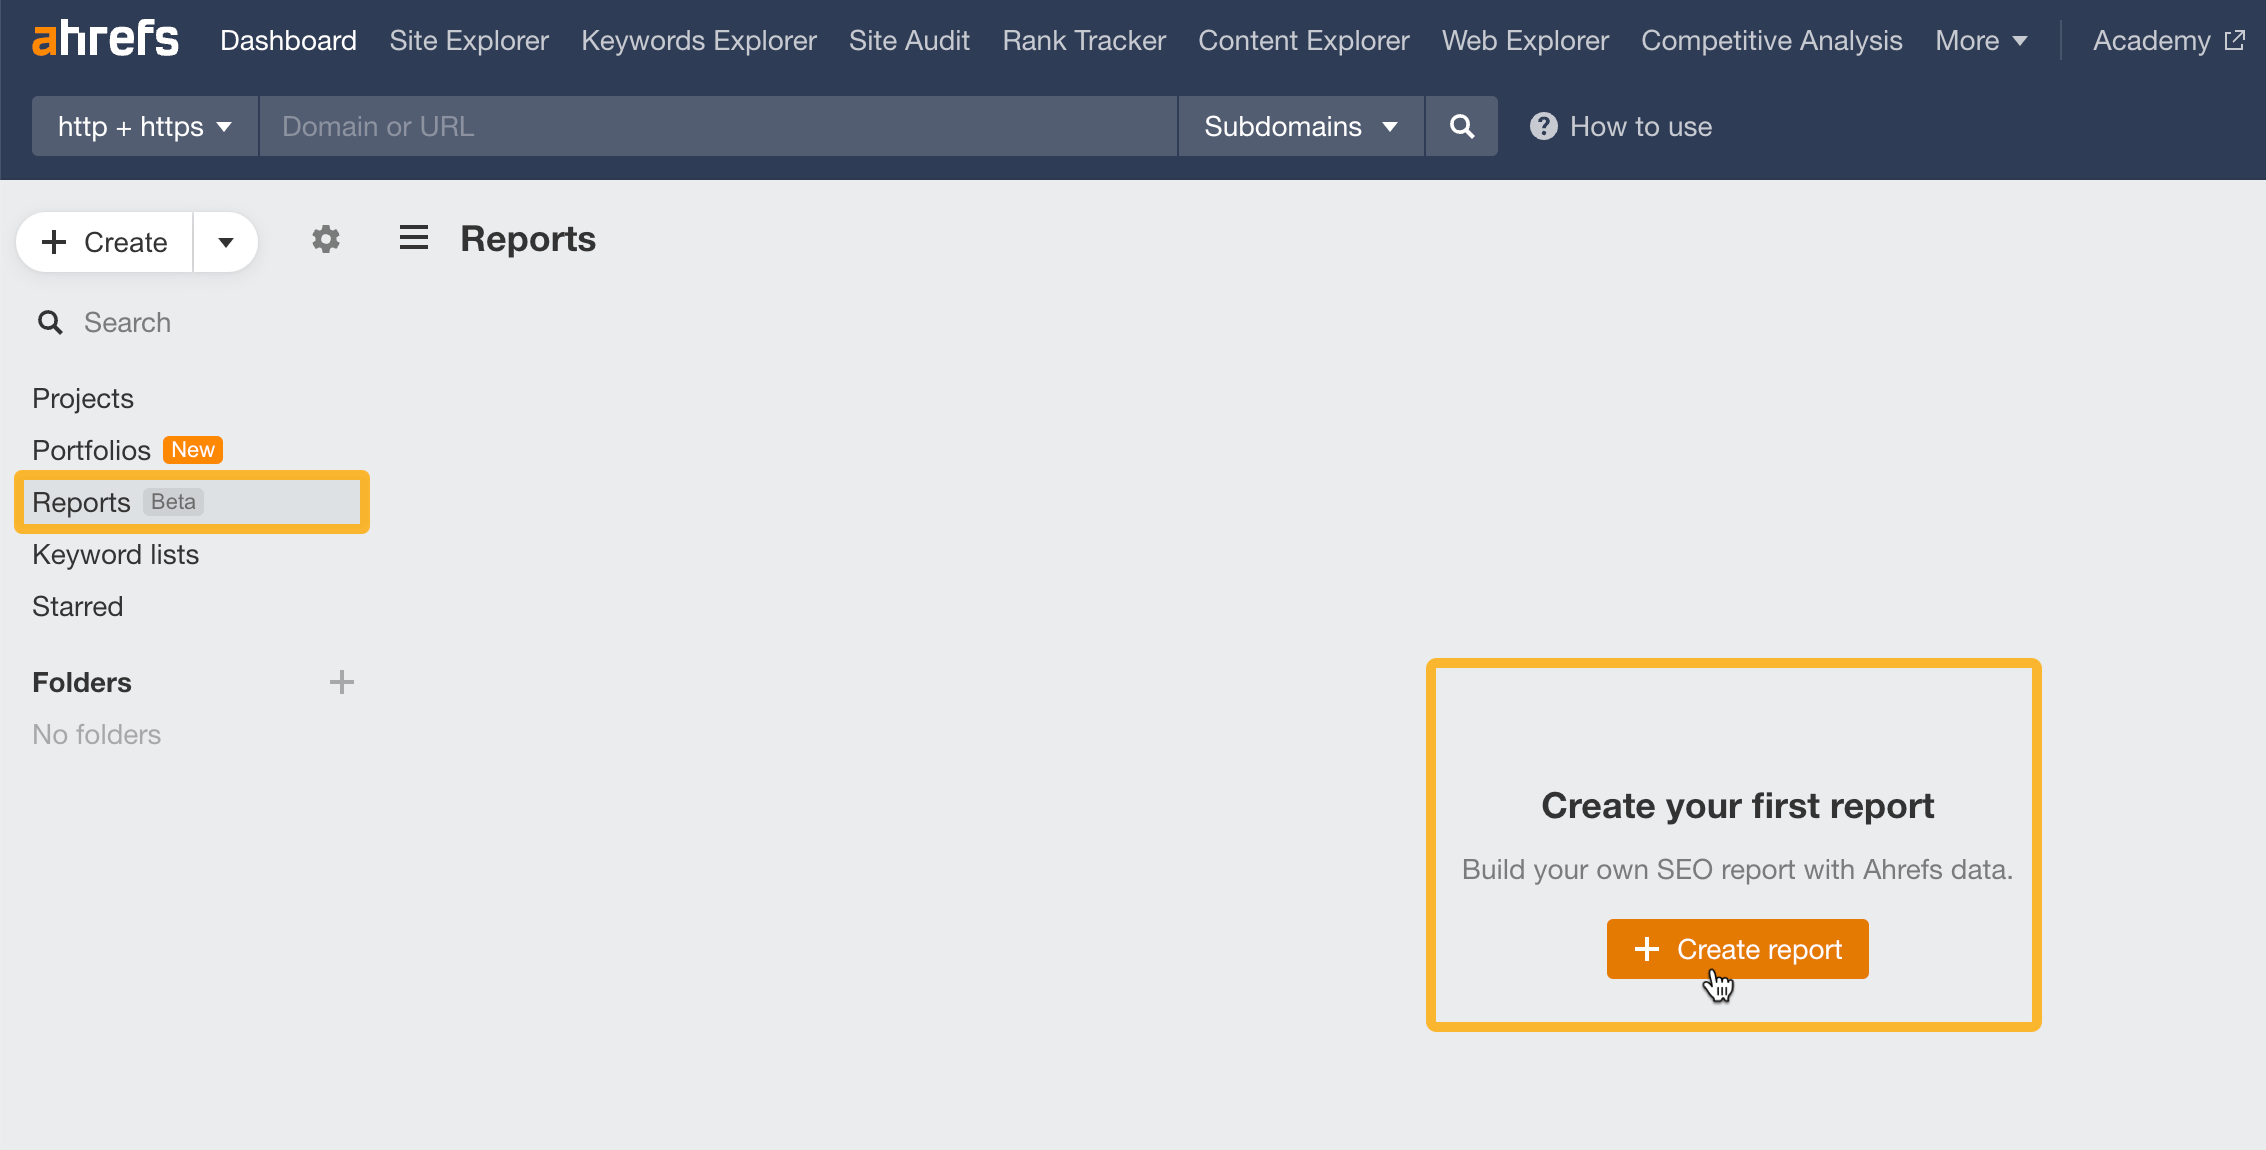
The advantage of using a tool like this is you can quickly schedule SEO reports that give an overview of performance using Ahrefs widgets.
But back to the actual template…
Our SEO report template is a great starting point to create an SEO report your clients will appreciate.
To create the report from start to finish, you’ll need the following tools:
- Ahrefs
- Google Slides
- Google Search Console
- Google Analytics (or alternatives like Ahrefs’ Web Analytics)
- An app for taking and editing screenshots
Ready?
Click here to make a copy of our updated SEO report template.
You can change the color scheme to the brand colors of your client, give it a bit of your own branding, and make it look fancier—whatever you like.
Before explaining the rationale behind each slide, let me emphasize a few things.
First of all, feel free to tailor the slides to suit your client’s needs, as well as your service offerings. We’ve made this report to cover all SEO areas for monthly reporting.
Second, the type of business you’re doing SEO for should also be reflected in the report adjustments.
If you’re doing local SEO, you’ll probably include an overview of local rankings and local SERP features. Ecommerce client? You may want to include the Average Order Value from the organic traffic and dive deeper into the technical side.
And lastly, keep in mind the template contains made-up data, insights, and scenarios. Don’t try to analyze the content of it. Rather, use its structure as a guide.
Let’s get started.
1. Title card
The first slide is the most straightforward to create.

Update the report’s date, add your logo, and add your client’s website URL. Once those are completed, you’re good to go.
2. Executive summary
An executive summary page highlights the most important information in the report. This is useful for senior stakeholders who may not have time to read the entire SEO report.
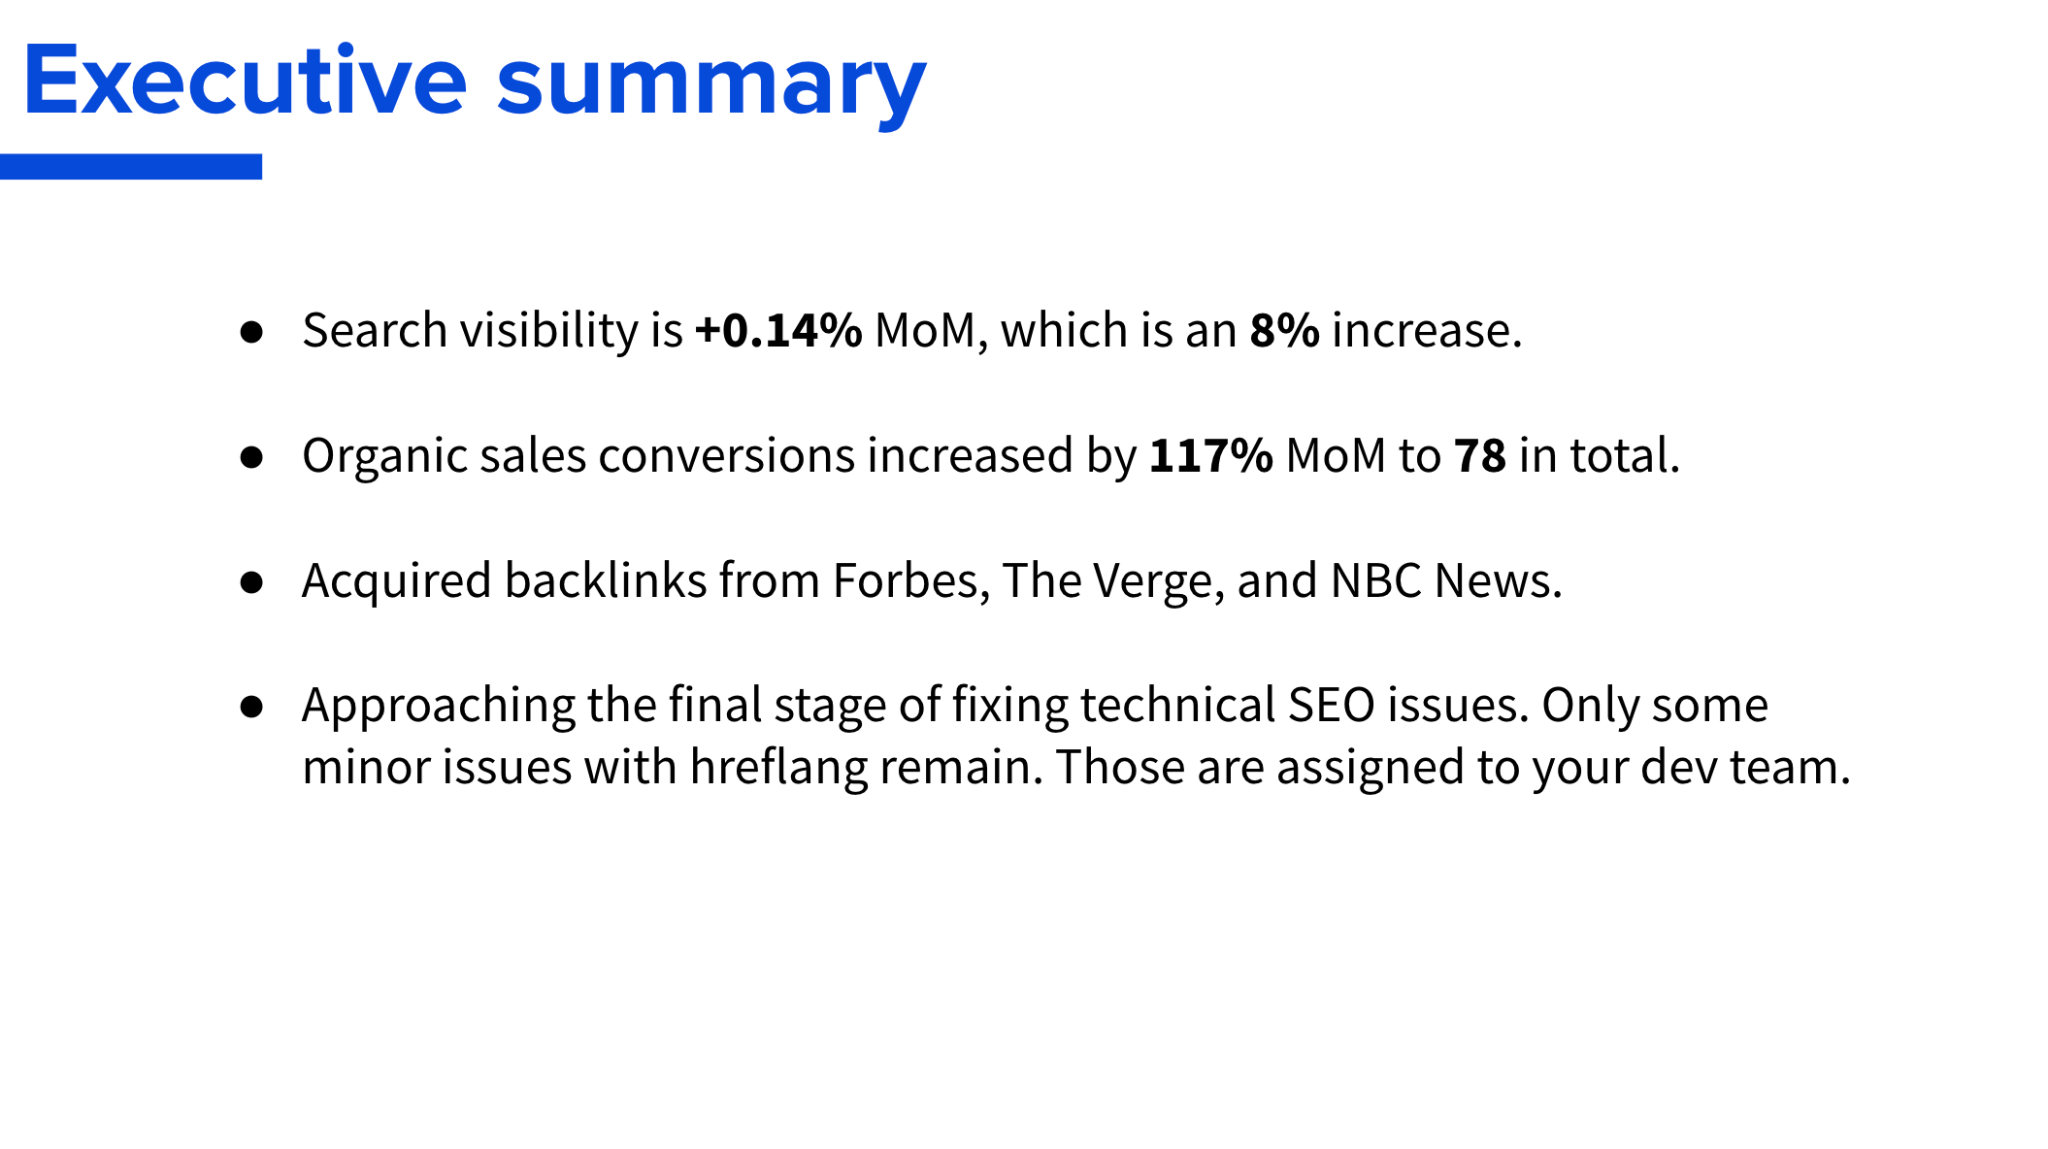
This is often the first and last slide that a CEO looks at. Thirty seconds later, they’ll say, “Great job!” and won’t bother to read the rest.
What type of things should you include in the executive summary?
- A brief summary of your SEO KPIs
- “SEO wins” worth sharing
- The most important tasks completed during that reporting period
- Tasks that require further attention
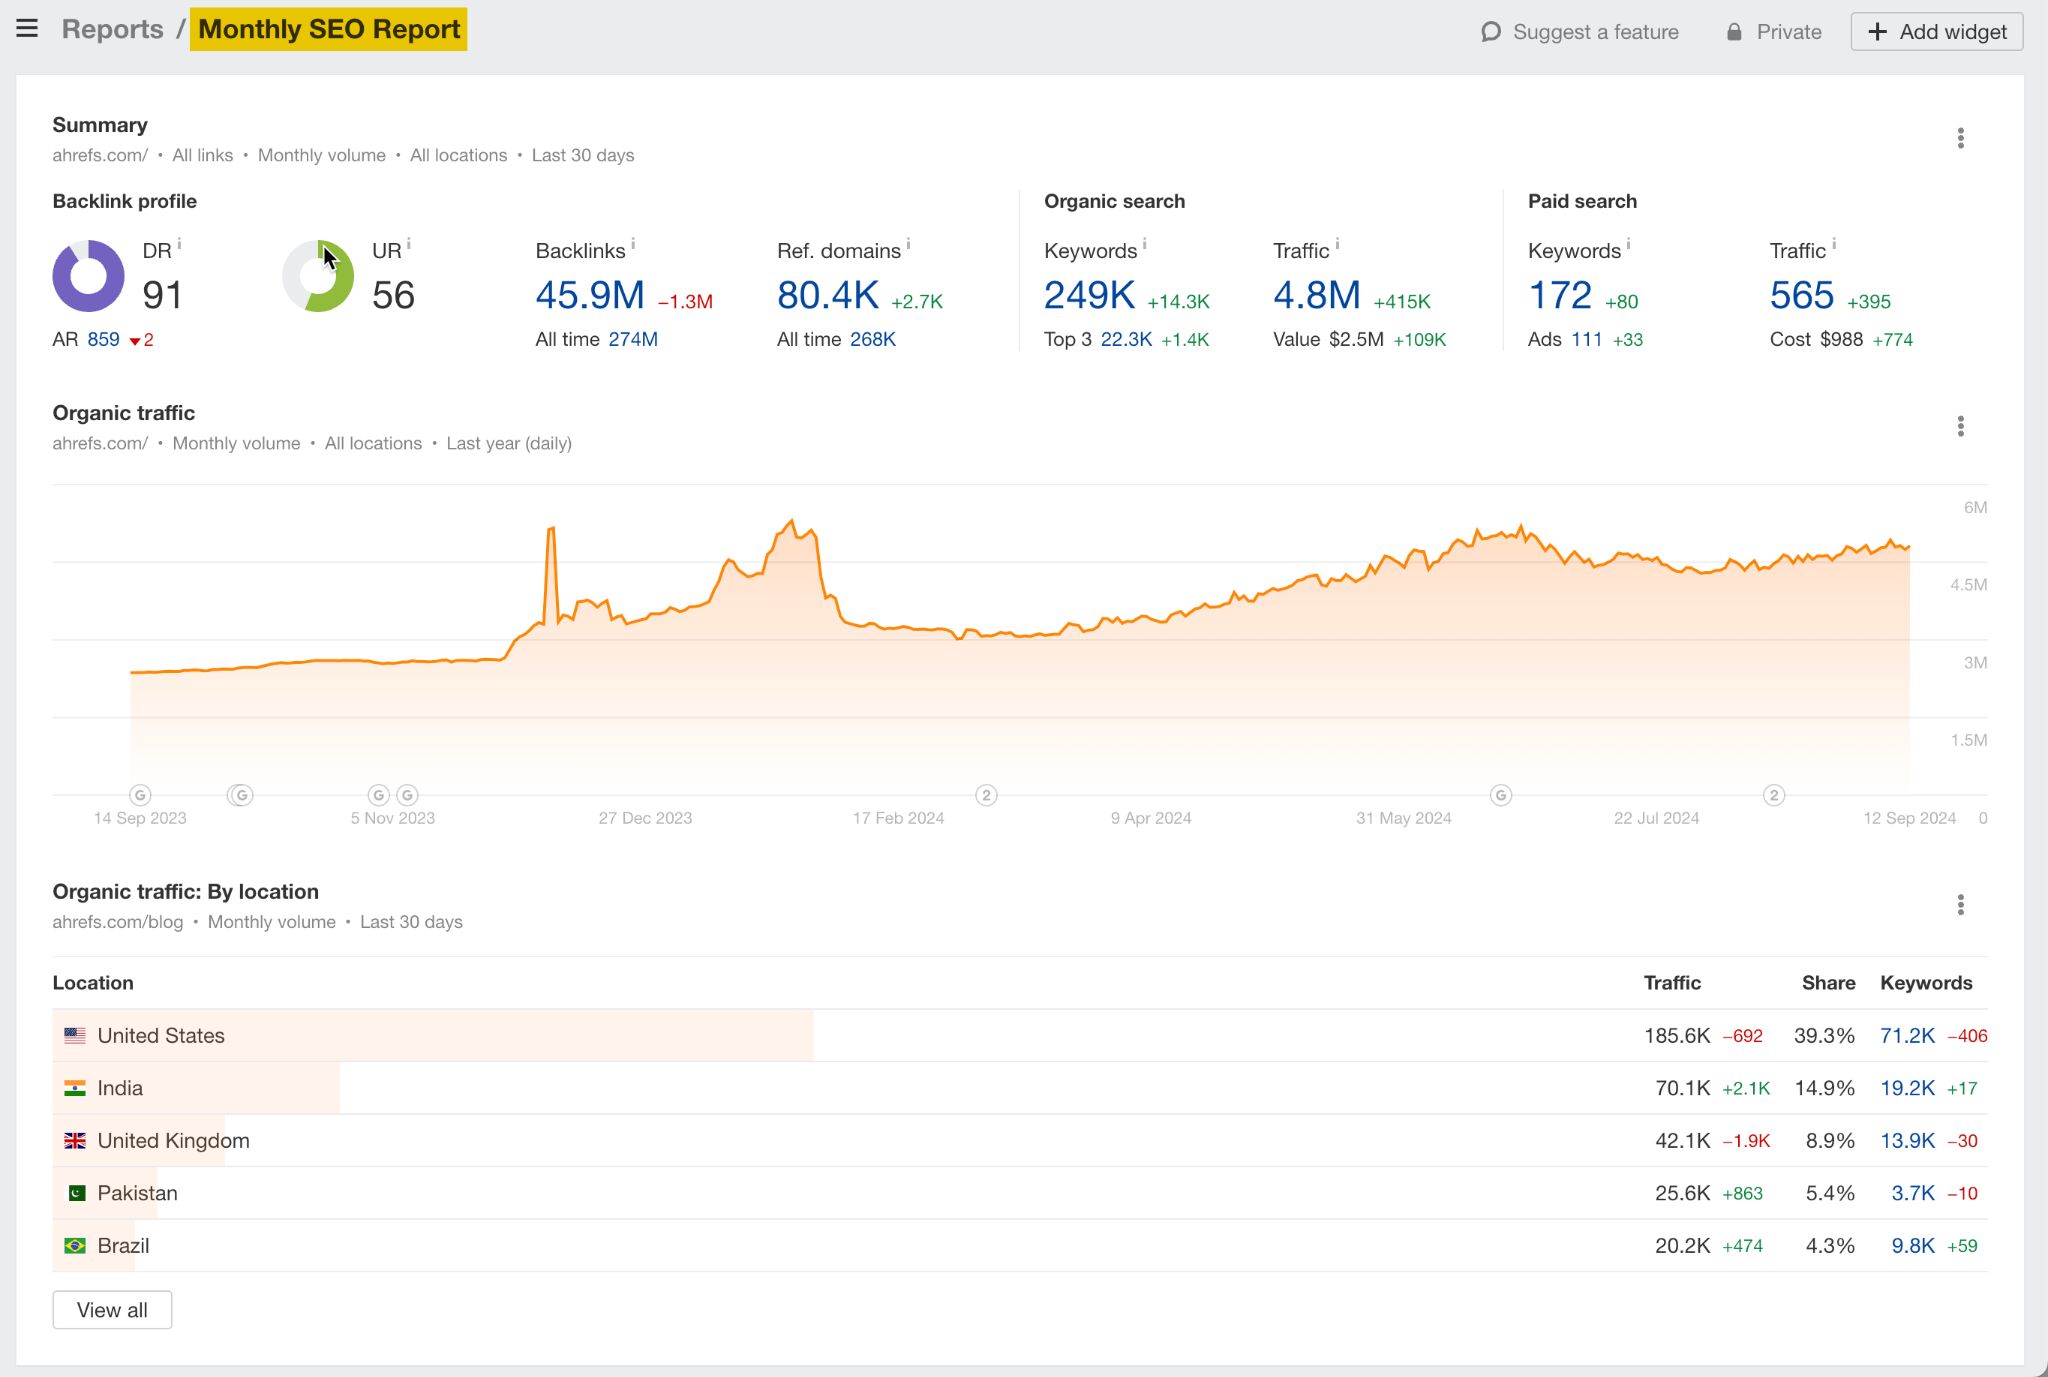
3. Performance summary
SEO performance is judged on your client’s key performance indicators (KPIs). As organic traffic is the starting point for most SEO analysis, visualizing your organic traffic performance in a slide gives clients a quick idea of whether their SEO campaign is on track.
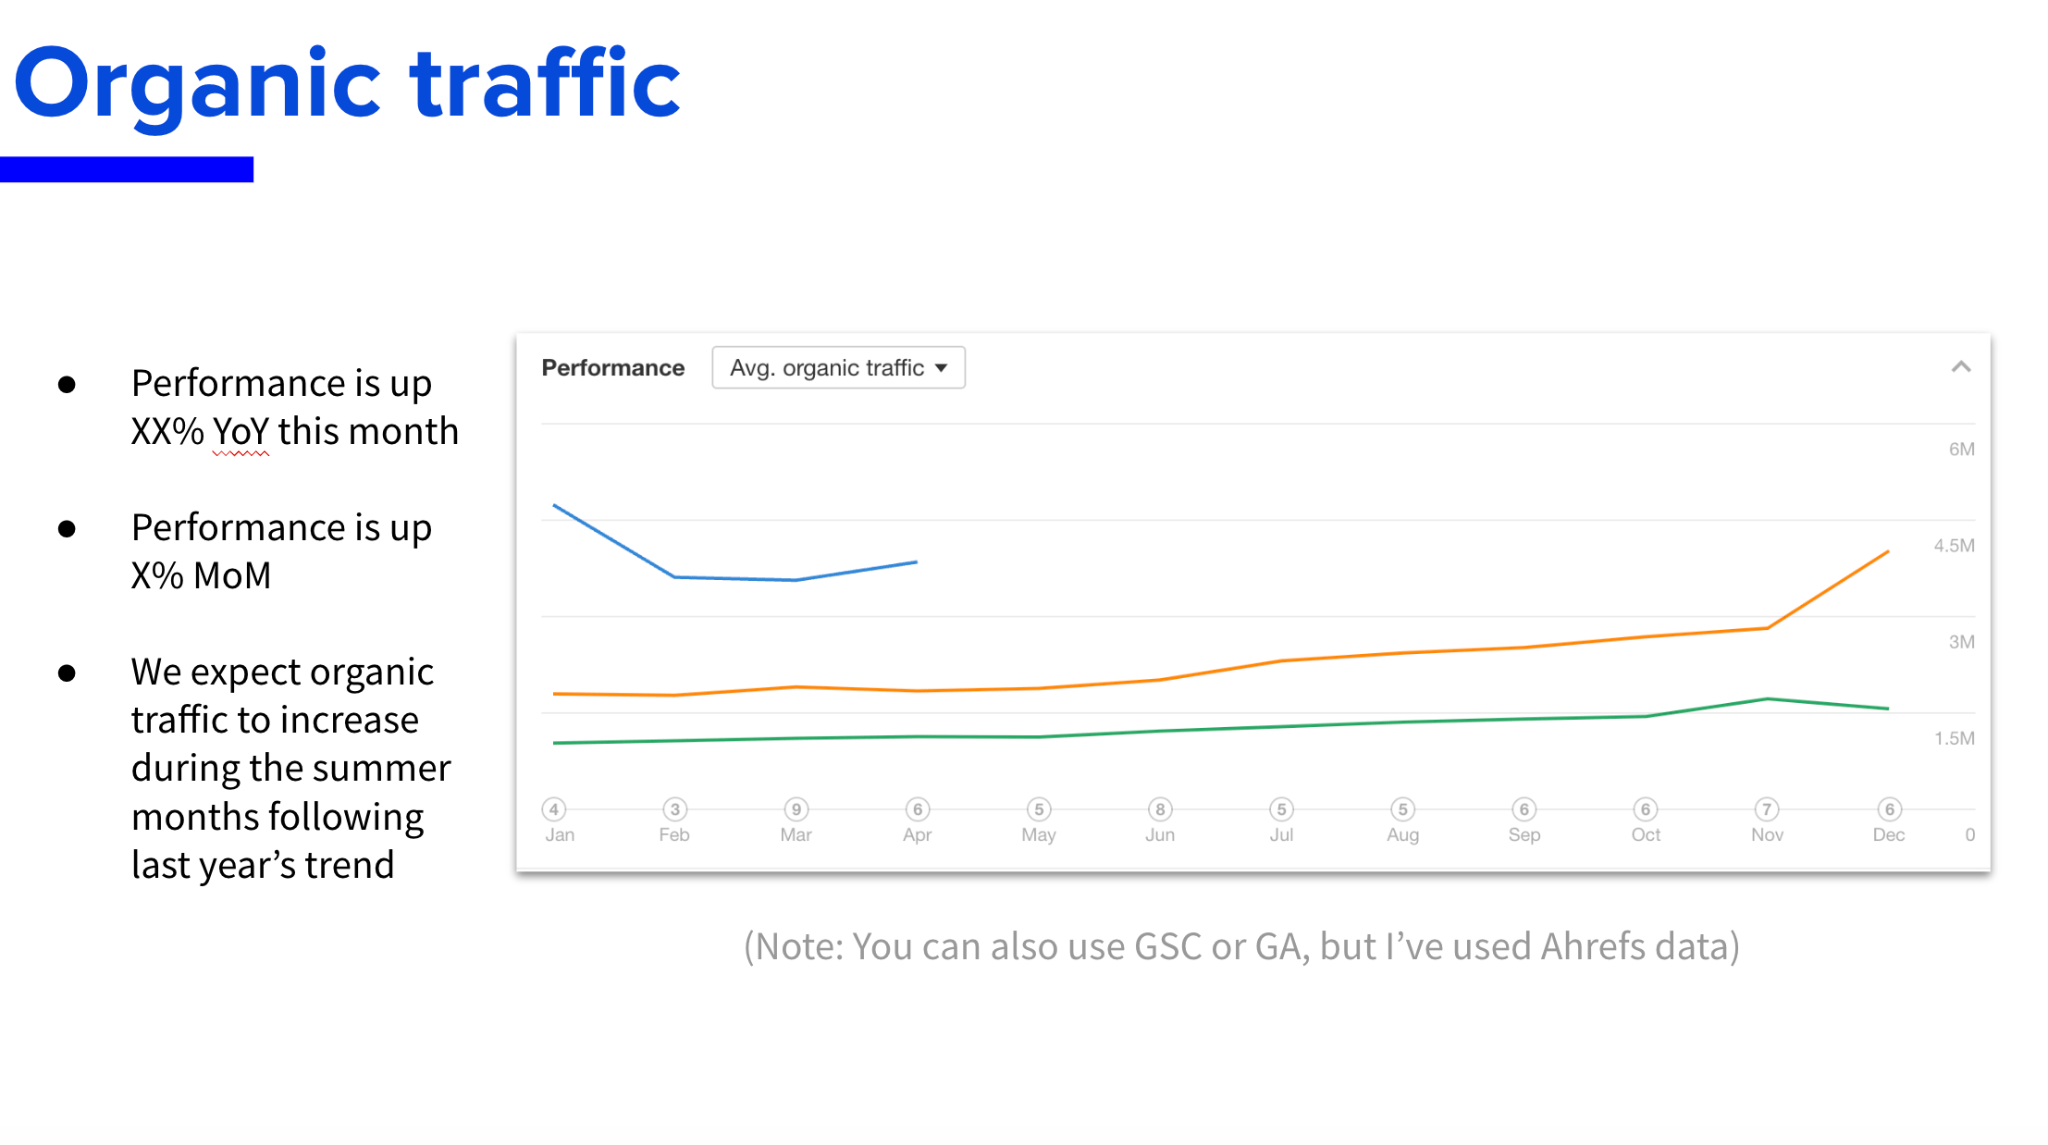
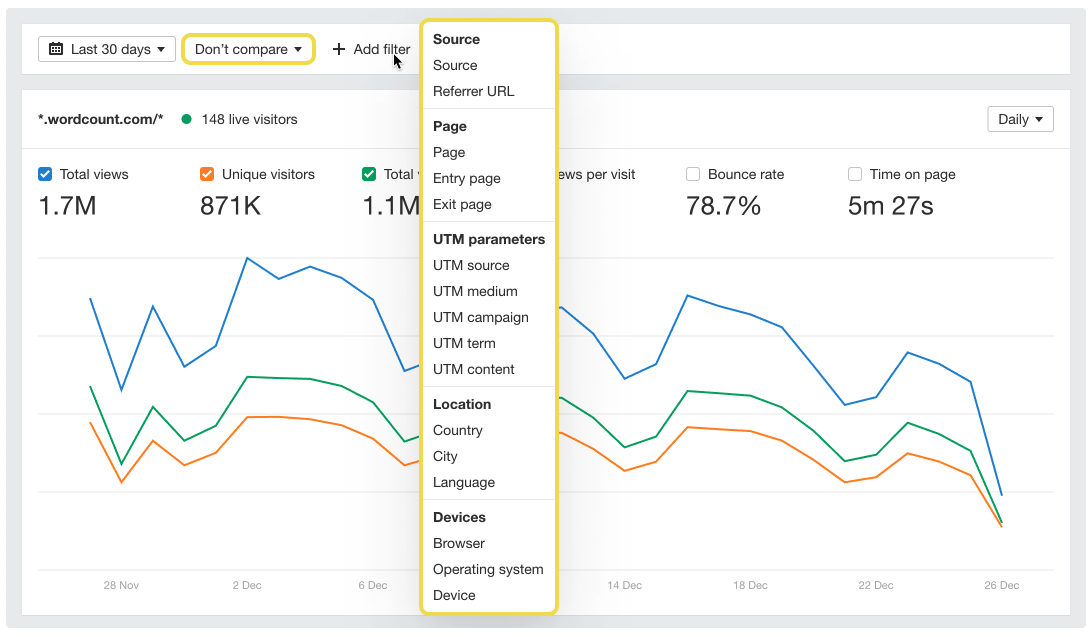
Next, you can add other SEO KPIs. A popular choice to include for many businesses is conversions:
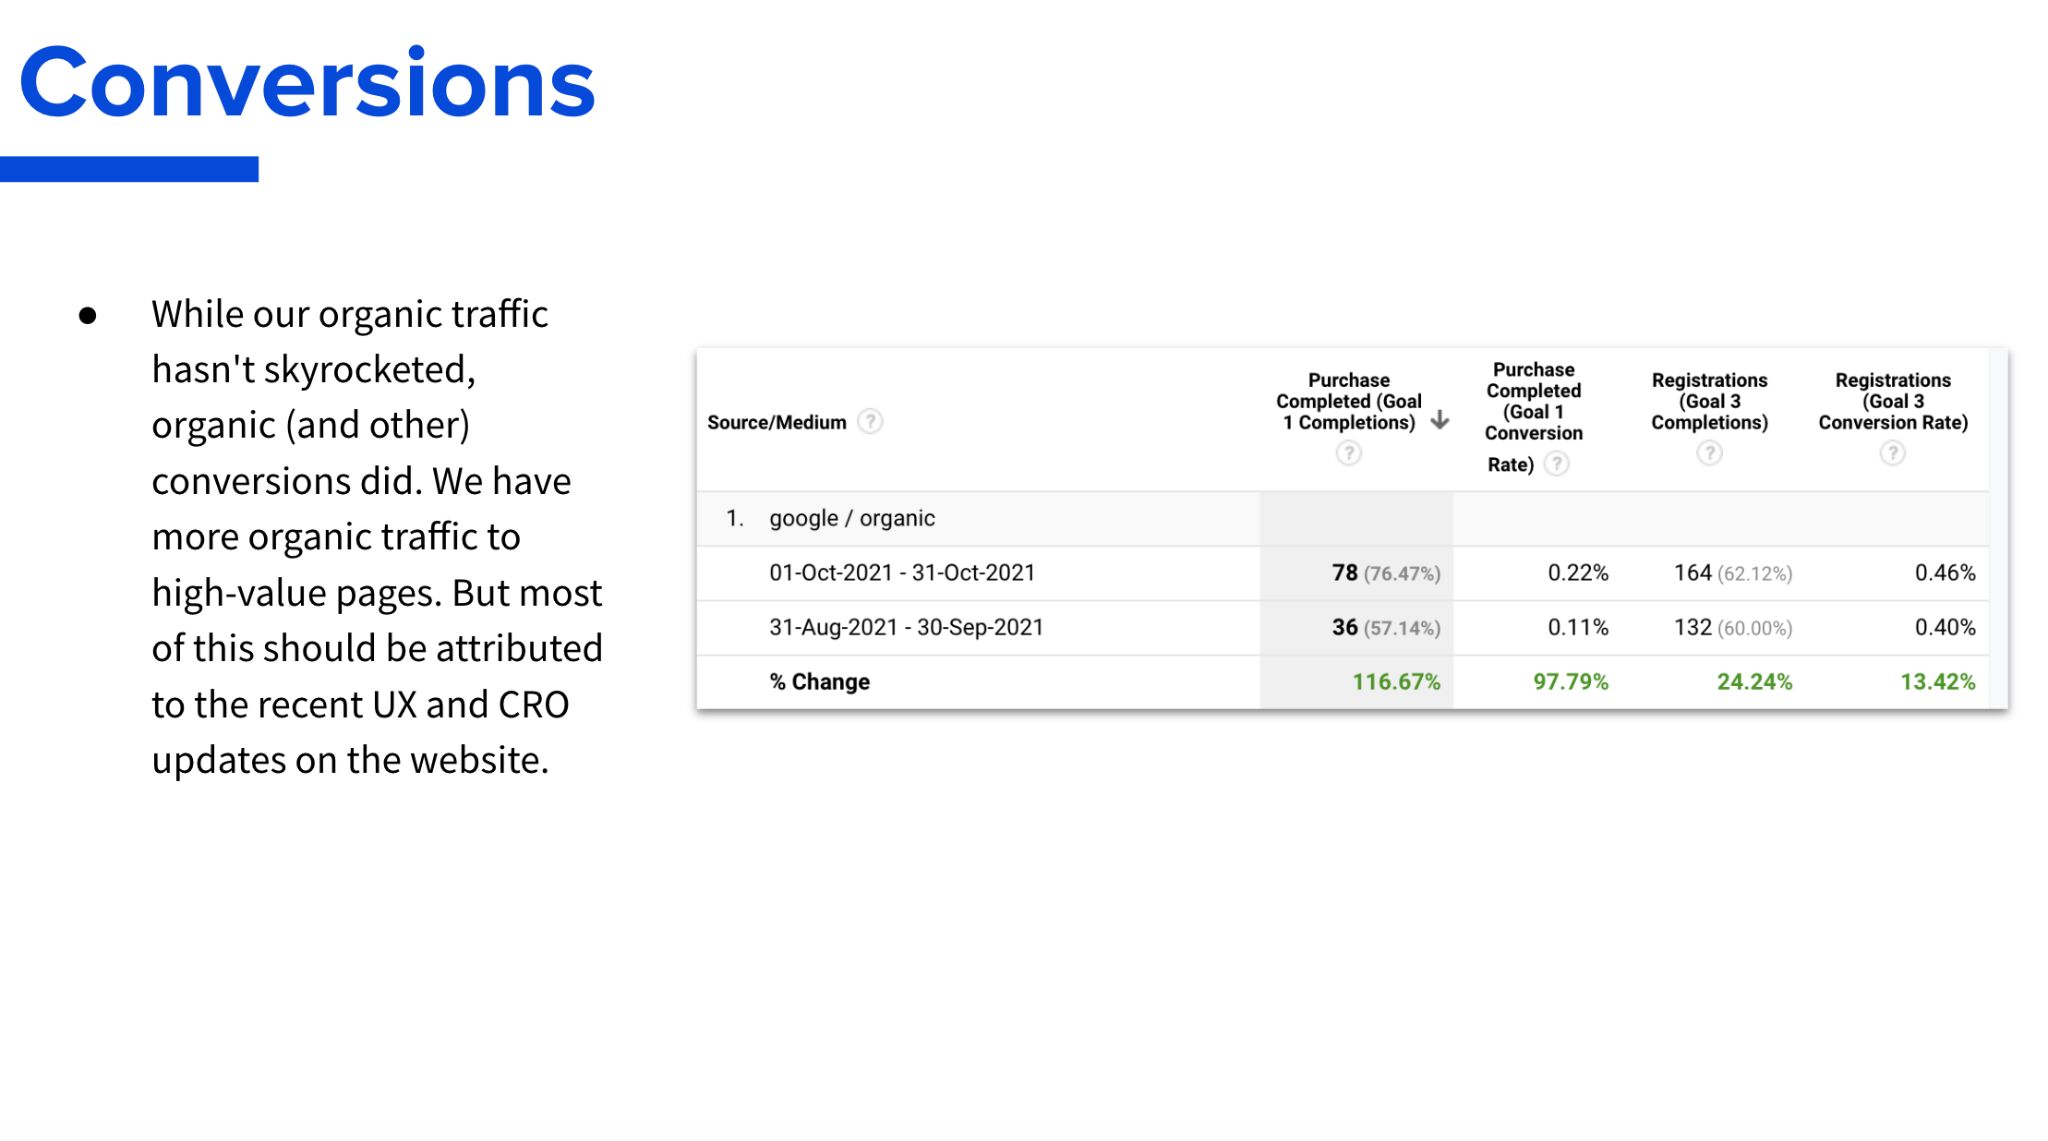
The screenshot in the report is taken from a custom Google Analytics (GA) report that only shows the source/medium dimension and selected conversions to avoid all the clutter in the default reports. The conversions are then compared month over month (MoM).
Depending on the client and their business type, you may want to include different or more KPIs. The rule of thumb is to choose metrics as closely tied to the business’s revenue as possible.
You can see two of the most universal SEO KPIs: organic traffic and conversions. But you could also include search visibility.
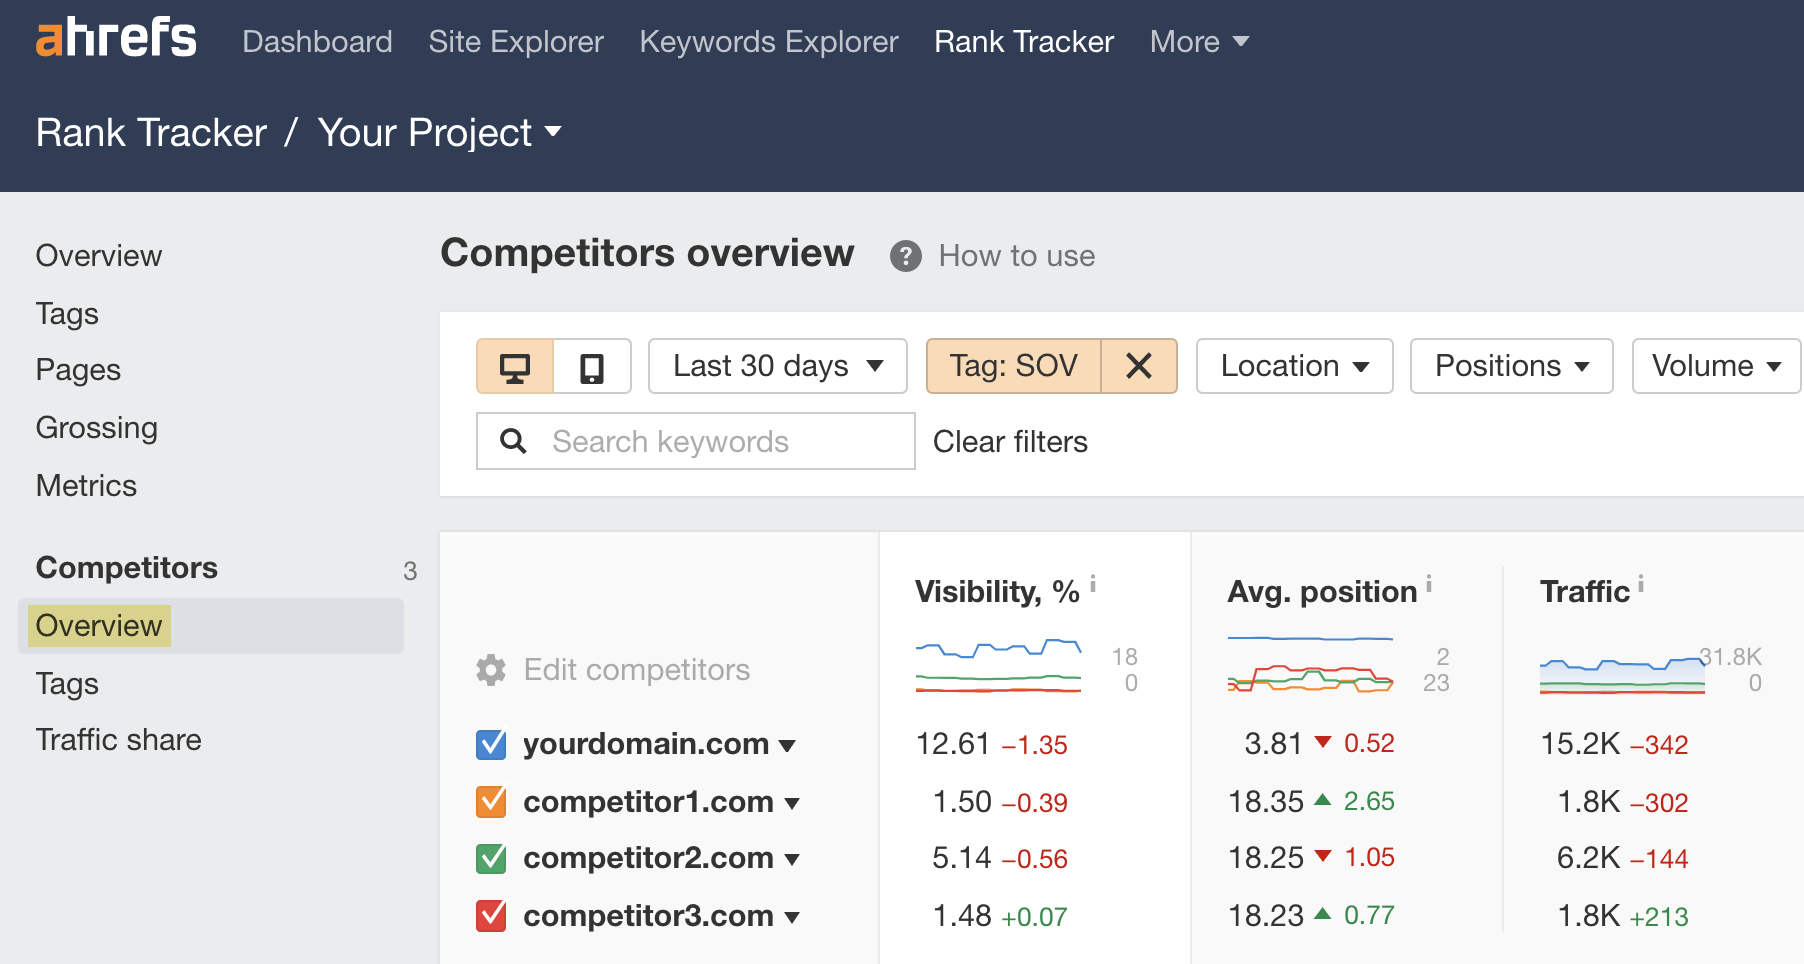
Search visibility is the SEO version of one of the most important marketing KPIs: share of voice (SOV). It’s keyword rankings on steroids.
To get the search visibility metric, create a project in Ahrefs’ Rank Tracker. In there, paste the main keywords that encompass what your audience is searching for (you need to finish keyword research first), tag it to enable filtering later, and you’re good to go:
You’ll then find the search visibility metric in the Competitors overview tab:
4. Keyword Rankings
The overall search visibility KPI isn’t the only visibility metric that clients are interested in. They have certain product categories or topics on the blog that usually differ in relevancy and value to the business. That’s where measuring search visibility for keyword segments comes into play.
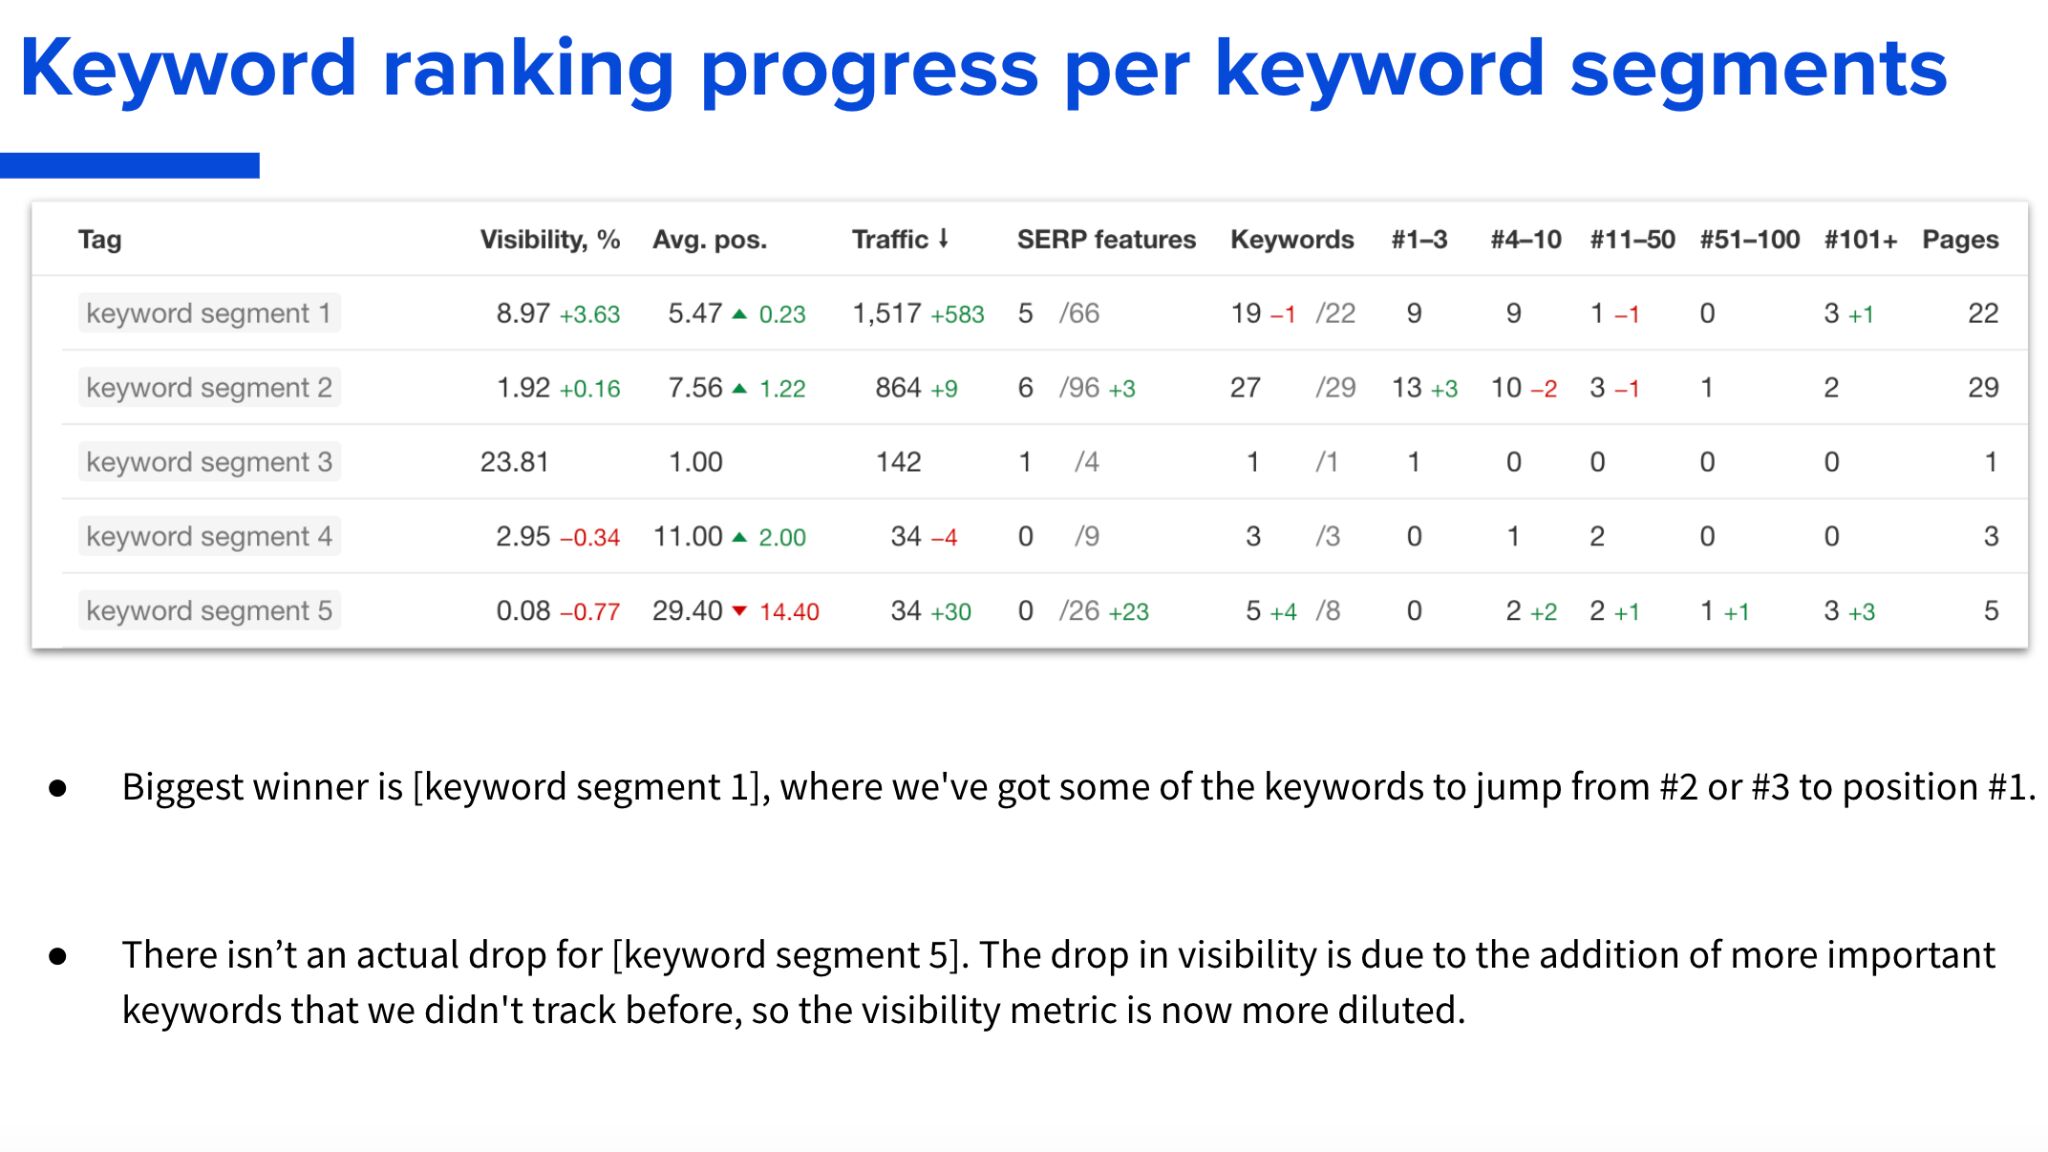
You can get this data by creating more tags in your Ahrefs’ Rank Tracker project. Scroll down to your keywords in the overview, check those that you want to tag, and assign the tag to them or create a new one:
5. Keyword winners and losers
While search visibility metrics are the best proxies for your organic growth, most clients also want to see position changes for their most important keywords.
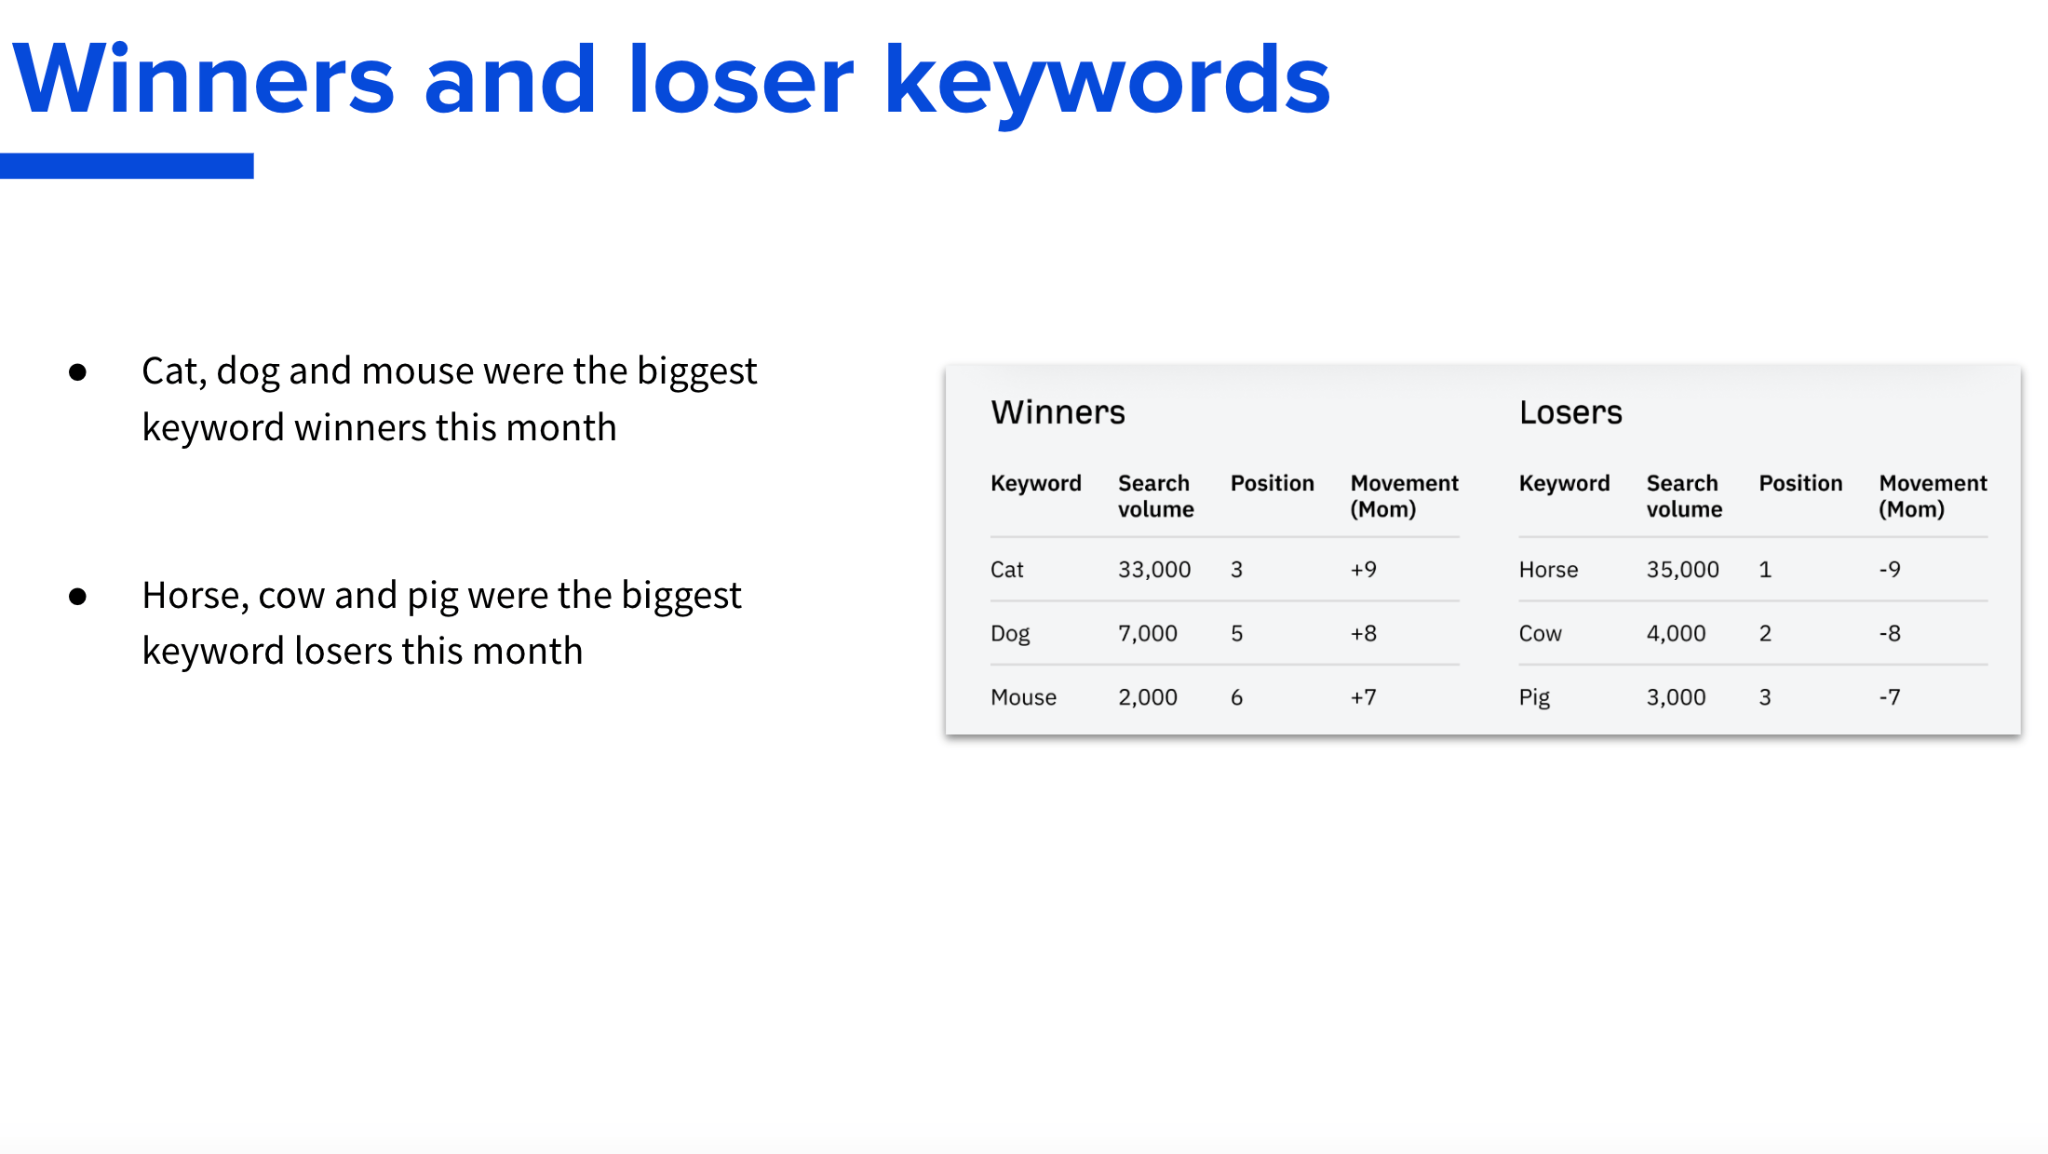
Presenting position changes of hundreds of keywords in a deck will get pretty messy. We should, therefore, satisfy the client by only reporting on the most important keywords for the business. You can then include the rest by linking to the exported spreadsheet if the client wants to see it.
6. Brand vs non-brand split
For well-established brands, you can segment non-branded organic traffic to show the impact of removing brand traffic.
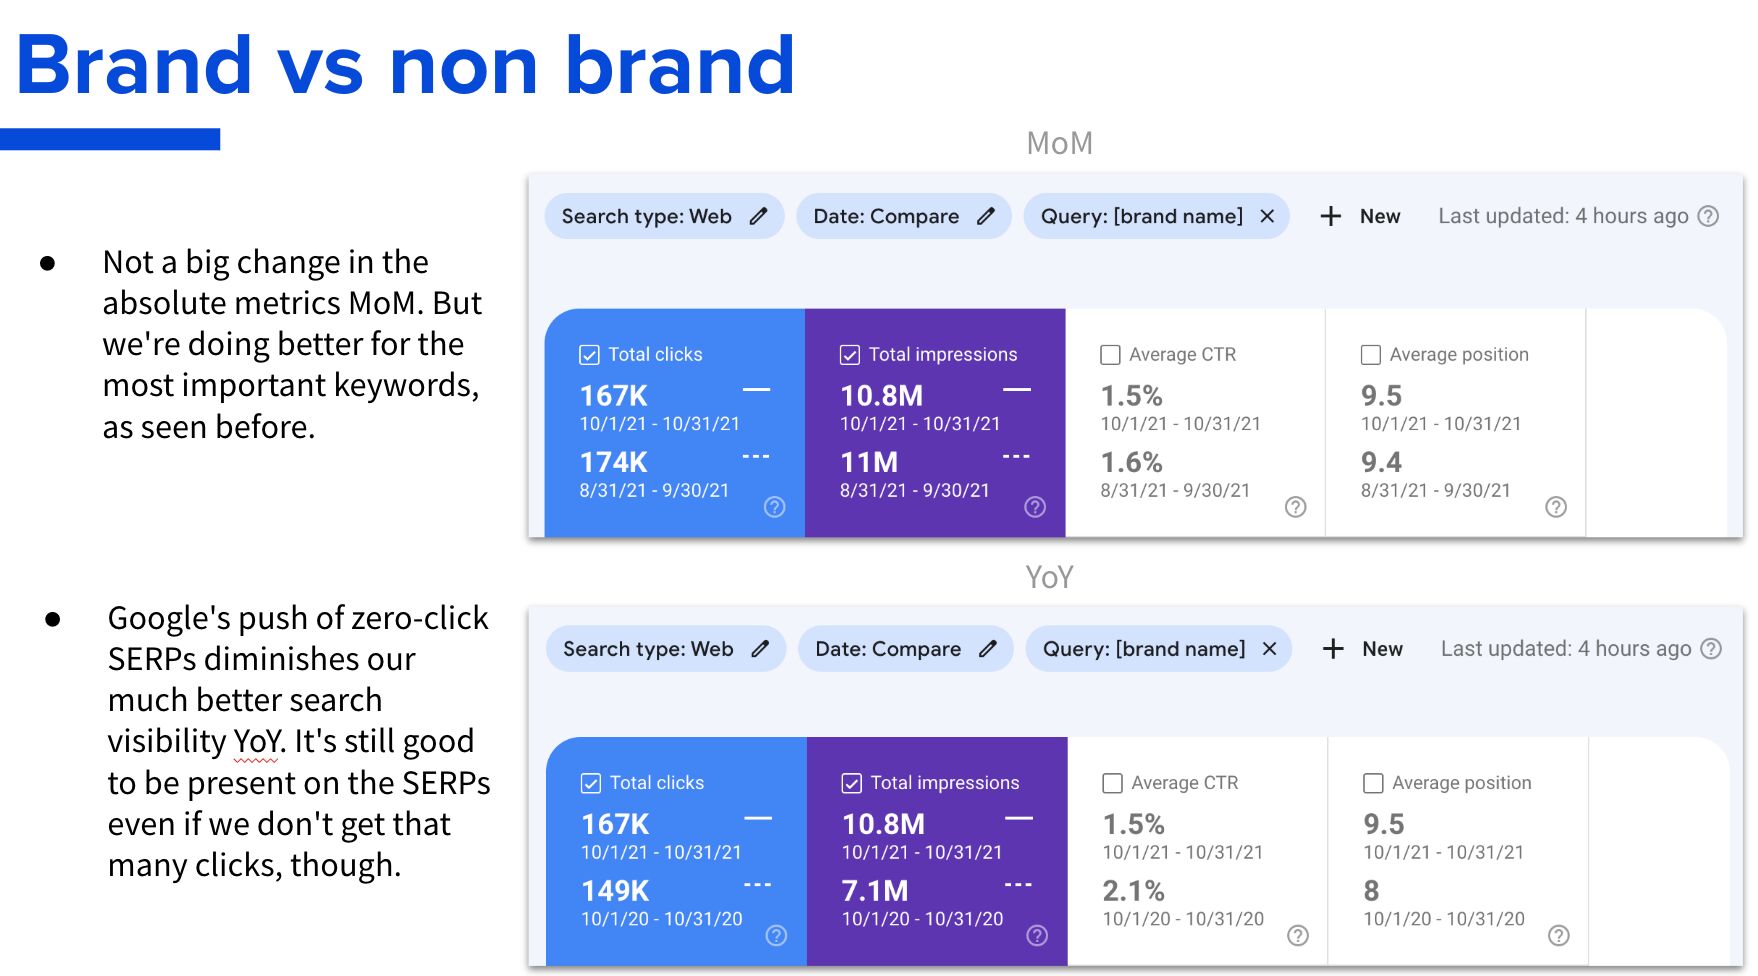
The reason for showing non-brand traffic here is to avoid attributing organic traffic changes to marketing activities unrelated to SEO. For example, if the marketing team launched an excellent PR campaign or started airing mass marketing campaigns, your organic traffic would naturally go up just from people looking up your brand more.
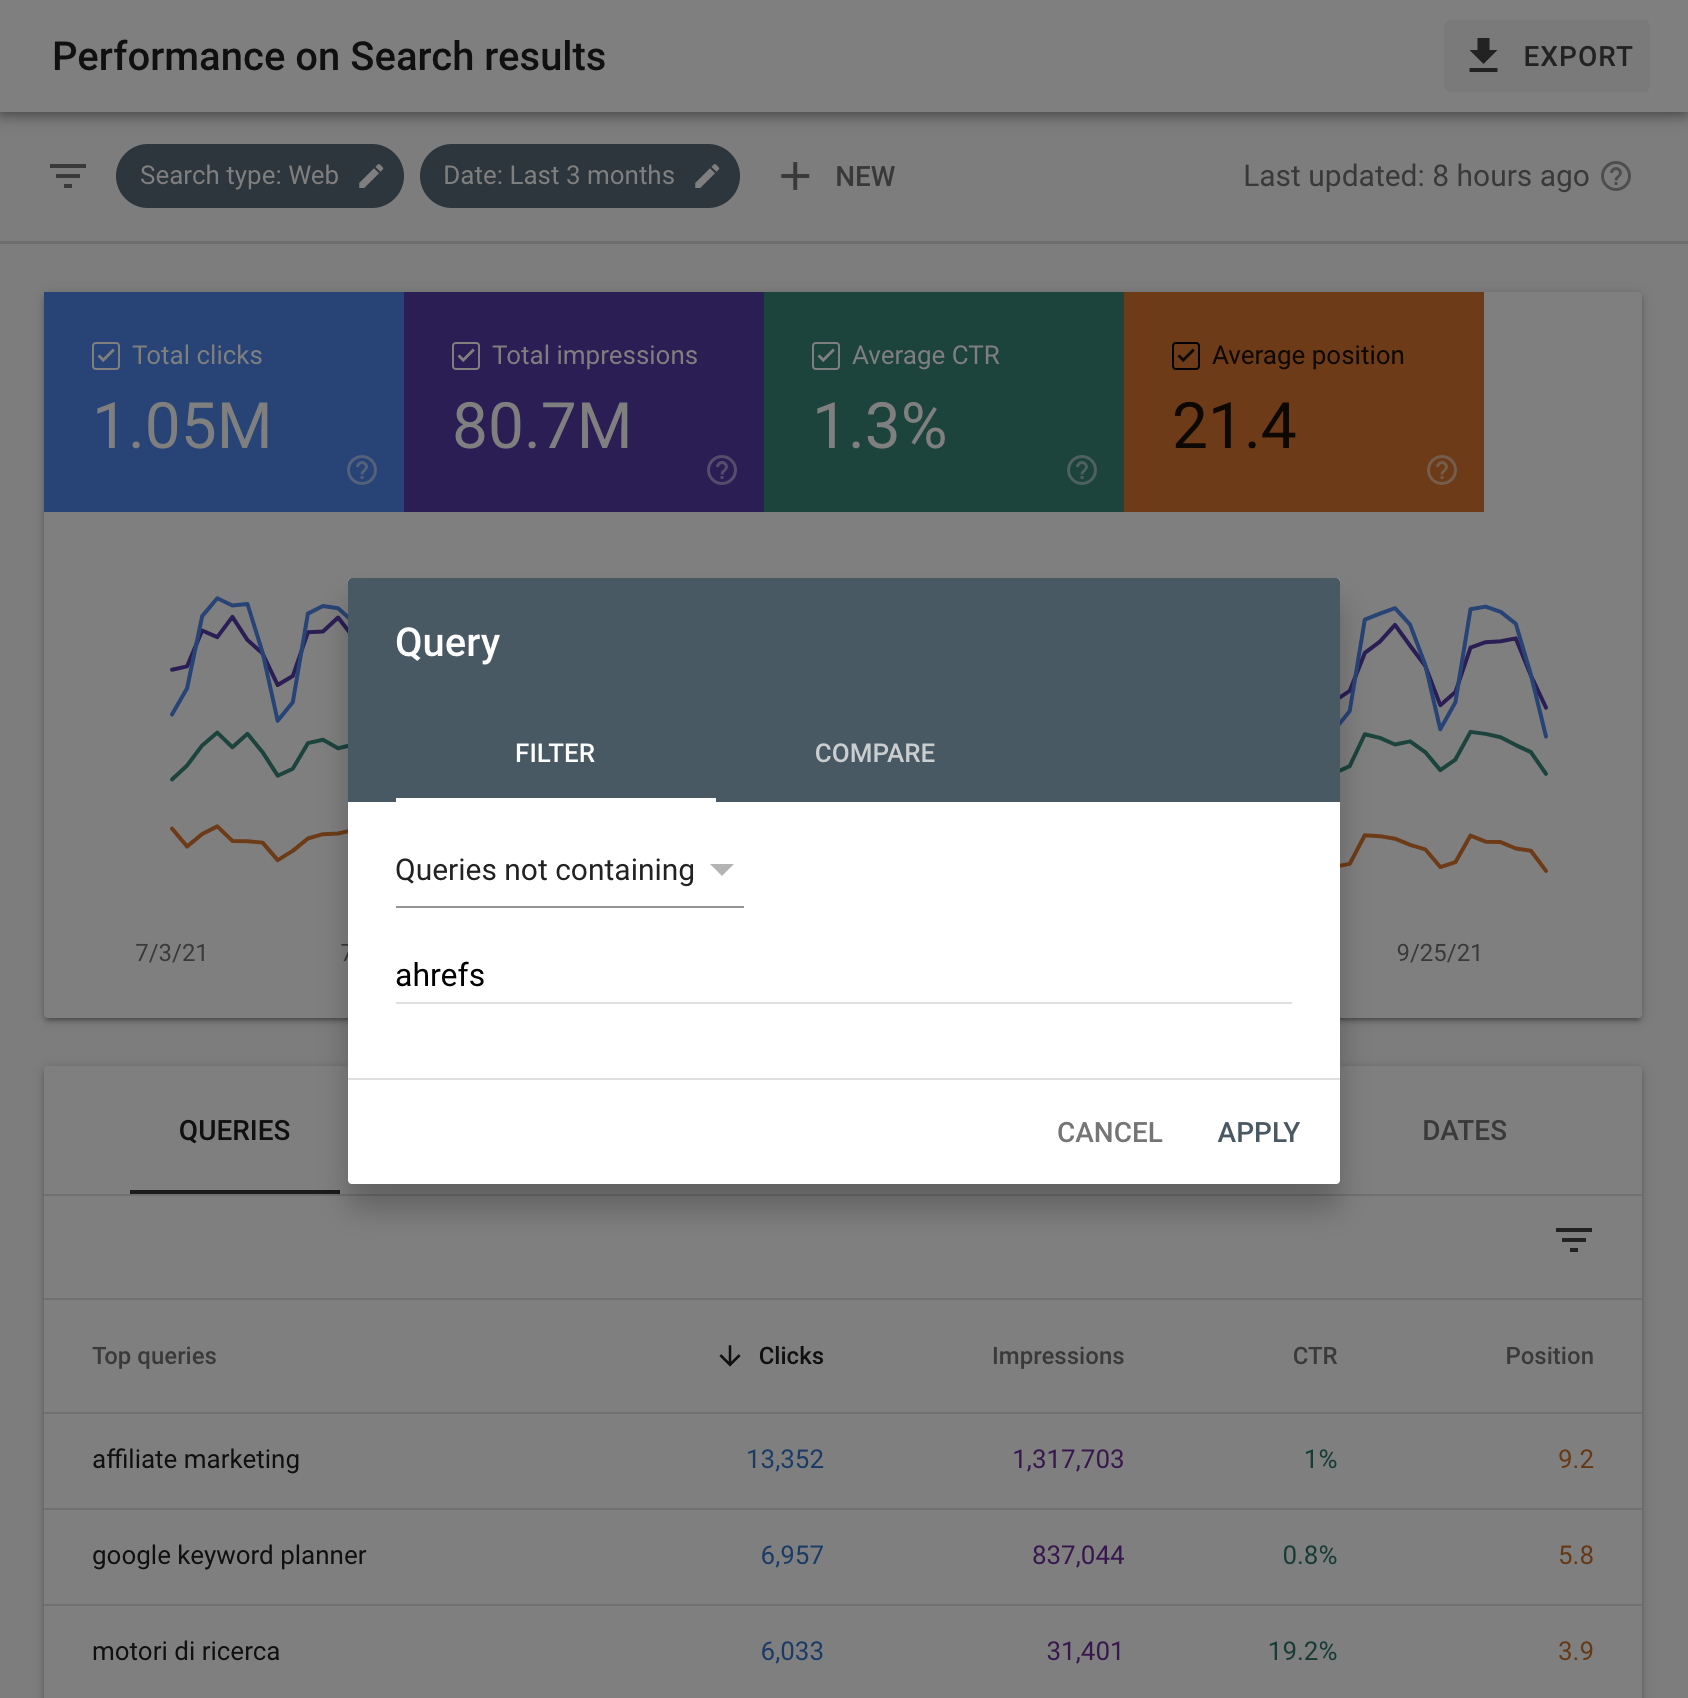
To show a more accurate overview of organic traffic progress, simply apply a query filter in Google Search Console (GSC):
Again, you want to compare the current month’s performance with the previous month’s and, ideally, even with the year-over-year (YoY) performance. Most businesses tend to have seasonal swings, so some MoM comparisons may look bad just because the high season has already ended.
Be careful here. GSC only provides 28-day views and comparisons by default. So, you need to select custom dates to compare whole months. Remember to compare the same number of days. Let’s look at a scenario where a month has 31 days (e.g., in such a case, start the comparison on the last day of August to account for only 30 days in September).
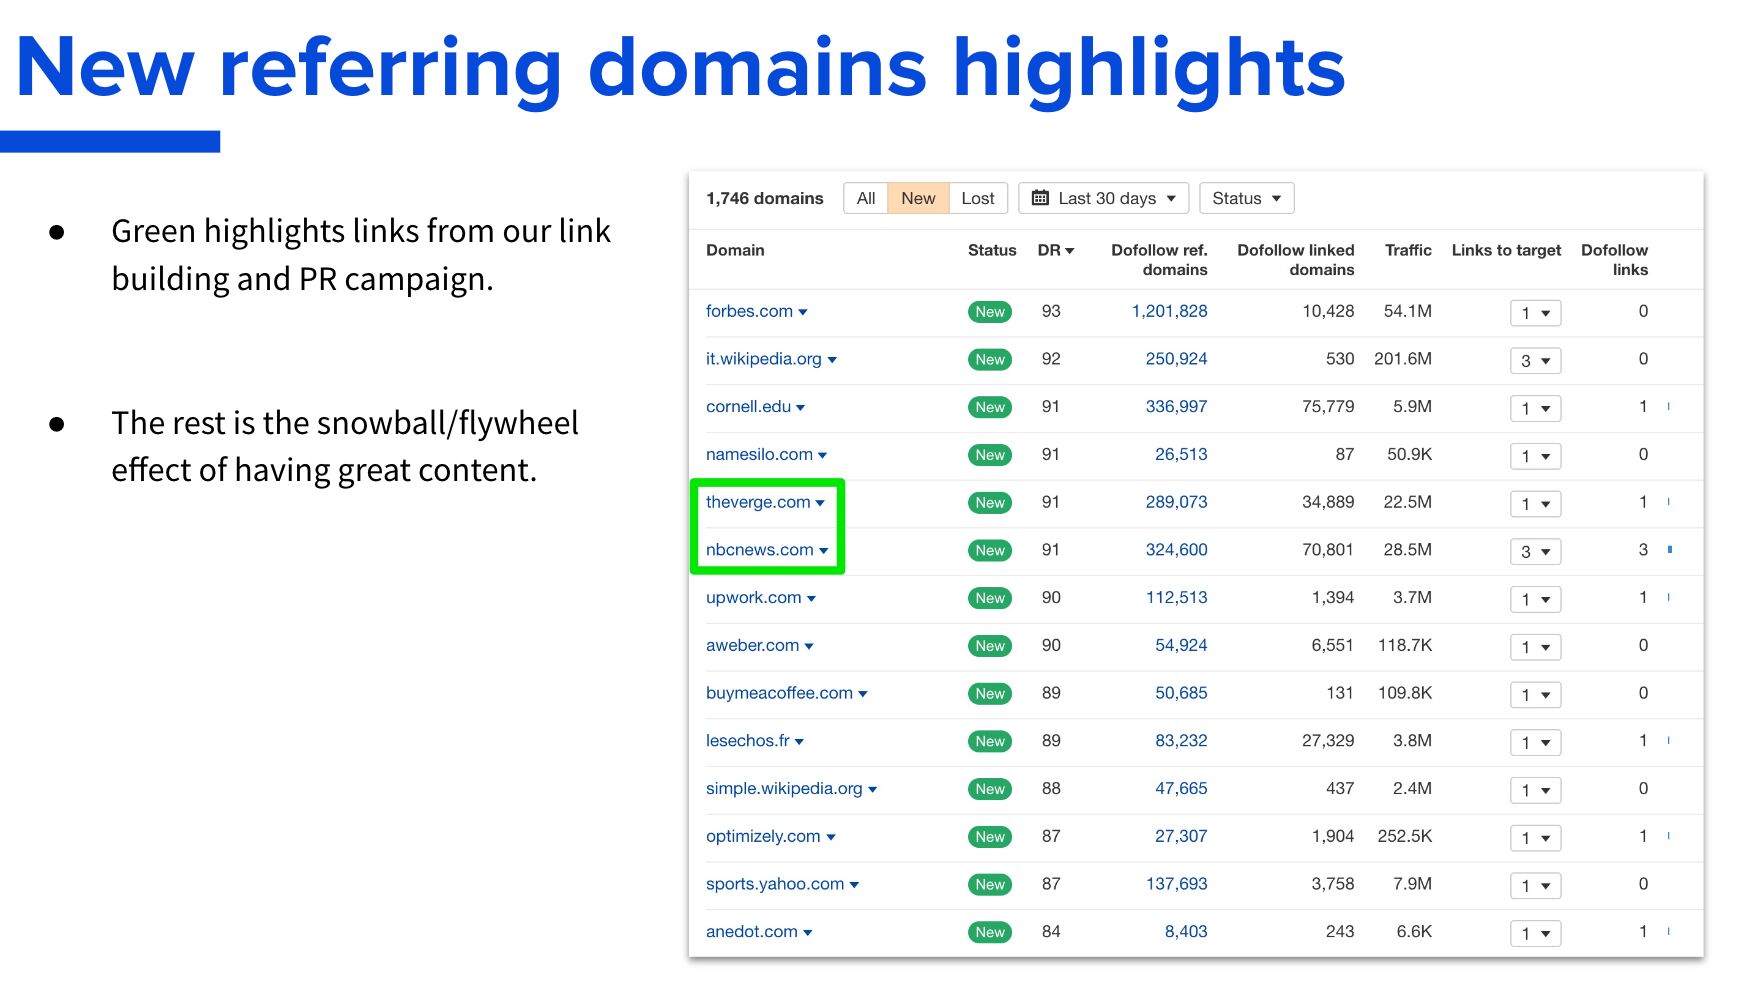
7. New referring domains highlights
Next up is the backlink profile, which shows the client what new, interesting links they have found in the last 30 days.
However, you should only report on backlink profile changes if your activities in the project influence the acquiring of new links. That can range from creating link bait content to planning and executing outreach campaigns. I mention this because link building is often a separate activity from many SEO projects.
If you are responsible for backlink profile growth, go to Ahrefs’ Site Explorer, check the Referring domains report, and filter for new referring domains in the past 30 days (as you can see in the slide.)
We show the highlights of the newly acquired referring domains sorted by Domain Rating (DR) score because it’s a solid and easy-to-understand proxy for improving backlink profile growth.
If you engage in outreach activities and see a new referring domain gained from that, you can highlight it in the screenshot so the client can differentiate between earned and acquired links.
8. Link building progress
This slide details the link building work done during the month.
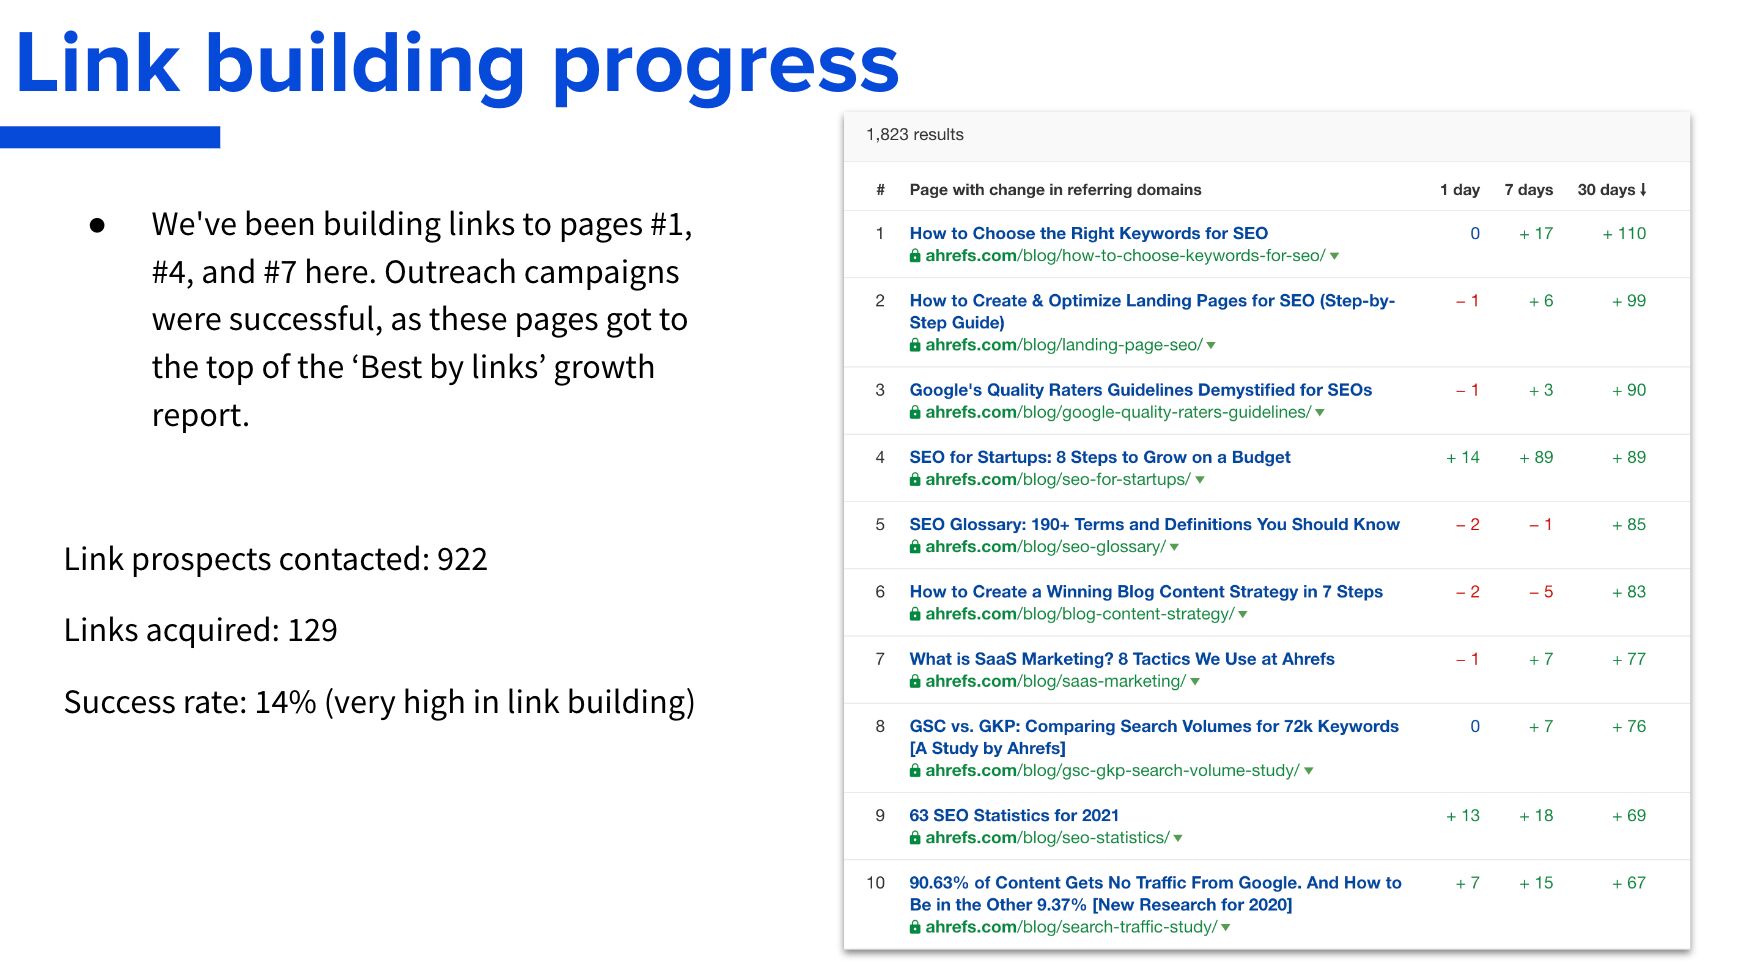
It can include:
- The pages you built links to.
- Any standout, new referring pages.
- The number of links those pages got.
- Your link building statistics, e.g., prospects contacted and success rate.
- Any insights you deem relevant, e.g., exceptionally good or bad link bait content.
Ahrefs’ Best by links growth report in Site Explorer is good to include here because it shows you pages that received the most backlinks in the past 30 days.
There’s much more to evaluating link building than the number of links and DRs of referring domains. But that’s relevant for link prospecting before launching outreach campaigns, not for SEO reporting. Your clients don’t need to dive into all the nuances.
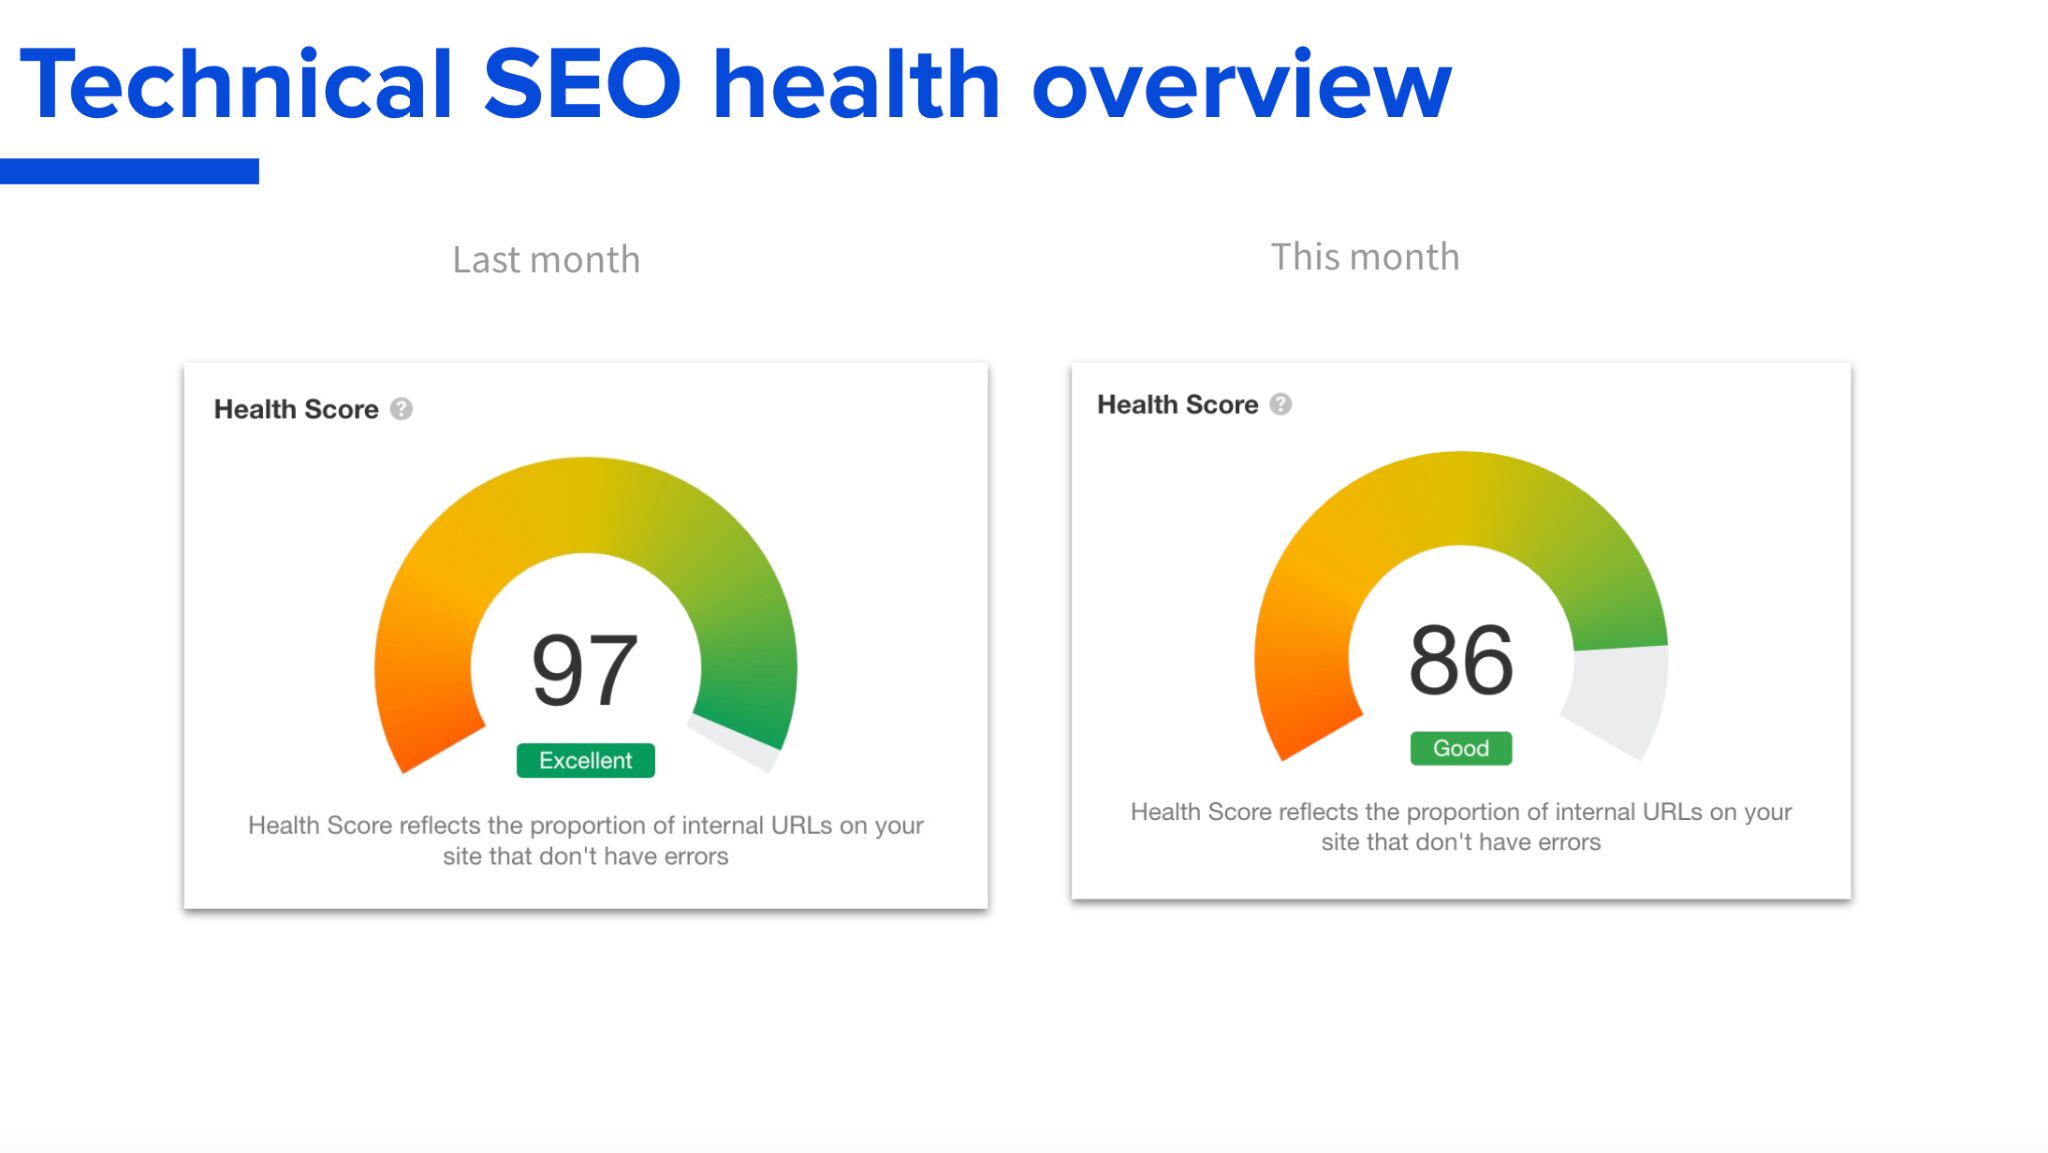
9. Technical SEO health overview
This is where you’ll give a snapshot of the website’s health that considers all technical SEO errors and issues.
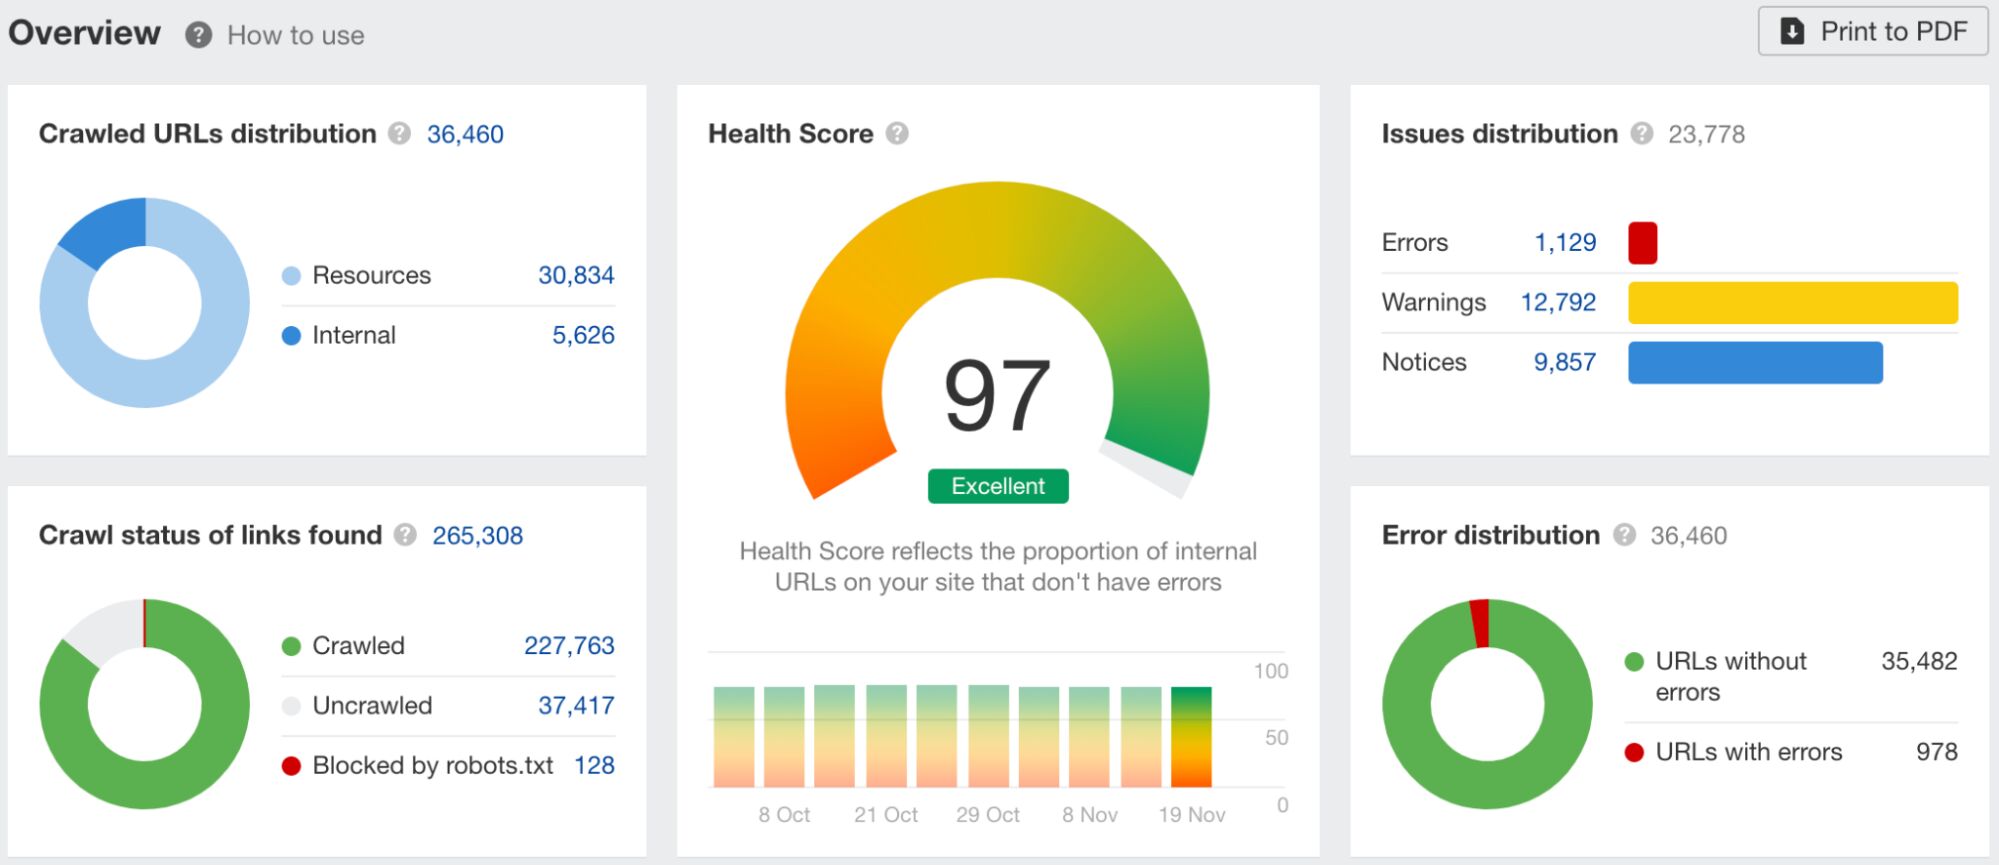
To get this data:
Go to Ahrefs’ Site Audit, set up a project for the client’s website if you haven’t done so already, and let the tool crawl the website. Depending on your crawl settings, Site Audit can recrawl the website periodically, providing you with all the current and historical technical SEO data.
You get the Health Score on the overview page after each crawl is completed.
If this is your first time crawling the website, use this Health Score as a starting point. You can start referencing monthly comparisons in your second report.
Now, you may be thinking that one metric isn’t enough to reflect the whole state of technical SEO. And you’re right. But you’re usually not sending SEO reports to developers or other SEOs who can easily understand more in-depth information. For this reason, the Health Score is the best proxy for a client-friendly, technical SEO metric.
Again, this doesn’t mean you shouldn’t report on more technical SEO metrics. Some projects involve huge websites and complex, technical SEO tasks. In such situations, the client will likely welcome crawling and indexing statistics and details about the most important issues impacting your website’s technical SEO.
10. Next steps
After sharing all the data and reports, you should give them a plan of the most important SEO tasks you’ll be working on next month.
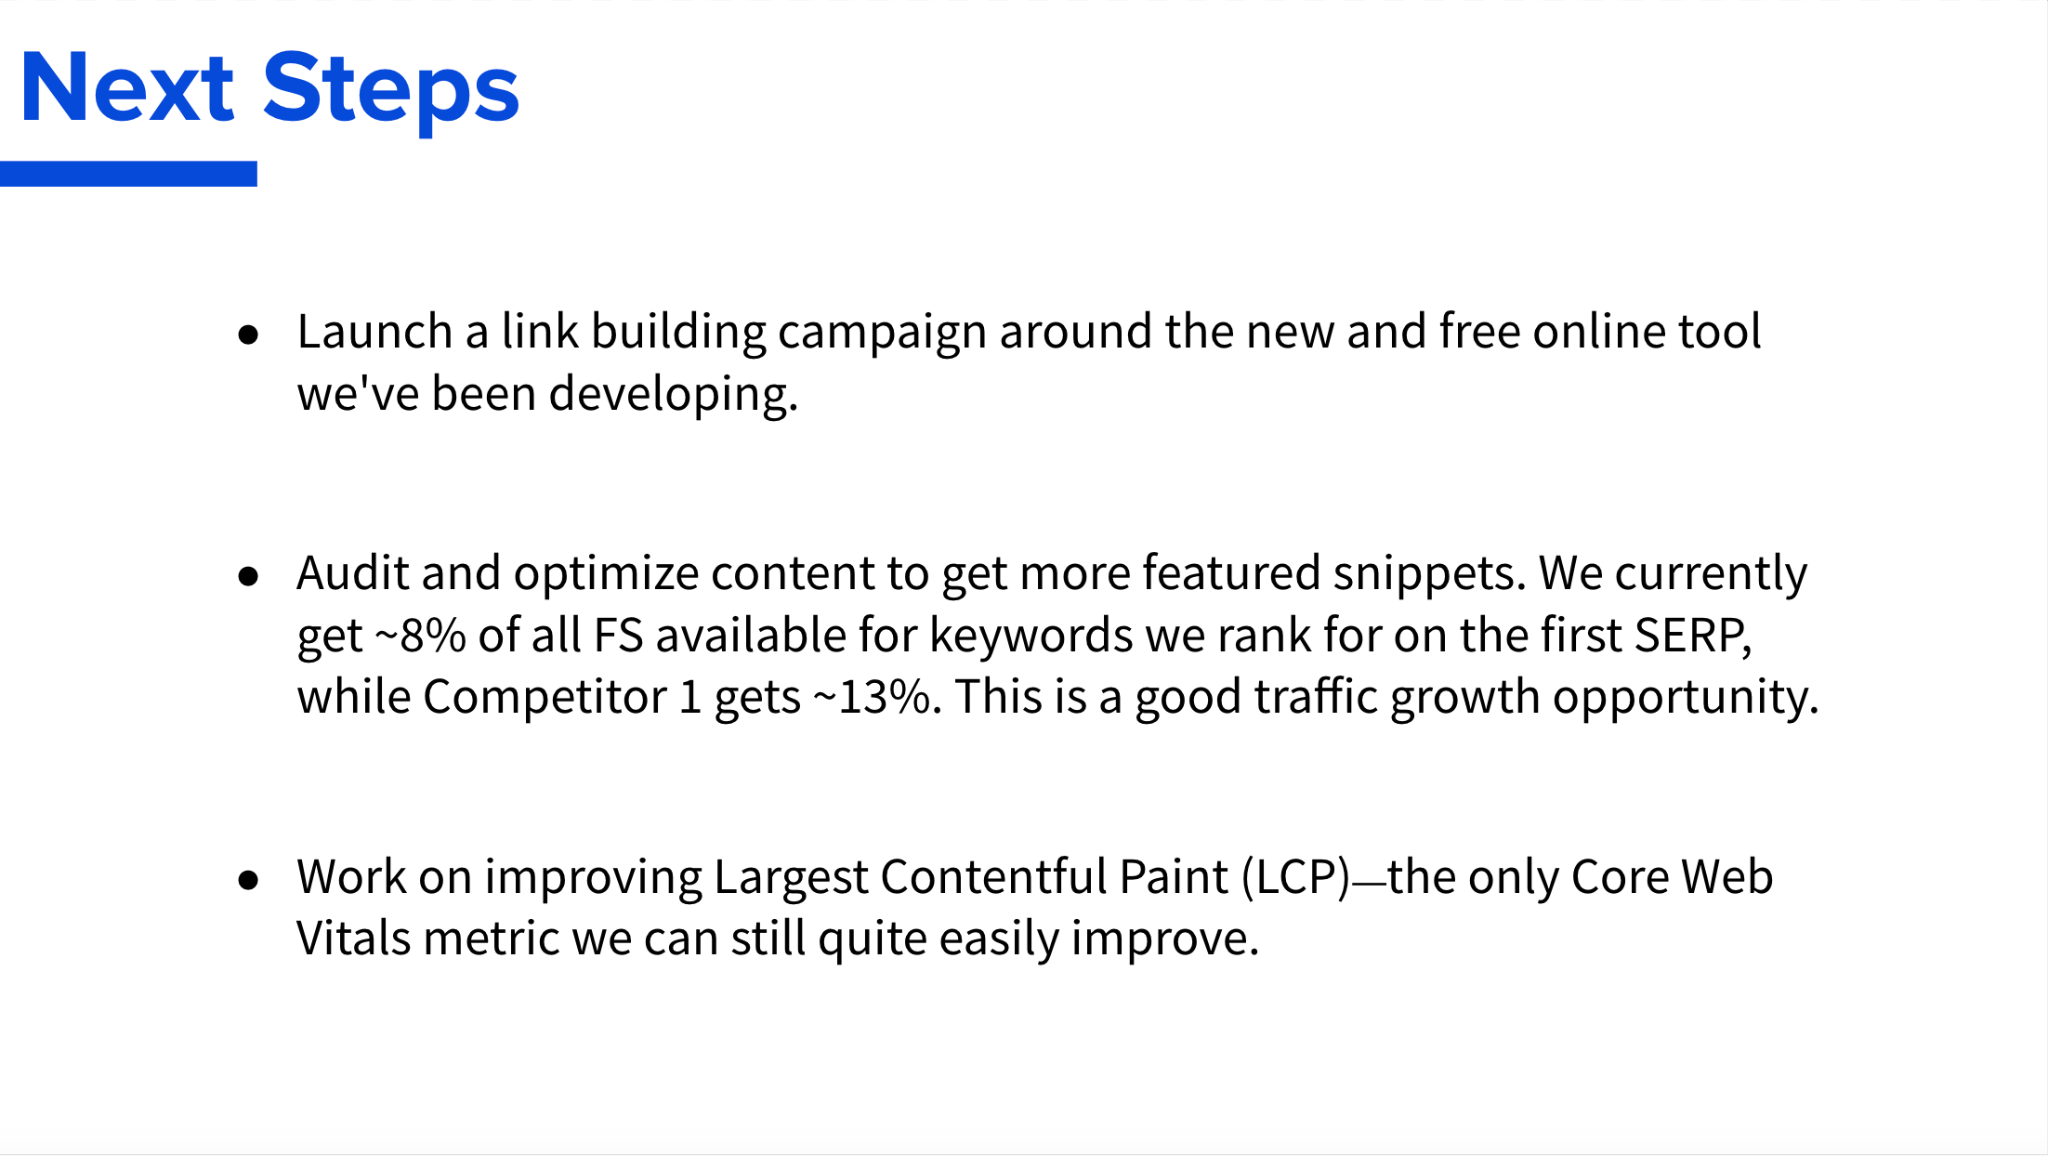
A quick to-do list summarizing your main focus for the following month will be enough. It will also serve as an anchor for your next SEO report.
Final thoughts
So there you have it. A fully customizable SEO reporting template to give to your clients. In case you skimmed through the article first, here’s the link again:
Click here to make a copy of our updated SEO report template.
SEO Reporting isn’t many people’s idea of fun. But it’s crucial to master the basics so you don’t miscommunicate to your clients.
To wrap up, I want to thank everyone who shared their reporting insights. I’m also grateful for Ahrefs Insider members, who proactively reached out with their knowledge and reports before I even started creating the template.
Are there more metrics or slides this SEO report template should have? Got any questions? Ping me on Twitter.