Each year, we pick, vet, and categorize a list of up-to-date statistics to give you insight from hundreds of marketers on trends, best practices, or simply things that work in content marketing.
This article draws exclusively from original data sources, featuring some of this year’s latest statistics alongside a few older but still relevant findings.
This year’s collection shows a clear trend: content marketing is changing faster than ever. Short videos are now the top choice for consumers, long articles are losing attention, AI content is everywhere, and new tools that once took years to catch on are being adopted by marketers almost instantly.
AI has officially gone mainstream—no turning back. Most marketers now rely on it to create content, and it’s showing up across nearly all top-ranking pages. At the same time, consumer tastes have shifted dramatically—short videos have become the go-to way people consume content.
- 86.5% of top-ranking pages contain some amount of AI-generated content.
(Ahrefs, 2025)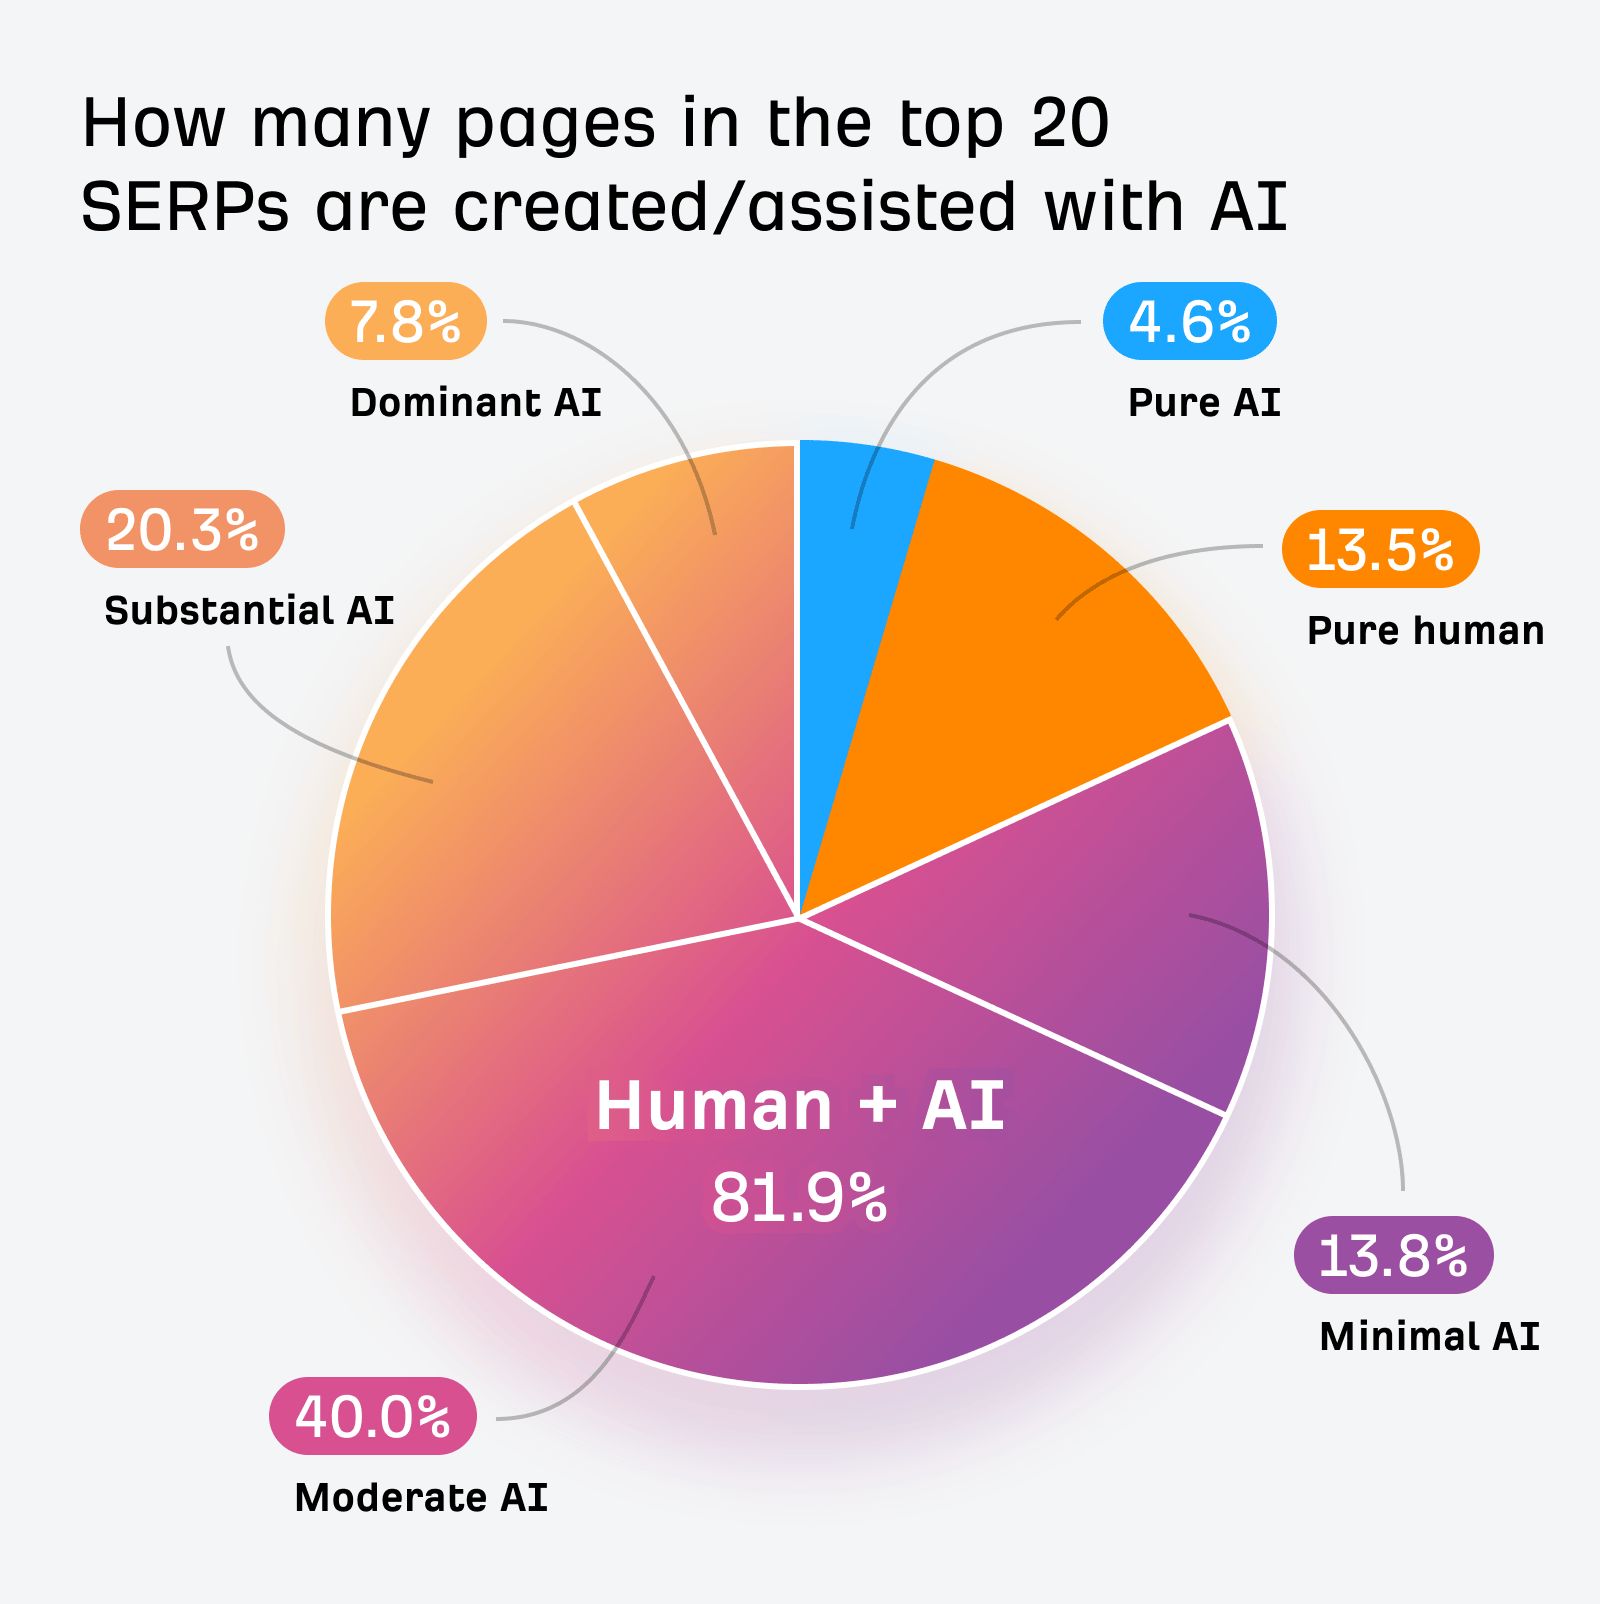
- The top investment area for marketers in 2026 will be AI-powered marketing tools (Content Marketing Institute, 2025).
- Search engines are the number 1 source of brand discovery and research (Digital Report, 2025).
- 87% of marketing professionals now use AI for content creation. (Ahrefs, 2025)
- 73% of people admit to skimming blog posts, while 27% consume them thoroughly. (HubSpot, 2017)
- 8% of consumers now prefer learning about a product or service through a short video—a big jump of 34 percentage points since 2024. Only 9% would rather read an article, which is up slightly by 4 points. Just 3% like attending webinars (down 3 points), and only 2% want a sales call or demo (down 4 points).(Wyzowl, 2025)
- Across both B2C and B2B, organic channels like email marketing and SEO outperform most inorganic channels in conversion rates. (FirstPageSage, 2024)
For the past couple of years, I’ve surveyed Ahrefs’ audience on X about their use of AI in content marketing. Last time, almost everyone was already using AI or planning to.
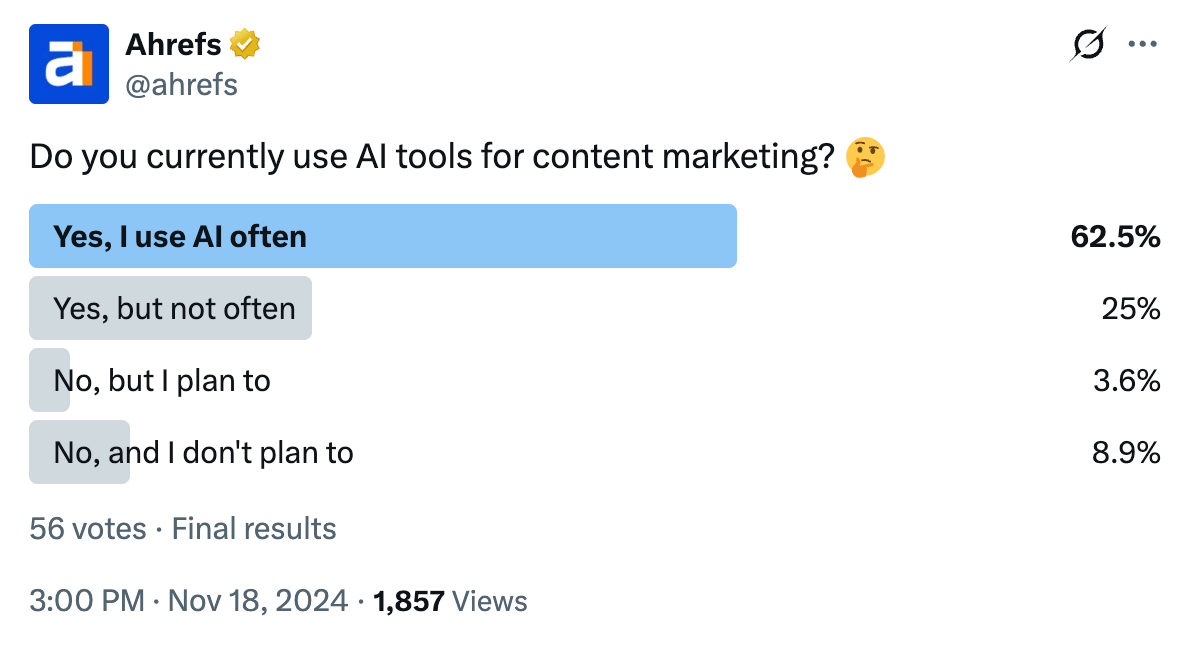
This year, I didn’t even bother asking—industry trends make the answer clear. AI has become the standard. I rely on it so heavily myself now that I can’t imagine how I ever worked without it.
For context, it took seven years for smartphones to become ubiquitous, and around nine years for social media to become ubiquitous, as Andy Crestodina noticed in one of his latest studies.
- 74% of new web content is created with generative AI. (Ahrefs, 2025)
- Only 26% of new web content is entirely human-created. (Ahrefs, 2025)
- 80% of marketers manually review AI content for accuracy. (Ahrefs, 2025)
- Human-written content costs 4.7× more than AI-generated content. (Ahrefs, 2025)
- 51% of companies plan to increase their spend on AI content. (Ahrefs, 2025)
- 84% of companies do not disclose the use of AI in their content. (Ahrefs, 2025)
- 87% of companies use AI primarily to create blog post content. (Ahrefs, 2025)
- Websites using AI grow 5% faster than those that don’t. (Ahrefs, 2025)
97% of companies edit and review AI content. Only 4% publish ‘pure’ AI-generated content. (Ahrefs, 2025) - Only 5% of marketers have no concerns about AI, showing nearly universal awareness of AI limitations. (Orbit Media, 2025)
- The top five uses of AI in content production are generating outlines (92%), idea generation/keyword research (88%), research assistance (80%), writing simple content sections (73%), and generating entire blogs to be edited by humans (52%). (Flying Cat, 2024)
- 85% of marketers report that AI improved content quality. (Rockcontent, 2024)
- 84% of marketers said AI tools enhanced efficiency in creating content. (Rockcontent, 2024)
- 75% of consumers trust content written by generative AI. (Capgemini, 2023)
- Google sends 345x more traffic to websites than ChatGPT, Gemini, and Perplexity combined. (Ahrefs, 2025)
- AI search platforms prefer to cite content that is 25.7% fresher than content cited in traditional organic results. (Ahrefs, 2025)
- 31% of Gen Zers most often use AI platforms or chatbots to find information online. (HubSpot, 2025)
We surveyed 879 marketers to understand how generative AI is changing content marketing: the workflows, the costs, the results…and the risks.
Download and read the full PDF report here (no email required):
The State of AI in Content Marketing.
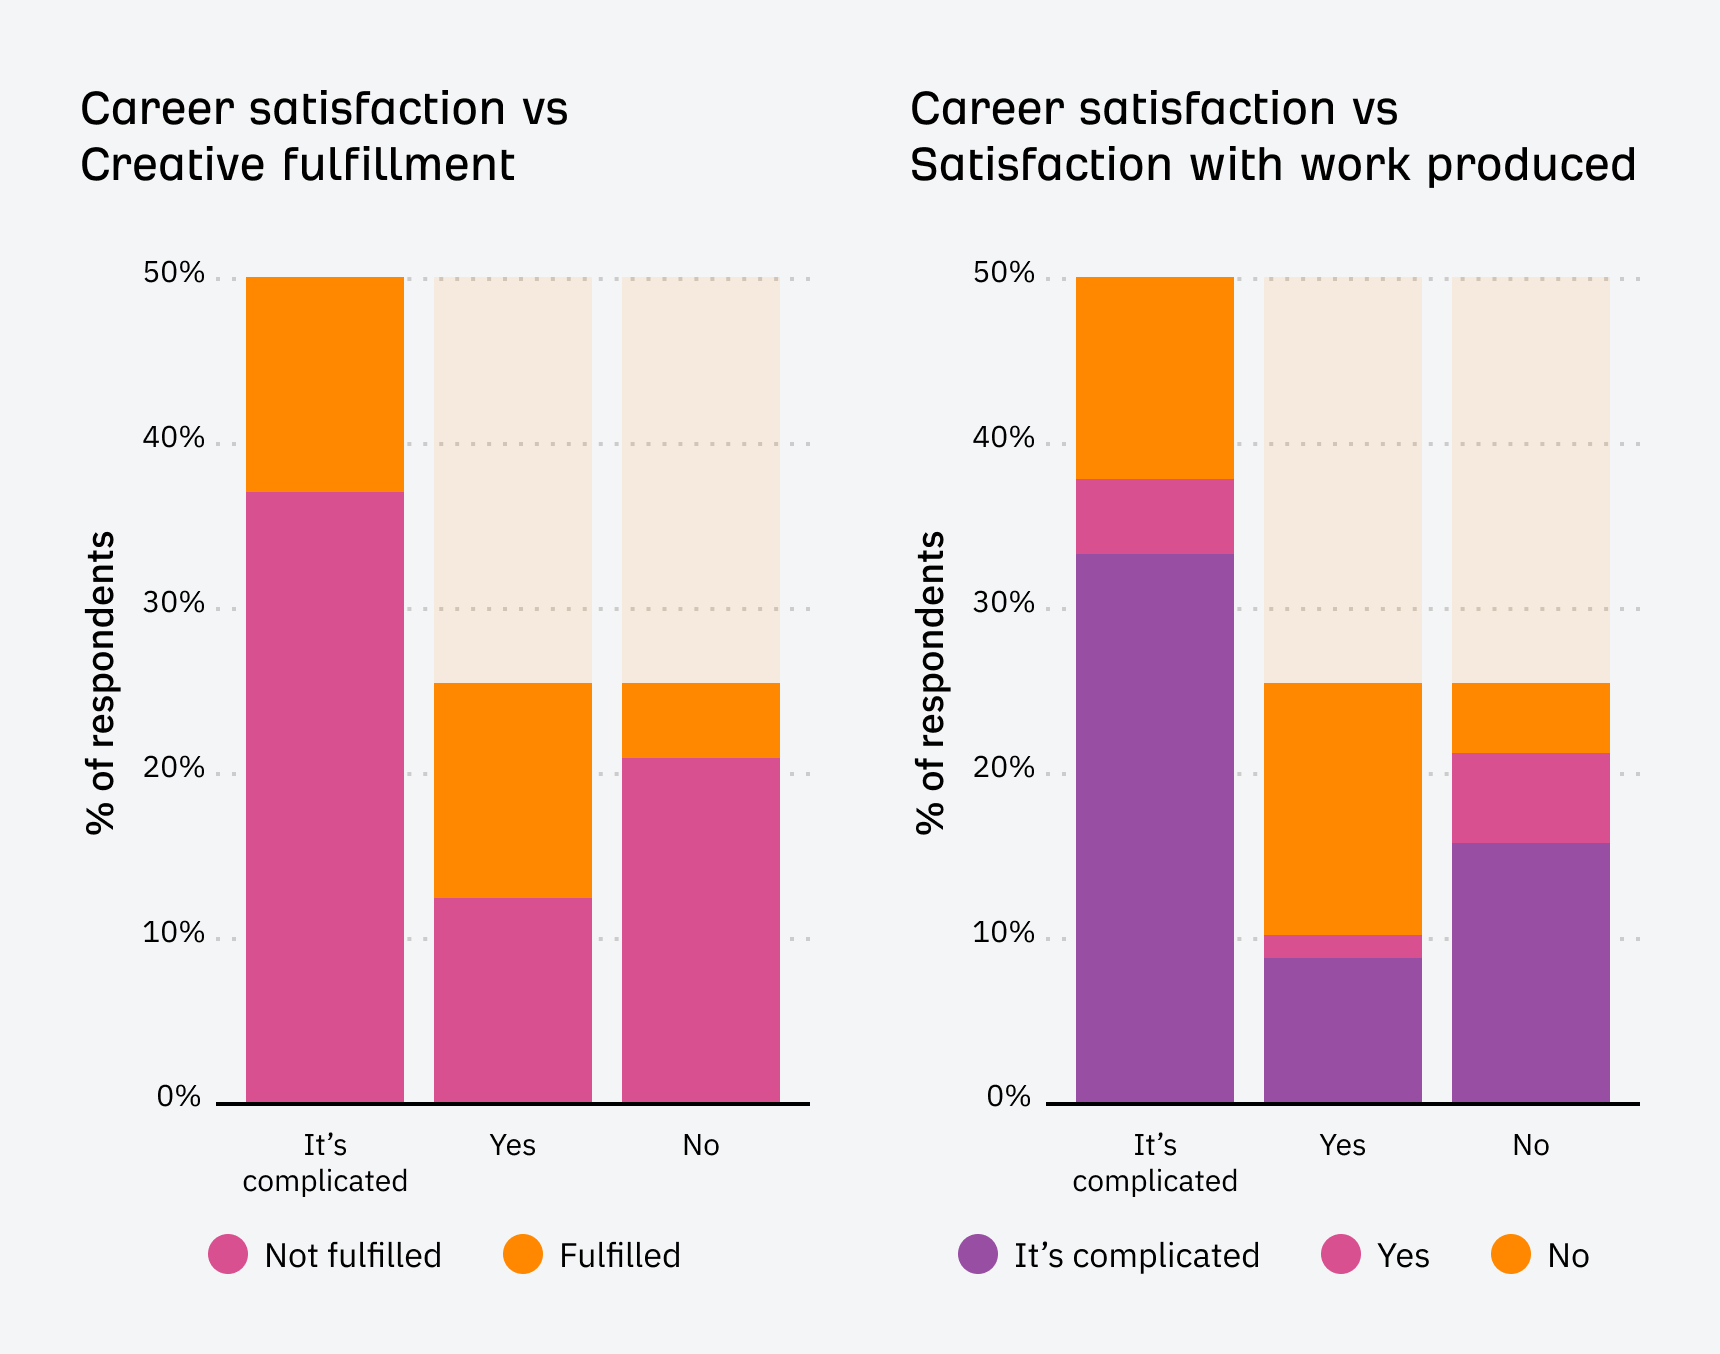
Content marketers are earning more than ever, but job security has slipped, with many experiencing layoffs over the past year. And despite the pay increases, money isn’t what makes people happiest in these roles. Creative freedom and the quality of the work matter far more, which is why only about half of marketers feel satisfied with their compensation.
- The most influential factors of whether or not someone is satisfied with their career are the quality of the work they’re producing and whether it allows them to produce creatively fulfilling work. (The Content Studio, 2024)

- The average total annual income of a content marketer is $111,891. This is up 0.48% over last year. (Superpath, 2025)
- Full-time content marketers make more on average than freelancers ($113,276 vs. $108,319). A switch in places since last year. (Superpath, 2025)
- 13% of content marketers were laid off in 2024. (Superpath, 2025)
- 49.24% of the content marketing community reports being “satisfied” or “very satisfied” with their salary. Meanwhile, 26.46% of people report feeling neutral, and 24.30% feel dissatisfied. (The Content Studio, 2024)
Marketing budgets are shifting, with more money flowing into content. Gen Z has become a major target, while interest in Boomers and Gen X has dropped off sharply.
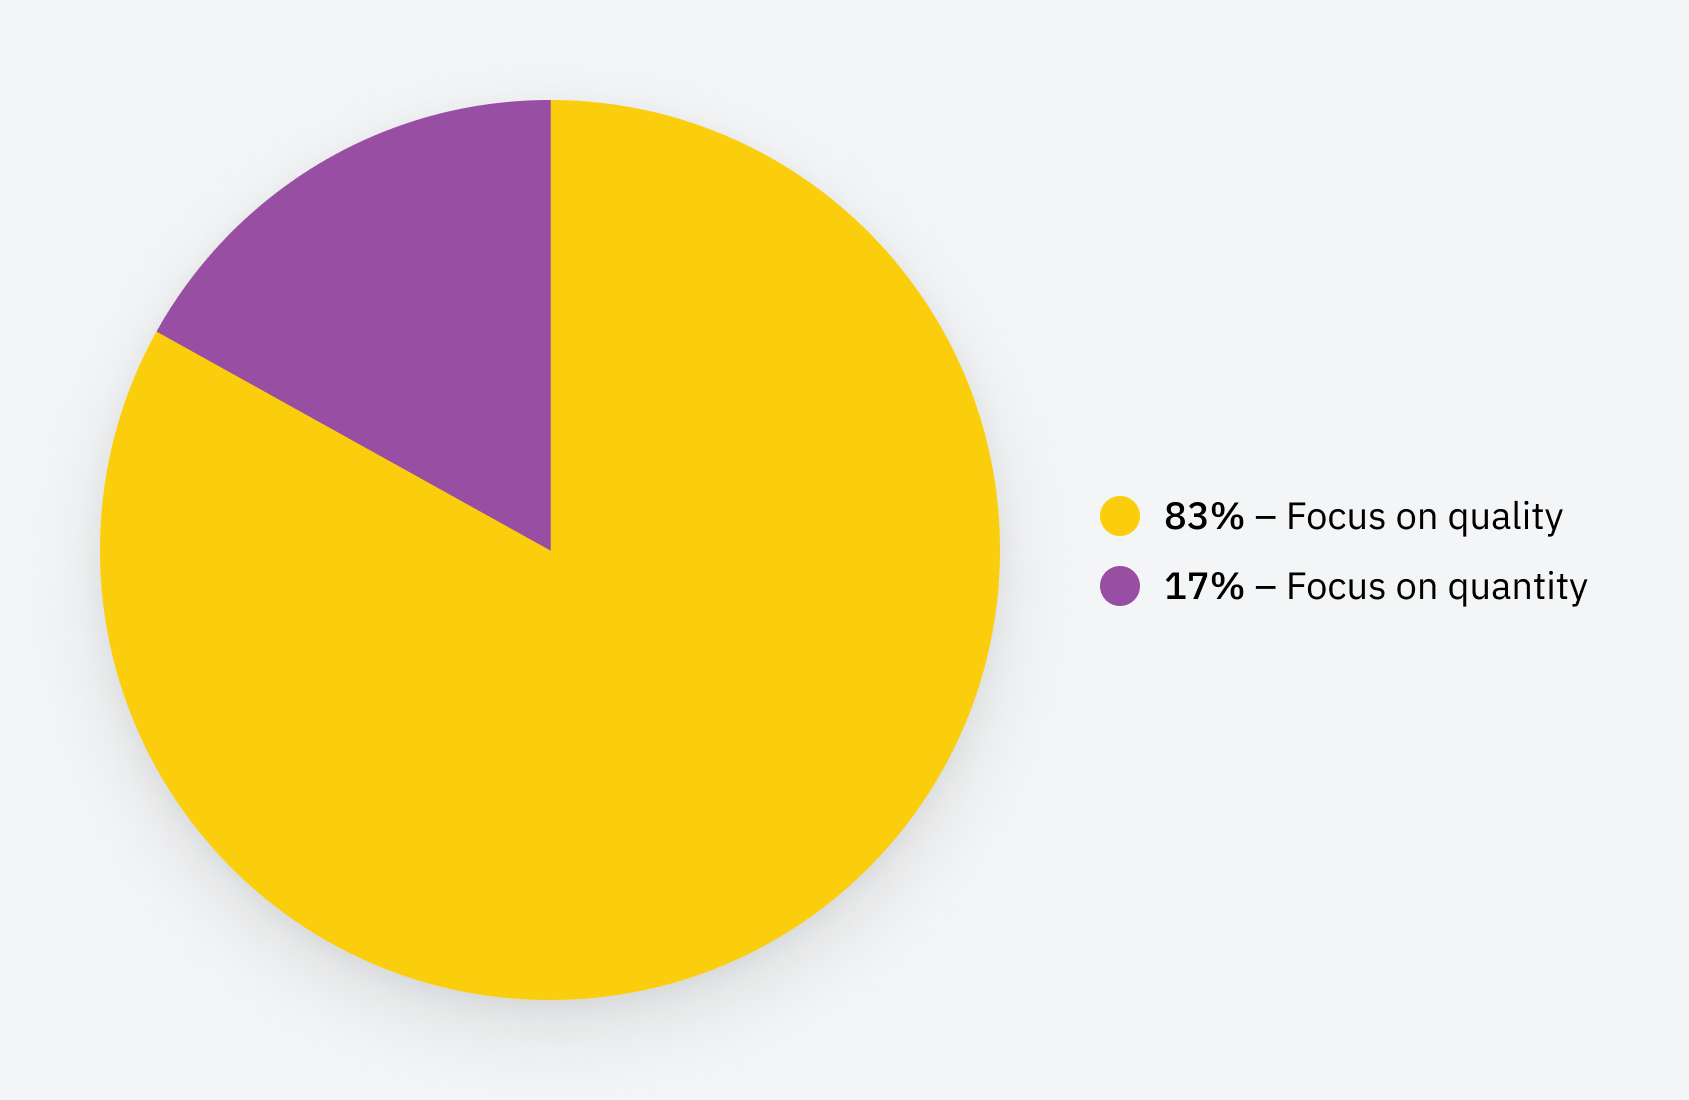
- 83% of marketers say it’s better to focus on quality rather than quantity of content, even if it means posting less often. (HubSpot, 2023)

- 87% of marketers report that content marketing generates demand/leads (up 11 points since 2023). 74% say it helps nurture audiences/customers, and 52% say it helps build loyalty. (CMI, 2024)
- The top marketing channels with the biggest ROI in 2024 were websites/blogs/SEO (16% of respondents), social media shopping tools like Instagram Shops (16%), followed by paid social media content (14%), email marketing (14%), and content marketing (14%). (HubSpot, 2025)
- The majority of leadership is mostly bought into content marketing programs, with 42% claiming they are mostly bought in and 29.9% extremely bought in. Only 2.3% don’t see the point in content marketing. (The Content Studio, 2024)
- Only 3% of marketers rate their content strategy as ineffective. They report a lack of clear goals, being unrelated to the customer journey, not being data-driven, and ineffective audience research as the top reasons for this. (CMI, 2025)
- Most commonly, 30-39% of overall marketing budget is allocated to content marketing. (Datalily, 2025)
- 72% of the most successful marketers in North America measure the ROI of their content marketing. (eMarketer, 2018)
- Interest in Gen Z from marketers is up year over year: 33% B2B, 39% B2C, while interest in Gen X and Baby Boomers is down 30%+ year over year. (HubSpot, 2025)
- Almost half of content programs now publish original research, and 25% of those who do report strong results. (Orbit Media, 2025)
Almost every B2B marketer now has a clear content strategy in place, and the top priorities are obvious: video, thought leadership, and making the most of AI. LinkedIn remains the standout platform for results, and original research has become a powerful way to stand out—most teams plan to invest more in it, and many say content backed by their own data delivers noticeably better conversions.
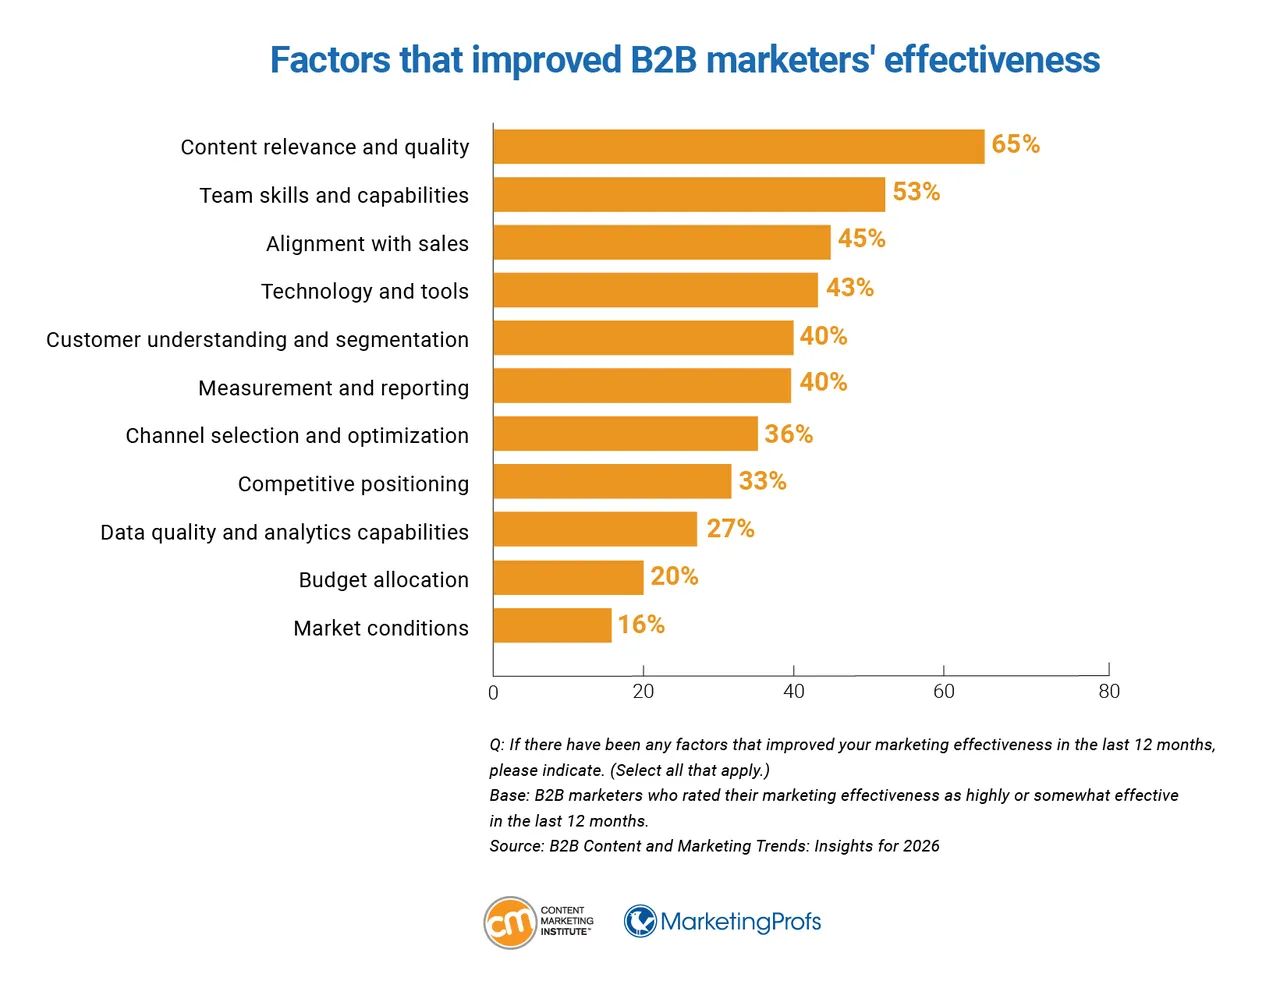
- The top three factors that improve B2B content marketing are content relevance and quality, team skills and capabilities, and alignment with sales. (CMI, 2025)

- Only 3% of B2B marketers don’t have a content marketing strategy. (CMI, 2025)
- 85% of marketers voted for LinkedIn as the best-performing social media platform, followed by Facebook (28%) and YouTube (22%). (CMI, 2024)
- For B2B: Top ROI channels are 1) website/blog/SEO, 2) paid social media, 3) social media shopping tools. (HubSpot, 2025)
- 86% of marketers plan to increase proprietary research budgets in 2026, showing this trend isn’t slowing down. (Datalily, 2025)
- 50% of B2B SaaS marketing teams conduct market research monthly for content marketing purposes. (Datalily, 2025)
- 64% of marketers reported higher conversion rates from content-sourced leads since adopting proprietary research, and 61% reported improved SEO rankings and organic traffic. (Datalily, 2025)
B2C marketers have locked onto a formula that works. Email delivers the strongest returns, outperforming every other organic channel. Short articles, videos, and data visuals are the content types getting the best traction, while Facebook, LinkedIn, and Instagram lead the pack for organic social reach.
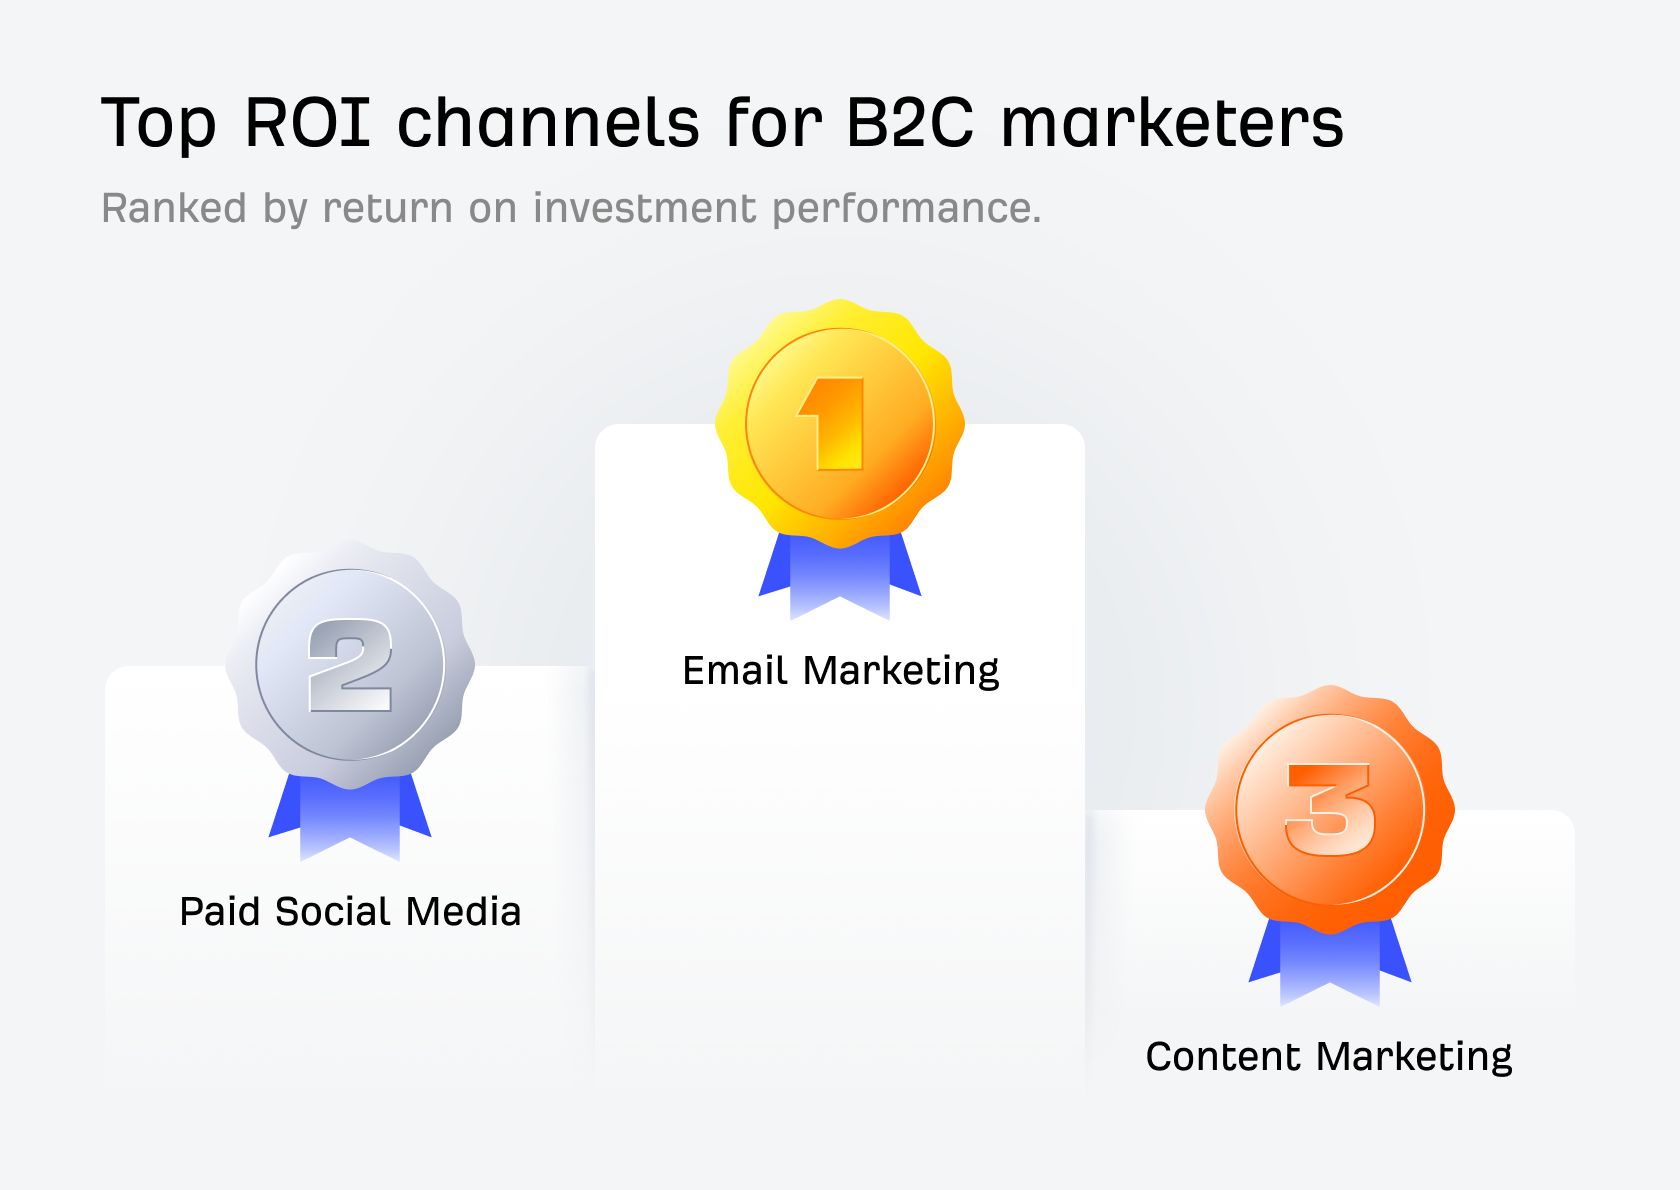
- For B2C marketers, the top ROI channels are 1) email marketing, 2) paid social media, 3) content marketing. (HubSpot, 2025)

- Only 5% of B2C marketers don’t plan to develop a content marketing strategy. (CMI, 2021)
- 65% of B2C marketers prioritize the audience’s informational needs over the organization’s sales/promotional messages. (CMI, 2021)
- B2C marketers who use nonpaid social media platforms report that Facebook (63%), LinkedIn (53%), and Instagram (39%) produced the best overall content marketing results. (CMI, 2021)
- 73% of B2C marketers employ keyword research for SEO when creating content. (CMI, 2021)
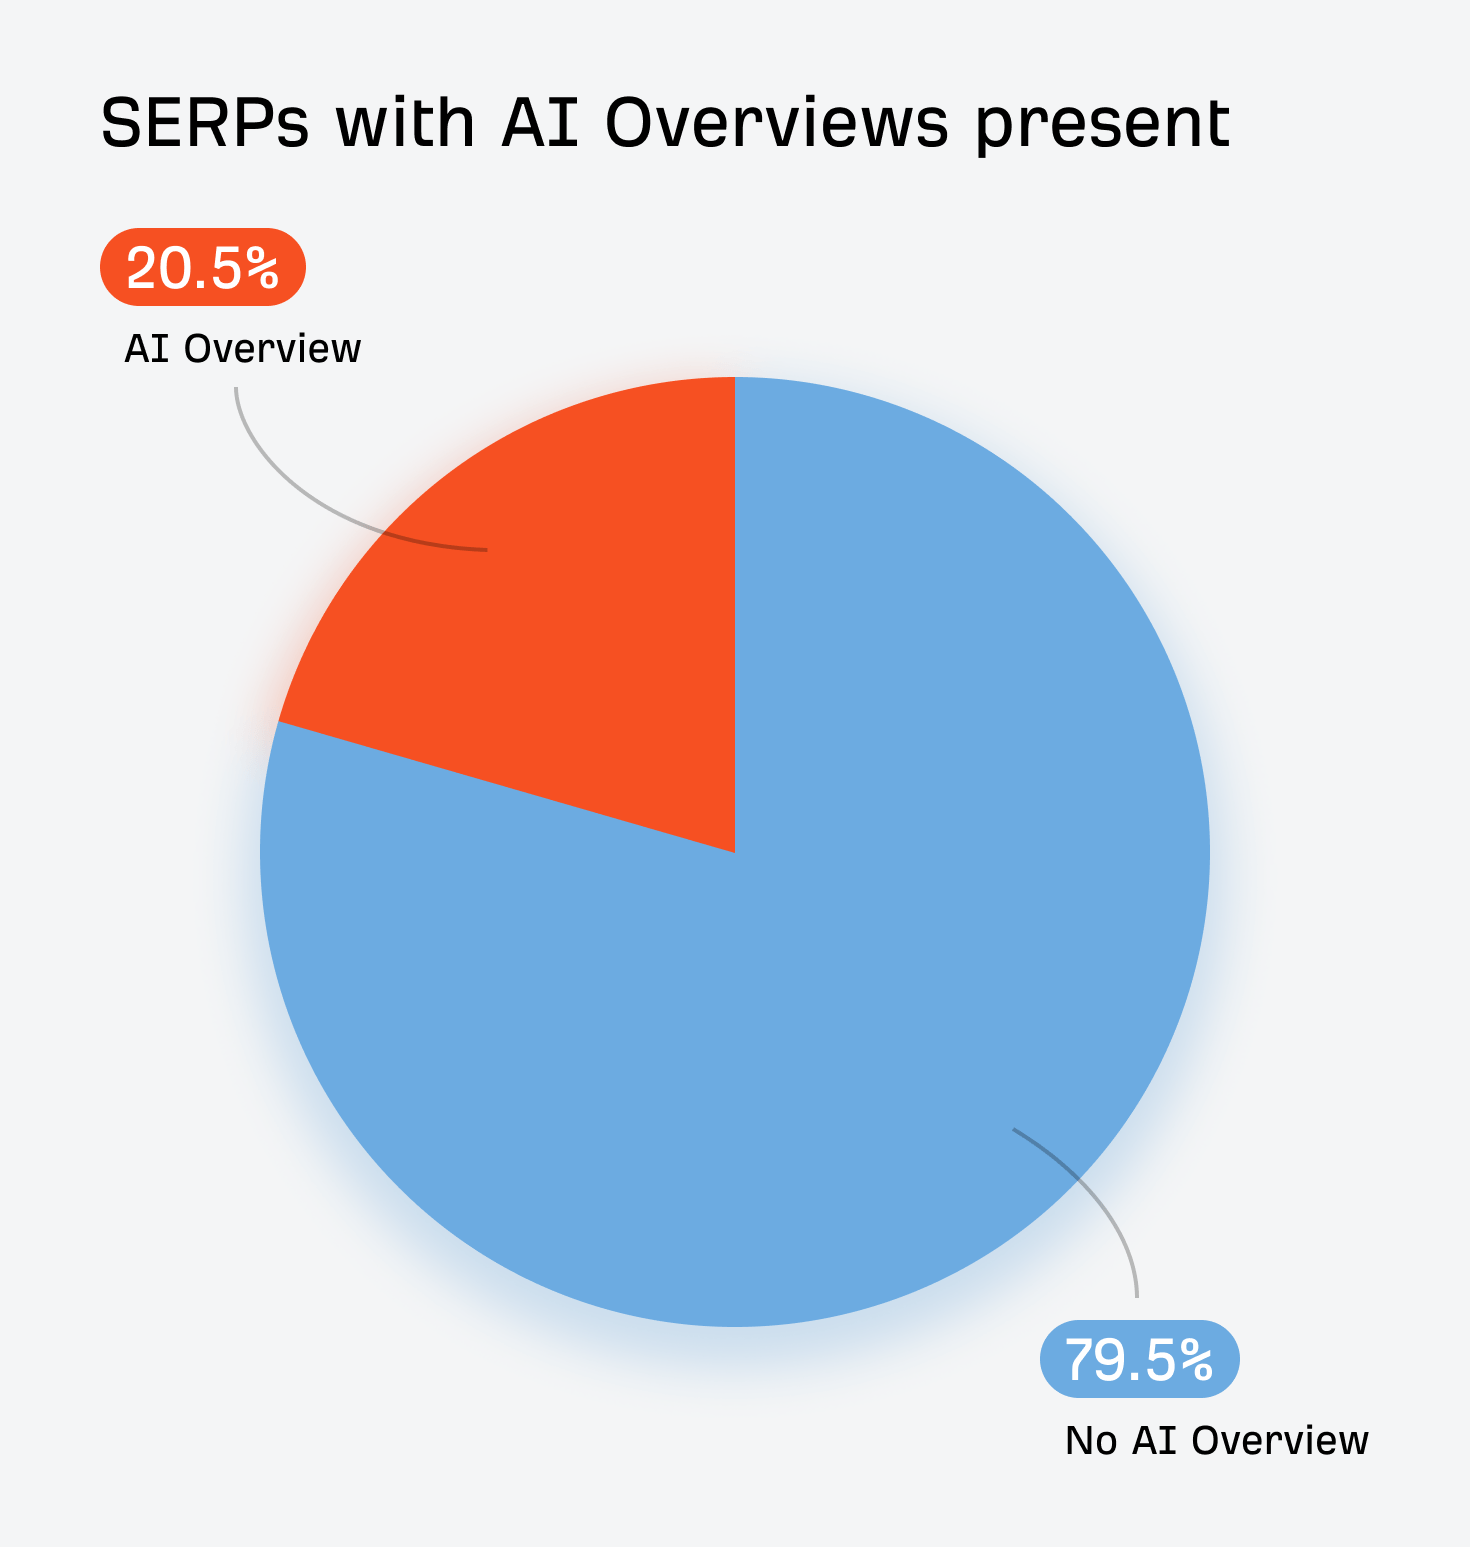
It’s harder than ever for new pages to break into Google’s top results. AI Overviews now show up for a noticeable share of searches, but Google still sends vastly more traffic than AI chat tools. And a large portion of searches are for brands people already recognize, making it even tougher for new content to stand out.
- Google’s AI Overviews appear on 21% of all keywords, and 99.9% of AIOs appear on Informational intent keywords. (Ahrefs, 2025).

- 76% of AI Overview citations pull from top 10 ranking pages on Google. (Ahrefs, 2025).
- Google’s AI Overviews change every two days but stay consistent in their underlying meaning. (Ahrefs, 2025)
- There is a near-zero correlation between word length and being cited in AI Overview responses. (Ahrefs, 2025)
- Google sends 345x more traffic to websites than ChatGPT, Gemini, and Perplexity combined. (Ahrefs, 2025)
- Nearly half of all Google searches (45.7%) are branded searches—meaning people are actively seeking out specific companies and products they already know. (Ahrefs, 2025)
- 96.98% of clicks happen in the top 10 search results. (Ahrefs, 2025)
- 96.55% of pages get no organic search traffic from Google. (Ahrefs, 2023)
- Google is the most widely used search engine worldwide, with 89.94% of the market. (Statcounter, 2025).
- Only 1.74% of newly published pages rank in the top 10 within a year (down from 5.7% in 2017). (Ahrefs, 2025)
- 37.9% of advertised websites already rank in the top 10 organically for the same keyword. (Ahrefs, 2025).
- 32% of Nasdaq companies with at least 100k annual traffic have a moderate or strong positive correlation between organic traffic and stock price. (Ahrefs, 2025)
TikTok is still surging, while X has faded to a niche platform for daily use. Consistent posting has become the real growth engine—creators who stick with it see far higher engagement.
- The top 3 social media platforms in the US are YouTube (used by 84% of U.S. adults), Facebook (used by 71%), and Instagram (used by 50%) (Pew Research, 2025)
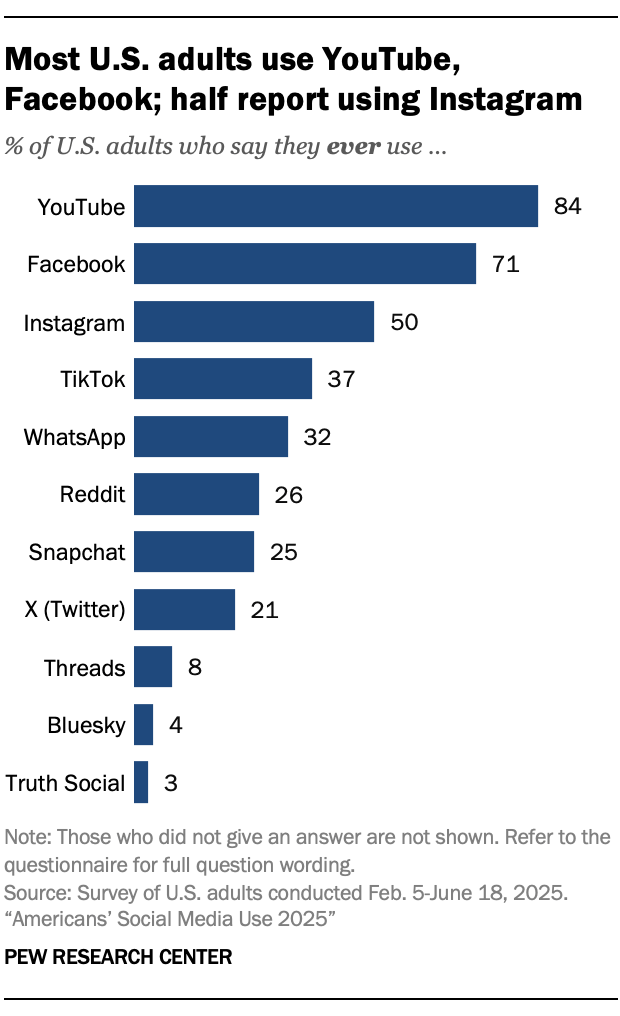

- 50% of adults visit Facebook and YouTube daily - These platforms offer daily touchpoint opportunities with your audience. (Pew Research, 2025)
- TikTok usage jumped from 21% (2021) to 37% (2025). (Pew Research, 2025)
- Only 10% of adults use X (Twitter) daily. (Pew Research, 2025)
- 83% of marketers say quality beats quantity in social media marketing. (Pew Research, 2025)
- Creators who post at least once a week for 20+ weeks see 450% more engagement per post than those posting fewer than 5 times over the same period. Even 5-19 weeks of consistency yields 3.4× more engagement. (Buffer, 2025)
- 85% of marketers report AI improved content quality, and 86% say it saves them 1+ hours daily. However, 45% of companies have no AI usage guidelines. (Buffer, 2025)
- Median social media engagement climbed from 6.00% to 8.01% (Jan 2024-Jan 2025), making it the strongest platform for organic engagement. (HootSuite, 2025)
- Threads has 73.6% higher median engagement (6.25% vs 3.60%) and 83.5% higher average engagement than X, despite a smaller user base. (HootSuite, 2025)
- TikTok videos over 60 seconds earn 95.7% more reach vs 5-10 second clips, 264.5% more watch time vs ultra-short content, and 43.2% more reach vs 30-60 second videos. (HootSuite, 2025)
- TikTok, IG Reels, and live streaming were the most effective social formats. (HootSuite, 2025)
- Nearly half of brands dedicate 60%+ of social content to entertaining, educating, or informing without directly promoting products. (HootSuite, 2025)
- AI use for content creation has skyrocketed, with image editing up 180%, image generation up 86%, and text rewrites up 95%. (HootSuite, 2025)
- Consumers say personalized customer service should be brands’ top social media priority in 2025. (Sprout Social, 2025)
- 73% of social users say they’ll buy from a competitor if a brand doesn’t respond on social. (Sprout Social, 2025)
- Second only to product quality, consumers say original content is what makes brands stand out. (Sprout Social, 2025)
- Nearly half of brands dedicate 60%+ of their social content to entertaining, educating, or informing without directly promoting their products. (HootSuite, 2025)
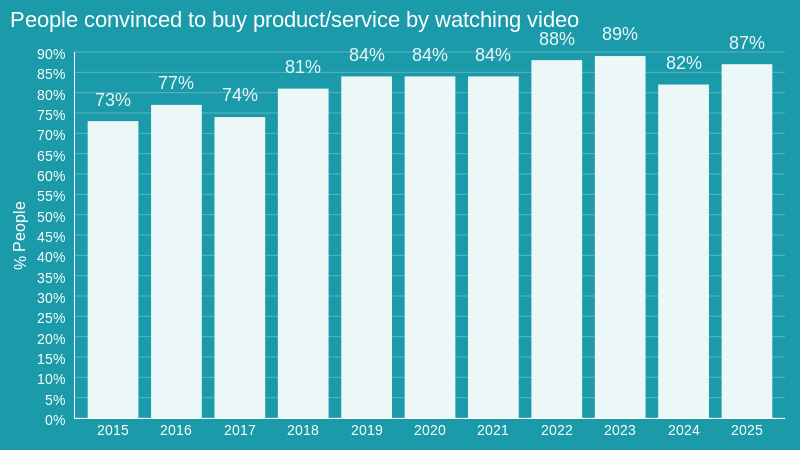
Video has held the top spot for years, and it’s easy to see why. Most people say videos have influenced their buying decisions, especially for software, apps, and products they’ve discovered on YouTube.
- 87% of people say they’ve been convinced to buy or download a piece of software or app by watching a video (a 5 percentage point increase since last year). (Wyzowl, 2025)

- For both B2B and B2C brands, the top-performing content format in 2024 was short-form video. (HubSpot, 2025).
- 70% of viewers bought a product after seeing it on YouTube. (Google, 2020)
- YouTube is the #2 visited website in the U.S. by estimated organic traffic. (Ahrefs, 2025)
- YouTube is the #2 most cited domain in Google’s AI Mode and AI Overviews (Ahrefs, Ahrefs, 2025)
- YouTube reaches more 18 to 49-year-olds in an average week than all cable TV networks combined. (Google, 2018)
- Video viewers say relating to their passions is 1.6X more important than content with high production quality. (Google, 2018)
- 89% of businesses use video as a marketing tool (same as last year). (Wyzowl, 2025)
- 98% of people have watched an explainer video to learn more about a product or service (a 7 percentage point decrease since last year). (Wyzowl, 2025)
- 83% of people wanted to see more videos from brands in 2023 (a 6 percentage point decrease since last year). (Wyzowl, 2024)
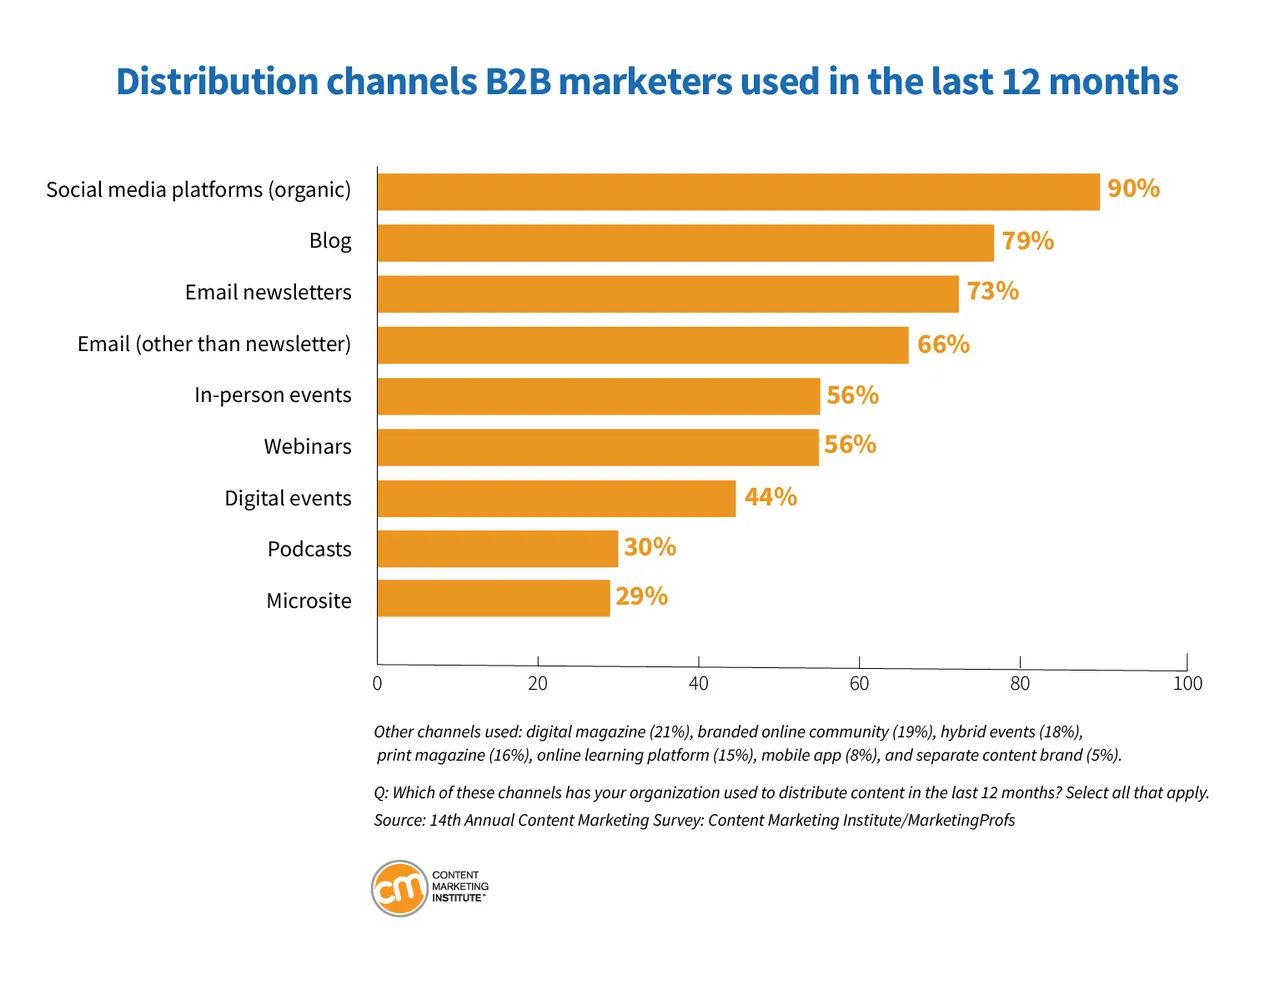
Email is still one of the most reliable channels for reaching an audience. It’s a staple for B2B teams and delivers the strongest returns for many B2C brands
- Email was in the top three distribution channels for B2B content in 2024. 73% reported using newsletters, and 66% using other types of email for this purpose. (CMI, 2024)

- For B2C brands, the channel with the best ROI was email marketing. (HubSpot, 2025)
- Emails with subject lines in the 61-70 character range have the highest open rate, on average. (GetResponse, 2024)
- 95% of marketers who use generative AI for email creation rate it “effective”, with 54% rating it “very effective.” (HubSpot, 2023)
- On average, emails containing video increased open rate by 4–12 percentage points and click-through rate by 0.97–2.04 percentage points compared to emails without embedded videos. (GetResponse, 2024)
- 80% of marketers say personalization in emails (such as subject lines or dynamic content) improves performance; only 5% don’t personalize emails. (Litmus, 2024)
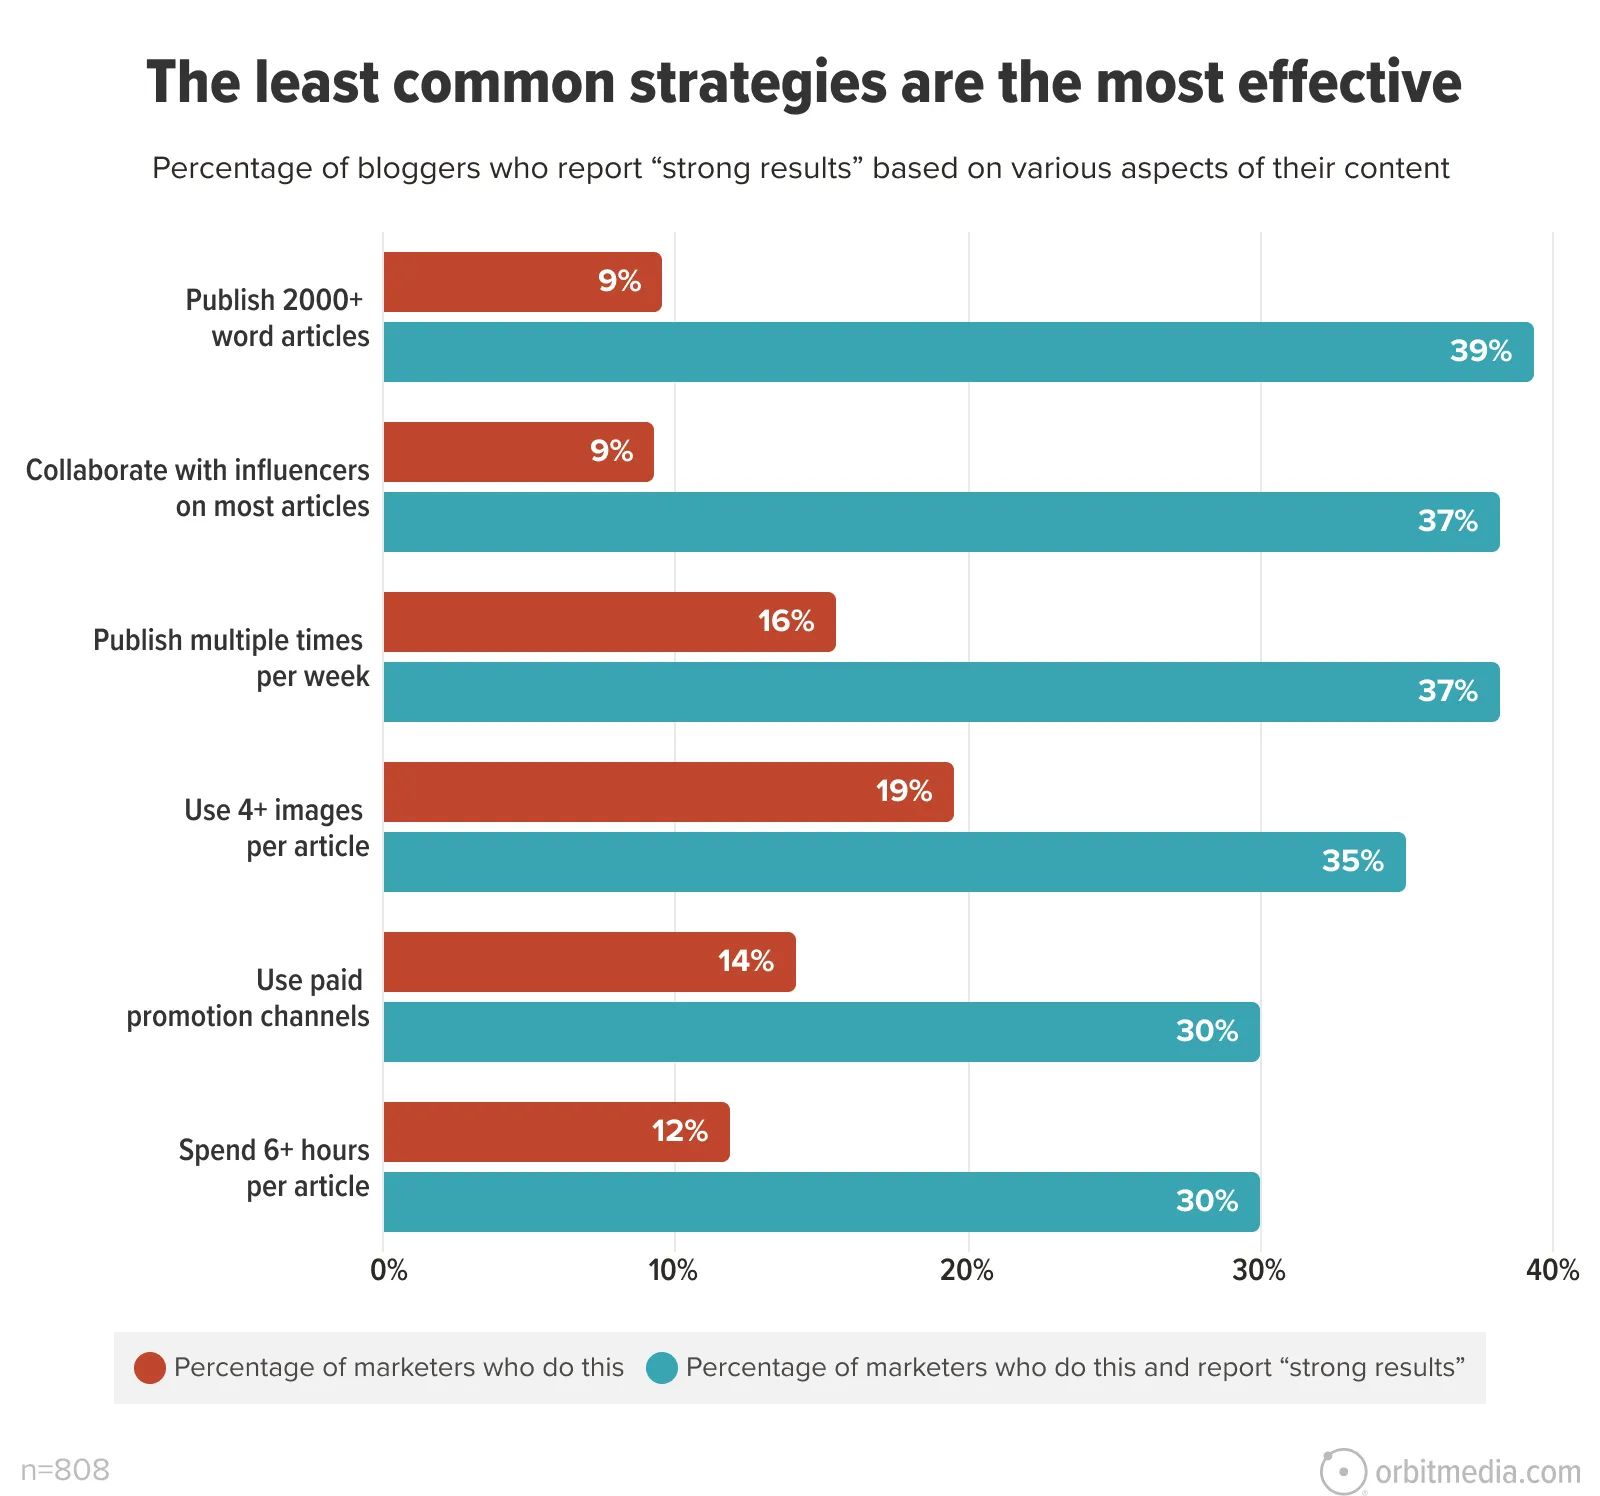
Content marketers usually know what actually works, they just get stuck chasing shortcuts.
- The most effective tactics (long-form content with visuals, influencer collaboration, original research, guest blogging, consistent analytics) are the LEAST commonly used approaches. (Orbit Media, 2025)

- 85.19% of all blog traffic comes from organic search. (Animalz, 2021)
- On average, engagement starts to drop after 7 minutes of reading. (Medium, 2013)
- Average article length in 2025: 1,333 words, reversing the 10-year trend of longer content. (Orbit Media, 2025)
- Only 1/3 of marketers check the performance of each published article, yet those who use analytics more frequently are significantly more likely to report strong results. (Orbit Media, 2025)
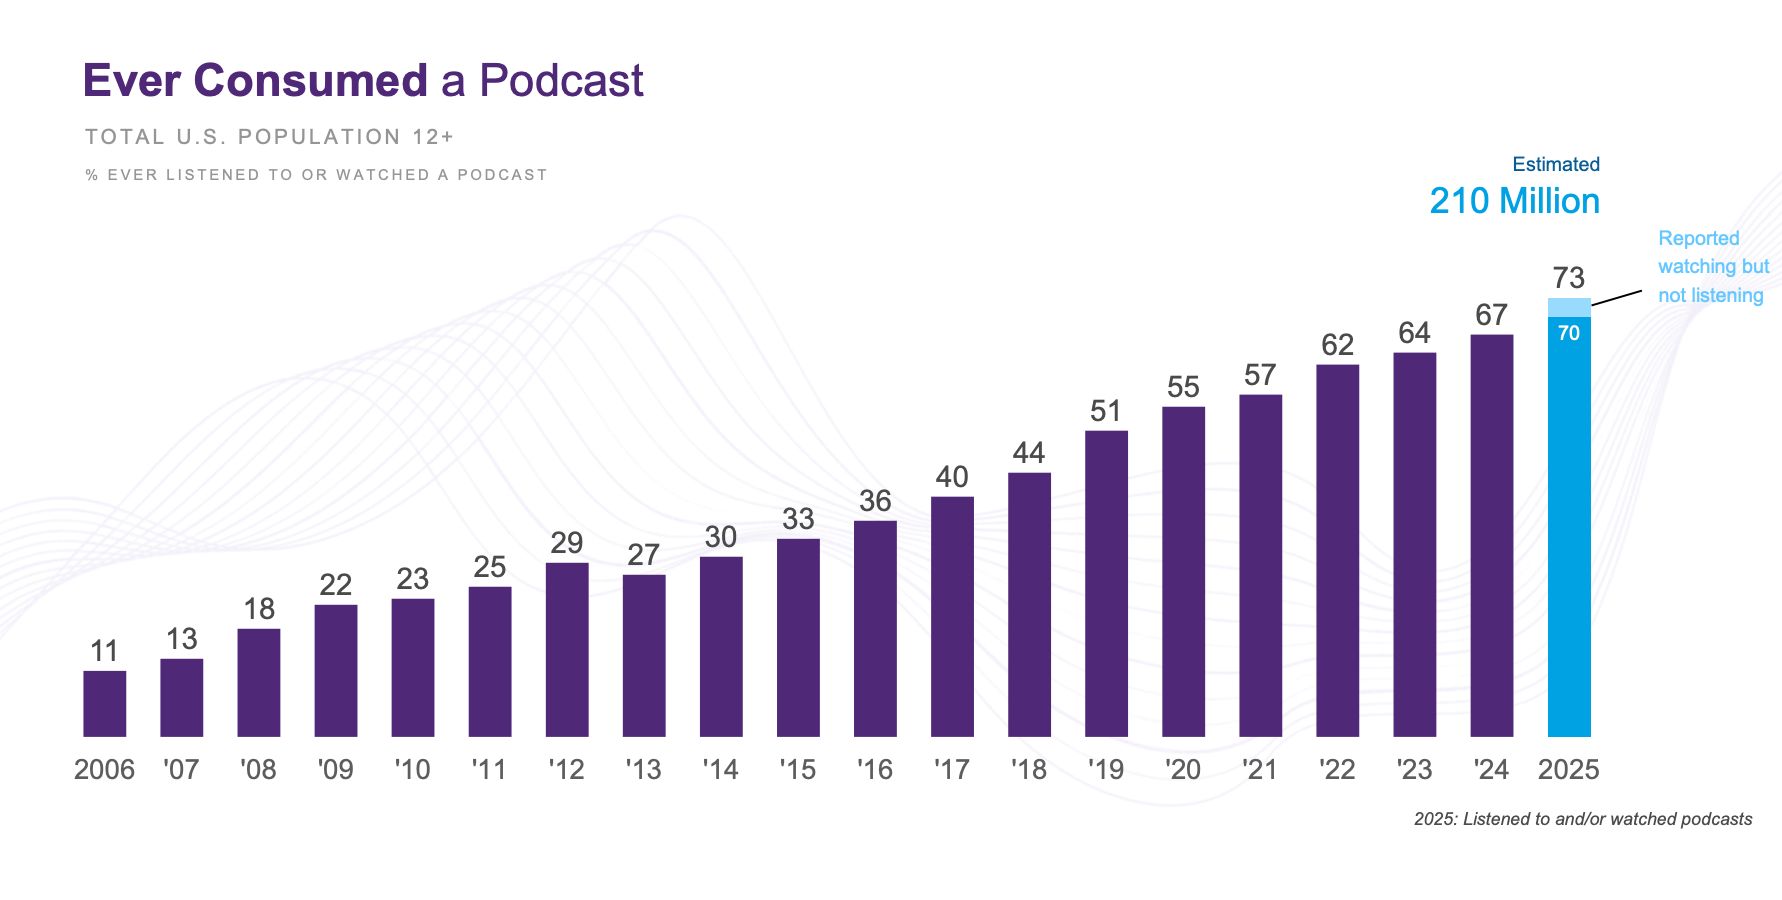
Podcasting has fully gone mainstream. Most Americans have tried it, and more than half listened recently. The format holds people’s attention better than almost anything else, with most listeners staying through entire episodes. And it’s become a powerful advertising channel.
- 73% of Americans listened to a podcast as of 2025 (a 6 percentage points increase from last year), and 55% listened to a podcast last month. (Edison Research, 2025)

- Monthly podcast consumers skew higher socioeconomic status, with 51% holding college degrees (vs. 46% of the general population) and 47% earning $75K+ (vs. 43% nationally). (Edison Research, 2025)
- 68% of weekly podcast consumers 13+ don’t mind hearing ads on podcasts. (Edison Research, 2025)
- 44% of weekly podcast listeners have purchased a product or service as a result of hearing an ad on a podcast. (Edison Research, 2025)
- 80% of podcast listeners listen to all or most of each episode. (Podcast Insights, 2021)
- Podcast ad spending in the U.S. is expected to reach $4.7B in 2025, a 5.83% increase from 2024. (Statista, 2024)
Some of the data reveals an interesting paradox: we know exactly what works, yet most marketers still won’t do it. Long-form content with visuals, influencer collaboration, original research, and consistent analytics are proven winners, yet they remain the least commonly used tactics. Meanwhile, AI adoption hit 87% in under two years because it makes things easier, not necessarily better.
Got questions or comments? Let me know on LinkedIn.


