In a nutshell: for a whole website, a good organic CTR usually falls between 1% and 2%. But that figure varies a lot by industry, authority, and website size.
Below, we break down median organic CTR by industry, by Domain Rating (DR), and by website size—then look at why CTR is falling across the board, thanks to AI Overviews and AI search.
This article is updated with fresh data every month by Agent A.
- This is data from real websites. These benchmarks are built from anonymized, aggregated Google Search Console data from 422,421 real websites. We take each site’s actual clicks and impressions straight from GSC, aggregate them, and report the figures for the latest complete month.
- This is whole-site CTR, not position-1 CTR. For each site we divide its total clicks by its total impressions for the month. That’s why these numbers (low single digits) sit far below the “position 1 ≈ 30–40%” figures you’ll see elsewhere, and why they (sadly) match the CTR in your own Search Console overview.
- We report the median, not the average. A few giant sites (think Wikipedia or Amazon) pull averages up and flatter the typical site. The median—the site in the middle of each group—is the better benchmark. (We show the mean alongside it for contrast.)
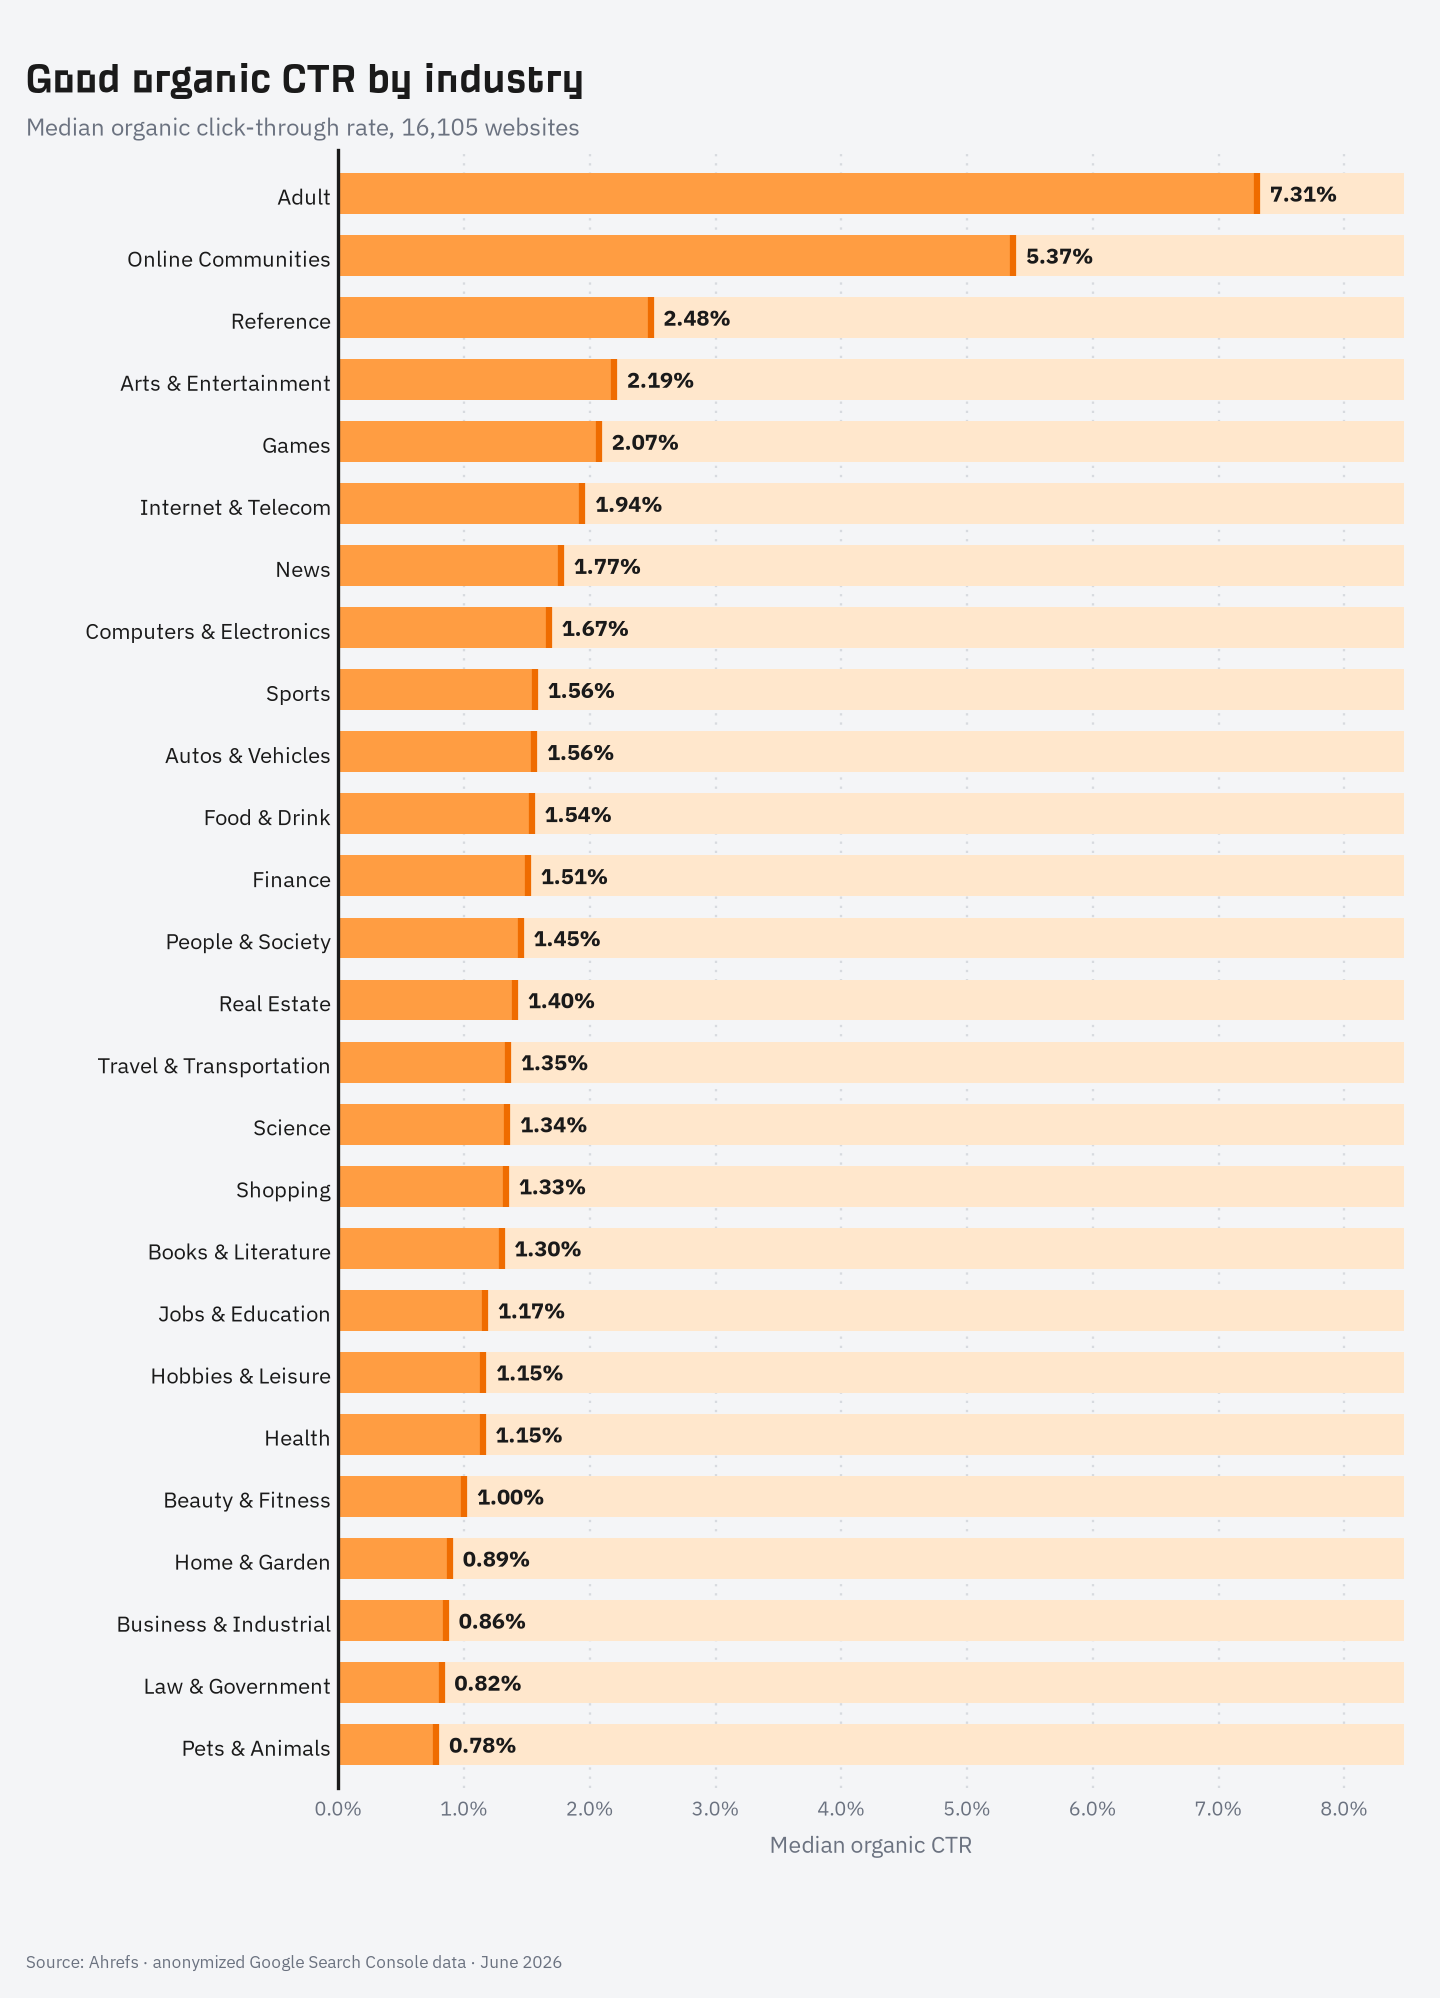
Here’s the median organic CTR for all 26 industry categories, ranked highest to lowest, for June 2026.
| Industry | Median CTR | Mean CTR | Sites |
|---|---|---|---|
| Adult | 7.31% | 11.04% | 161 |
| Online Communities | 5.37% | 7.45% | 17 |
| Reference | 2.48% | 7.20% | 16 |
| Arts & Entertainment | 2.19% | 4.23% | 522 |
| Games | 2.07% | 4.67% | 662 |
| Internet & Telecom | 1.94% | 4.45% | 378 |
| News | 1.77% | 2.69% | 476 |
| Computers & Electronics | 1.67% | 3.89% | 516 |
| Sports | 1.56% | 2.82% | 676 |
| Autos & Vehicles | 1.56% | 2.56% | 776 |
| Food & Drink | 1.54% | 2.95% | 680 |
| Finance | 1.51% | 2.66% | 1,167 |
| People & Society | 1.45% | 3.21% | 268 |
| Real Estate | 1.40% | 2.25% | 304 |
| Travel & Transportation | 1.35% | 2.52% | 1,240 |
| Science | 1.34% | 3.14% | 128 |
| Shopping | 1.33% | 2.51% | 2,245 |
| Books & Literature | 1.30% | 2.73% | 79 |
| Jobs & Education | 1.17% | 2.07% | 1,274 |
| Hobbies & Leisure | 1.15% | 1.93% | 28 |
| Health | 1.15% | 2.13% | 1,624 |
| Beauty & Fitness | 1.00% | 2.00% | 193 |
| Home & Garden | 0.89% | 1.64% | 1,341 |
| Business & Industrial | 0.86% | 1.84% | 824 |
| Law & Government | 0.82% | 1.47% | 251 |
| Pets & Animals | 0.78% | 1.46% | 259 |
A few things stand out, and most of them come back to one thing: how often Google answers the query for you.
- Adult websites sit in a league of their own, at 7.53%, more than double the next category. Part of the reason is that these SERPs stay—ironically—very clean. Our study of what triggers AI Overviews found only 4% of NSFW queries return an AI Overview, so there’s rarely an AI answer (or other SERP feature) intercepting the click.
- The “answer-heavy” categories sit at the bottom, and they’re the same categories that trigger the most AI Overviews. Pets & Animals (0.80% CTR here) trigger an AIO on 36.8% of queries; Health (1.12%) on 43.0%; Science (1.36%) on 43.6%. When Google answers the question on the page, fewer people click through.
- Informational and question queries are the most exposed. AI Overviews appear on 57.9% of all question queries, and 99.9% of AIOs show on informational intent. So the more your niche skews toward “how/what/why” searches, the more an AIO is likely sitting between your result and the click.
- Most industries cluster between 1% and 2%. If you’re a typical content or commerce site, that band is your realistic benchmark.
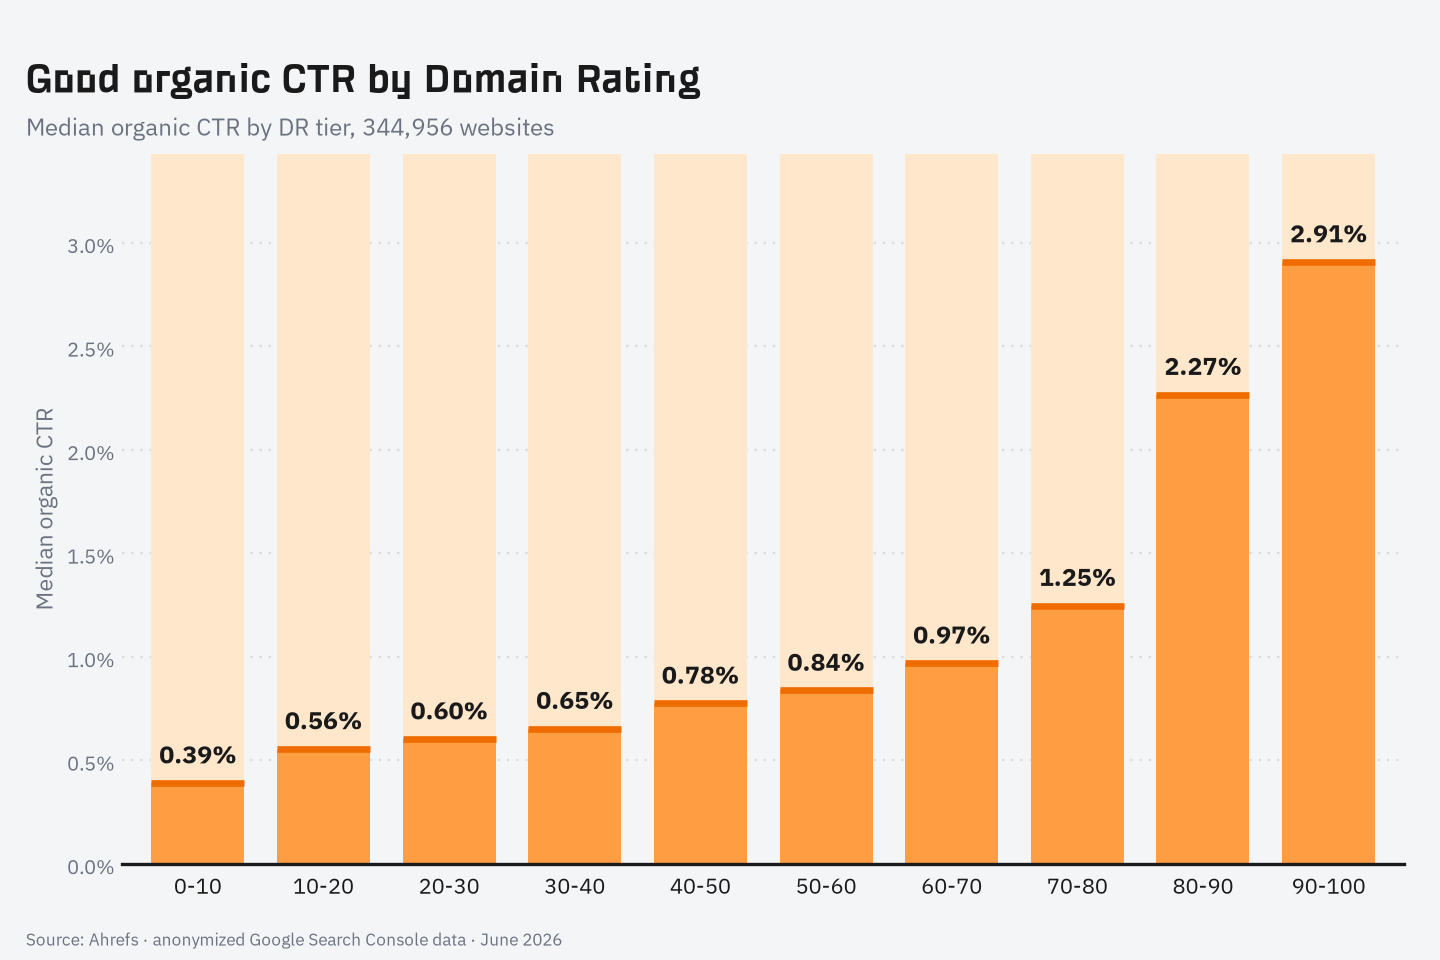
Recognition earns clicks, and the stronger your site (measured here by Domain Rating), the more likely searchers are to click your result over a competitor’s.
Across 422,421 websites, median CTR climbs steadily as DR rises, from 0.43% at the bottom to 2.56% at the top—roughly a 6x difference. And the climb is remarkably consistent: every single DR tier has a higher median CTR than the one below it, with no exceptions — a clean, near-linear rise all the way up the scale.
| Domain Rating | Median CTR | Mean CTR | Sites |
|---|---|---|---|
| 0-10 | 0.39% | 1.69% | 165,663 |
| 10-20 | 0.56% | 1.51% | 50,510 |
| 20-30 | 0.60% | 1.53% | 44,178 |
| 30-40 | 0.65% | 1.59% | 34,027 |
| 40-50 | 0.78% | 1.61% | 19,291 |
| 50-60 | 0.84% | 1.67% | 14,165 |
| 60-70 | 0.97% | 1.81% | 7,777 |
| 70-80 | 1.25% | 2.52% | 7,414 |
| 80-90 | 2.27% | 4.91% | 1,534 |
| 90-100 | 2.91% | 7.43% | 397 |
To be clear about cause and effect: chasing more backlinks to push up your DR won’t make people click. DR doesn’t show up in the SERP, and nobody clicks a result because of its referring-domain count. What’s probably happening is that the same brands recognizable enough to earn a high DR are also the brands searchers recognize and trust in the results—so they get the click. DR is a proxy for that recognition, not the cause of it.
The takeaway for newer sites: a sub-1% CTR isn’t a failure, it’s the norm when you’re under DR 40. CTR improves as you build authority, but it’s a slow climb, not a switch you can flip.
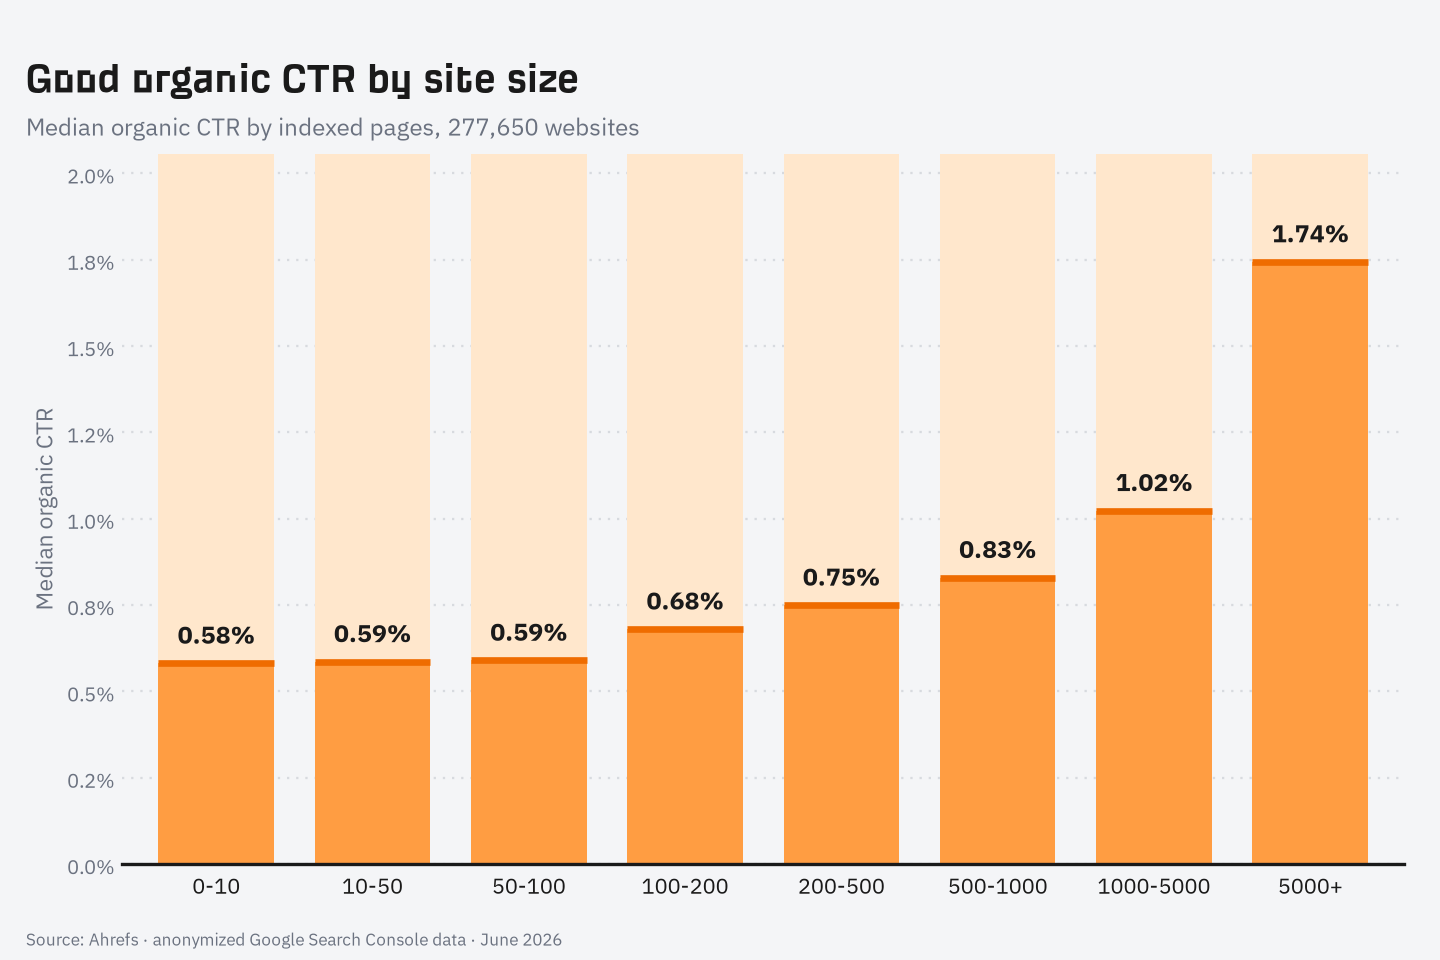
Bigger sites tend to earn higher CTR too—partly because size correlates with authority, and partly because large sites rank for more branded and navigational queries (where people are specifically looking for them).
| Indexed pages | Median CTR | Mean CTR | Sites |
|---|---|---|---|
| 0-10 | 0.58% | 2.03% | 108,081 |
| 10-50 | 0.59% | 1.28% | 87,037 |
| 50-100 | 0.59% | 1.18% | 26,846 |
| 100-200 | 0.68% | 1.22% | 19,444 |
| 200-500 | 0.75% | 1.32% | 16,648 |
| 500-1000 | 0.83% | 1.41% | 7,651 |
| 1000-5000 | 1.02% | 1.69% | 8,360 |
| 5000+ | 1.74% | 2.82% | 3,583 |
Organic CTRs are falling for one primary reason: Google has a clear incentive to keep people on Google rather than send them off to your site.
Our research shows this happening:
- CTR was already sliding before AI, thanks to SERP features. Featured snippets, People Also Ask boxes, knowledge panels, and local packs have spent years answering queries directly on the results page. Every one of them gives a searcher a reason not to click. AI Overviews didn’t start this trend—they accelerated a decline that’s been underway for a long time.
- AI Overviews suppress clicks by ~58%. Our updated research found that when an AI Overview is present, clicks to the top organic result fall by roughly 58% compared to the same query without one. That’s a sharp jump from the ~34.5% drop we measured in our earlier study. The effect is getting worse, not better, as AI Overviews mature.
- The most-affected queries are exactly the ones that already had low CTR. AI Overviews lean heavily toward informational and question searches (57.9% of question queries trigger one). So the answer-heavy industries at the bottom of our table aren’t just losing clicks to a clean SERP feature anymore — they’re losing them to a full AI answer.
- Clean SERPs still pay. When no AI Overview appears, organic CTR has actually held up or risen, because there’s less competition for the click on those results. The pages that suffer are the ones whose queries get an AI answer slapped on top.
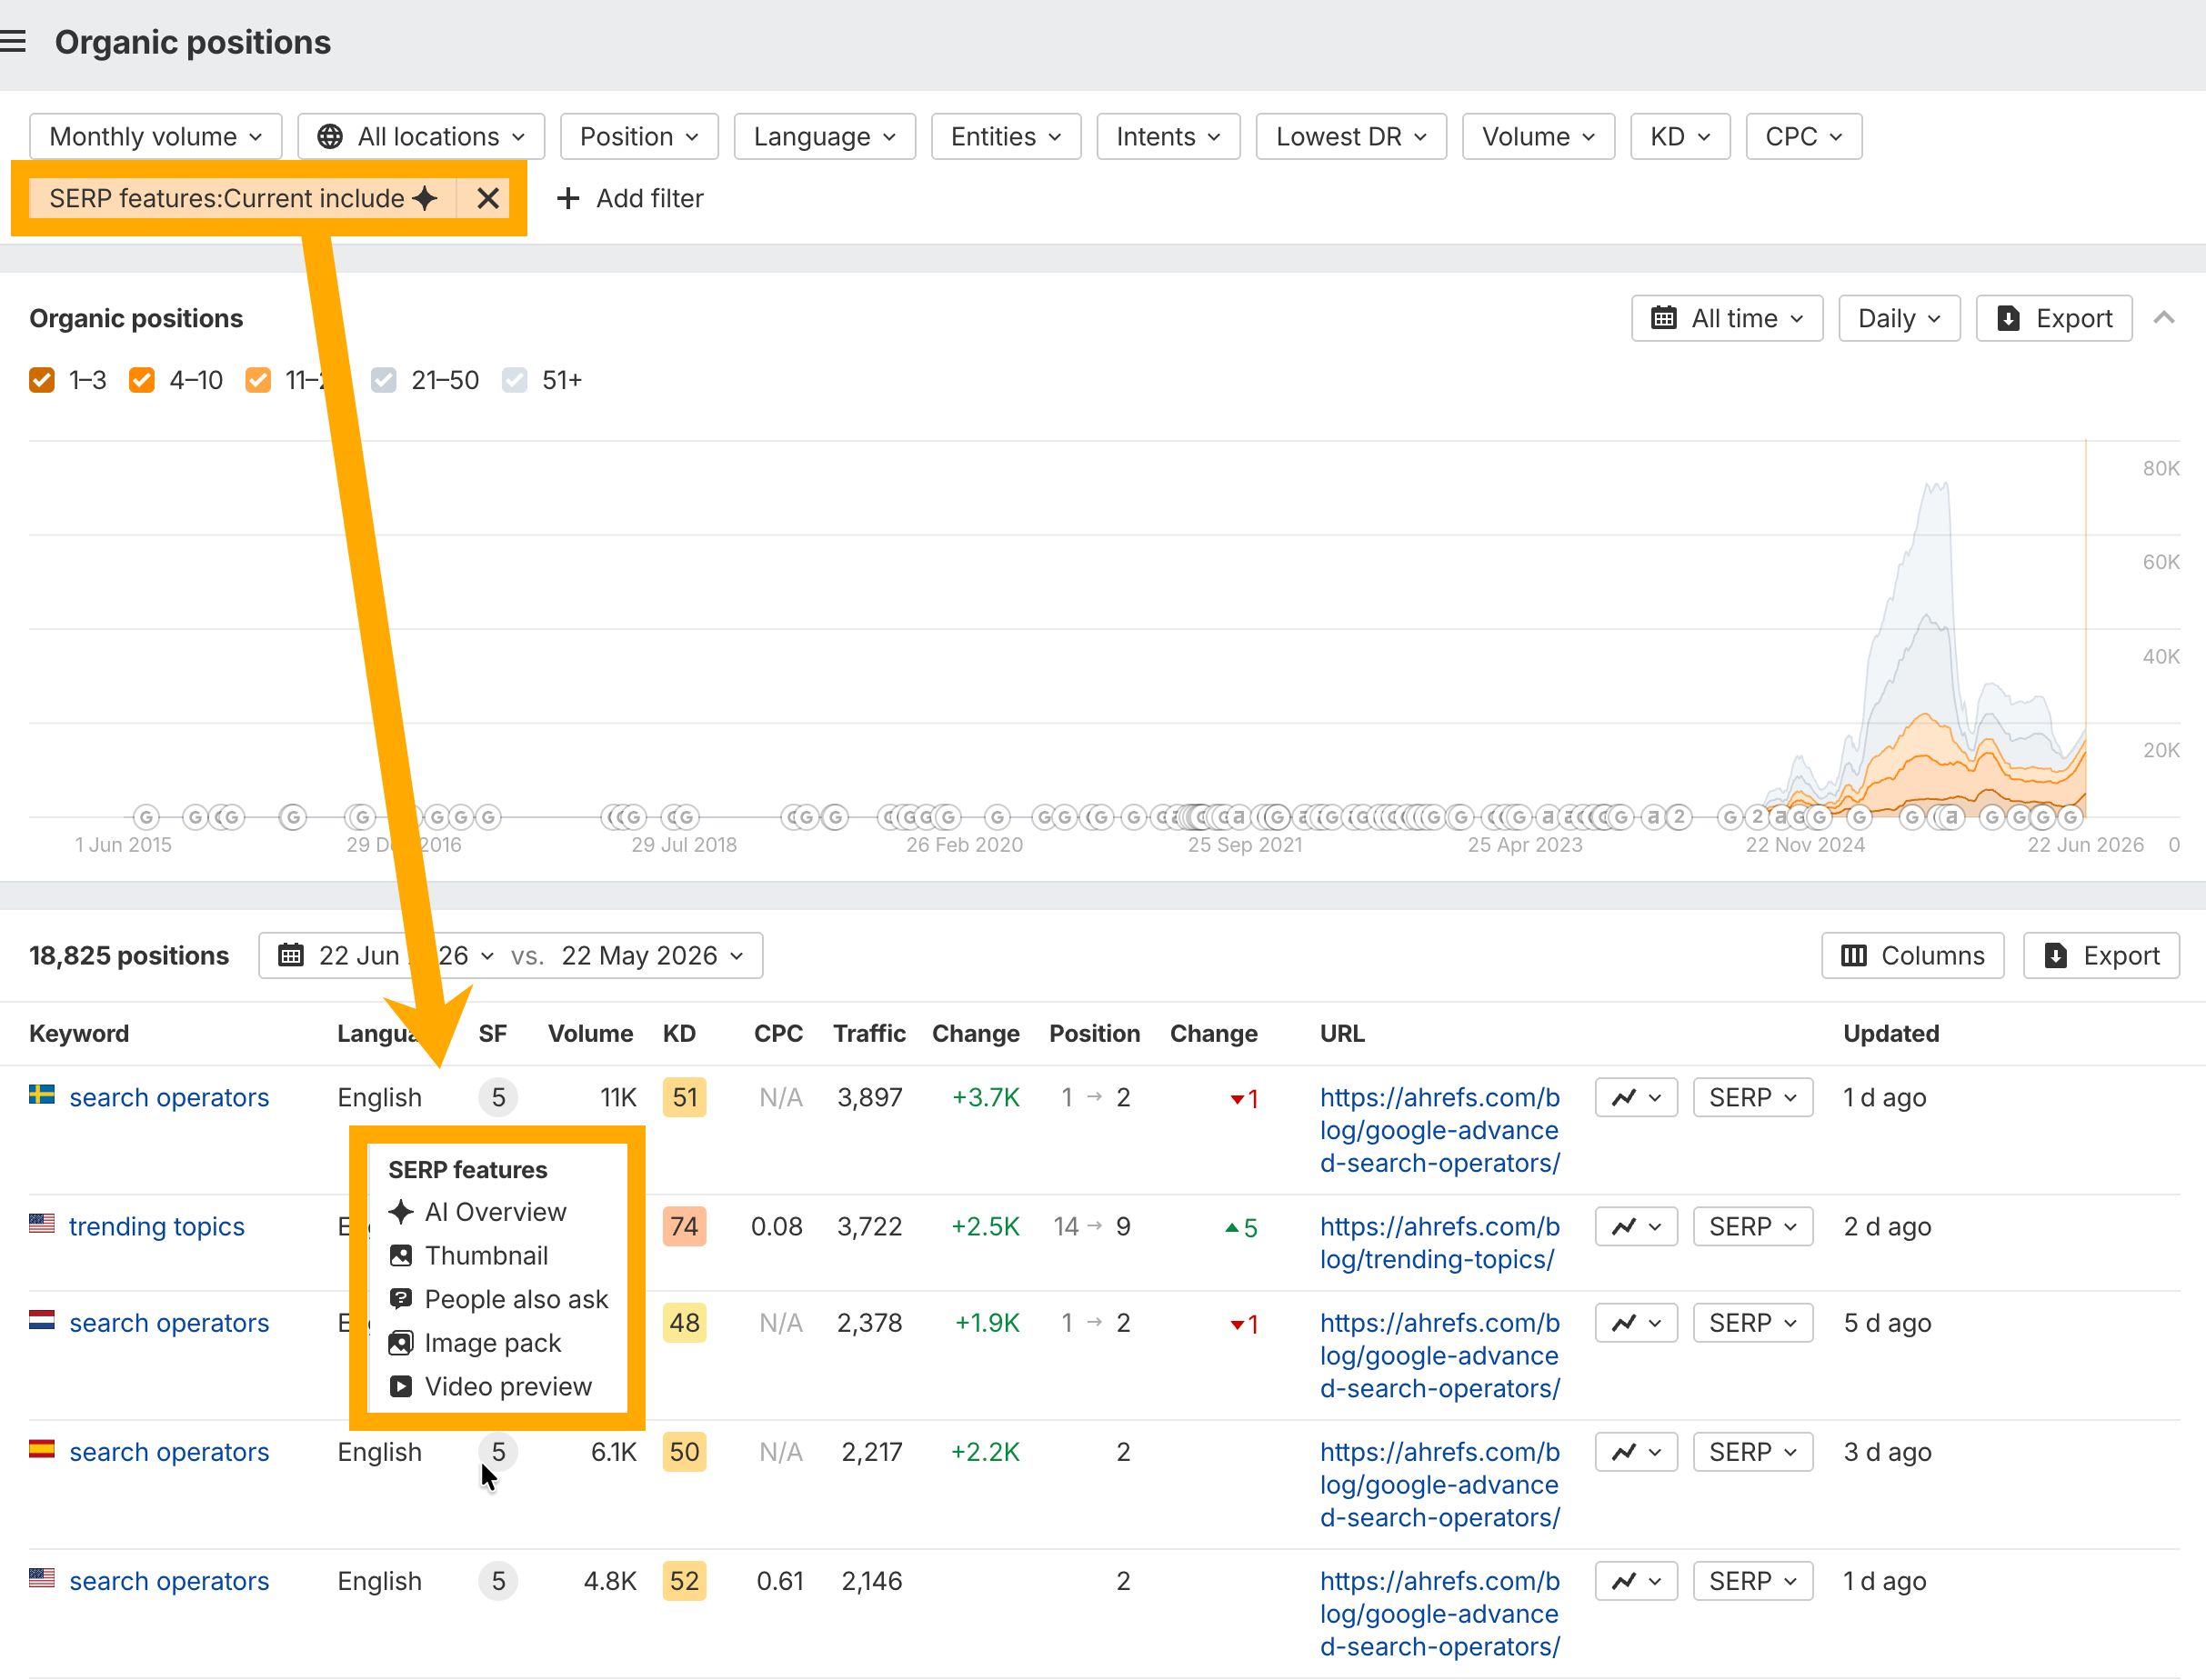
Don’t compare yourself to a position-one ideal. Compare against your industry’s median (the tables above), and watch the relationship between impressions and clicks. If impressions hold steady but CTR slips, an AI Overview is probably intercepting your query.
To confirm, head to the Organic positions report in Site Explorer and filter to keywords that show an AI Overview:
If you’re below your industry’s median, here are the levers that can actually help improve your CTR:
- Rewrite title tags to match intent. Your title is the single biggest CTR lever. Front-load the value, match the query’s intent, and make it more compelling than the results around you.
- Write meta descriptions that earn the click. Google often rewrites them, but a strong description can still win clicks when it’s used.
- Win SERP features. Featured snippets, sitelinks, and rich results take up more space and pull more attention. If you don’t own them, a competitor does.
- Add relevant structured data. Review stars, FAQs, and other schema markup can make your result visually stand out.
- Target queries AI Overviews don’t cannibalize. Commercial and navigational queries are far less likely to trigger an AIO than informational ones — and they convert better anyway.
One honest caveat: even if you nail every one of these, you can’t guarantee a big jump in clicks. That’s the nature of SEO today.
Google is increasingly siphoning clicks away and keeping people inside its own properties, so the ceiling on organic CTR is lower than it used to be, and largely outside your control.
These levers help you win the clicks that are still up for grabs, but the bigger opportunity now is to influence the sale in other ways: getting cited in AI answers, building brand recognition so people seek you out, and capturing the high-intent visitors who do click.
Optimize for CTR, but measure success by more than the click.
So, what’s a good organic CTR? For a whole website, 1–2% is the honest, typical benchmark—but the real answer is “better than your industry’s median, and trending up.” Use the tables above to find your realistic target by niche, authority, and size, then focus on the levers that move the needle.
And remember: as AI Overviews and answer engines reshape the SERP, CTR is becoming a less complete measure of SEO success on its own. The sites that win from here still earn clicks, but they also get cited as the source the answer is built from. Track both.


