![How to Do an SEO Log File Analysis [Template Included]](https://ahrefs.com/blog/wp-content/uploads/2022/04/blog_log_file_analysis-400x200.png)
They’re the most trustworthy source of information to understand the URLs that search engines have crawled, which can be critical information to help diagnose problems with technical SEO.
Google itself recognizes their importance, releasing new features in Google Search Console and making it easy to see samples of data that would previously only be available by analyzing logs.
In addition, Google Search Advocate John Mueller has publicly stated how much good information log files hold.
https://twitter.com/JohnMu/status/717455167344521217
With all this hype around the data in log files, you may want to understand logs better, how to analyze them, and whether the sites you’re working on will benefit from them.
This article will answer all of that and more. Here’s what we’ll be discussing:
- What is a server log file?
- How log files benefit SEO
- How to access your log files
- How to analyze your log files
A server log file is a file created and updated by a server that records the activities it has performed. A popular server log file is an access log file, which holds a history of HTTP requests to the server (by both users and bots).
When a non-developer mentions a log file, access logs are the ones they’ll usually be referring to.
Developers, however, find themselves spending more time looking at error logs, which report issues encountered by the server.
The above is important: If you request logs from a developer, the first thing they’ll ask is, “Which ones?”
Therefore, always be specific with log file requests. If you want logs to analyze crawling, ask for access logs.
Access log files contain lots of information about each request made to the server, such as the following:
- IP addresses
- User agents
- URL path
- Timestamps (when the bot/browser made the request)
- Request type (GET or POST)
- HTTP status codes
What servers include in access logs varies by the server type and sometimes what developers have configured the server to store in log files. Common formats for log files include the following:
- Apache format – This is used by Nginx and Apache servers.
- W3C format – This is used by Microsoft IIS servers.
- ELB format – This is used by Amazon Elastic Load Balancing.
- Custom formats – Many servers support outputting a custom log format.
Other forms exist, but these are the main ones you’ll encounter.
Now that we’ve got a basic understanding of log files, let’s see how they benefit SEO.
Here are some key ways:
- Crawl monitoring – You can see the URLs search engines crawl and use this to spot crawler traps, look out for crawl budget wastage, or better understand how quickly content changes are picked up.
- Status code reporting – This is particularly useful for prioritizing fixing errors. Rather than knowing you’ve got a 404, you can see precisely how many times a user/search engine is visiting the 404 URL.
- Trends analysis – By monitoring crawling over time to a URL, page type/site section, or your entire site, you can spot changes and investigate potential causes.
- Orphan page discovery – You can cross-analyze data from log files and a site crawl you run yourself to discover orphan pages.
All sites will benefit from log file analysis to some degree, but the amount of benefit varies massively depending on site size.
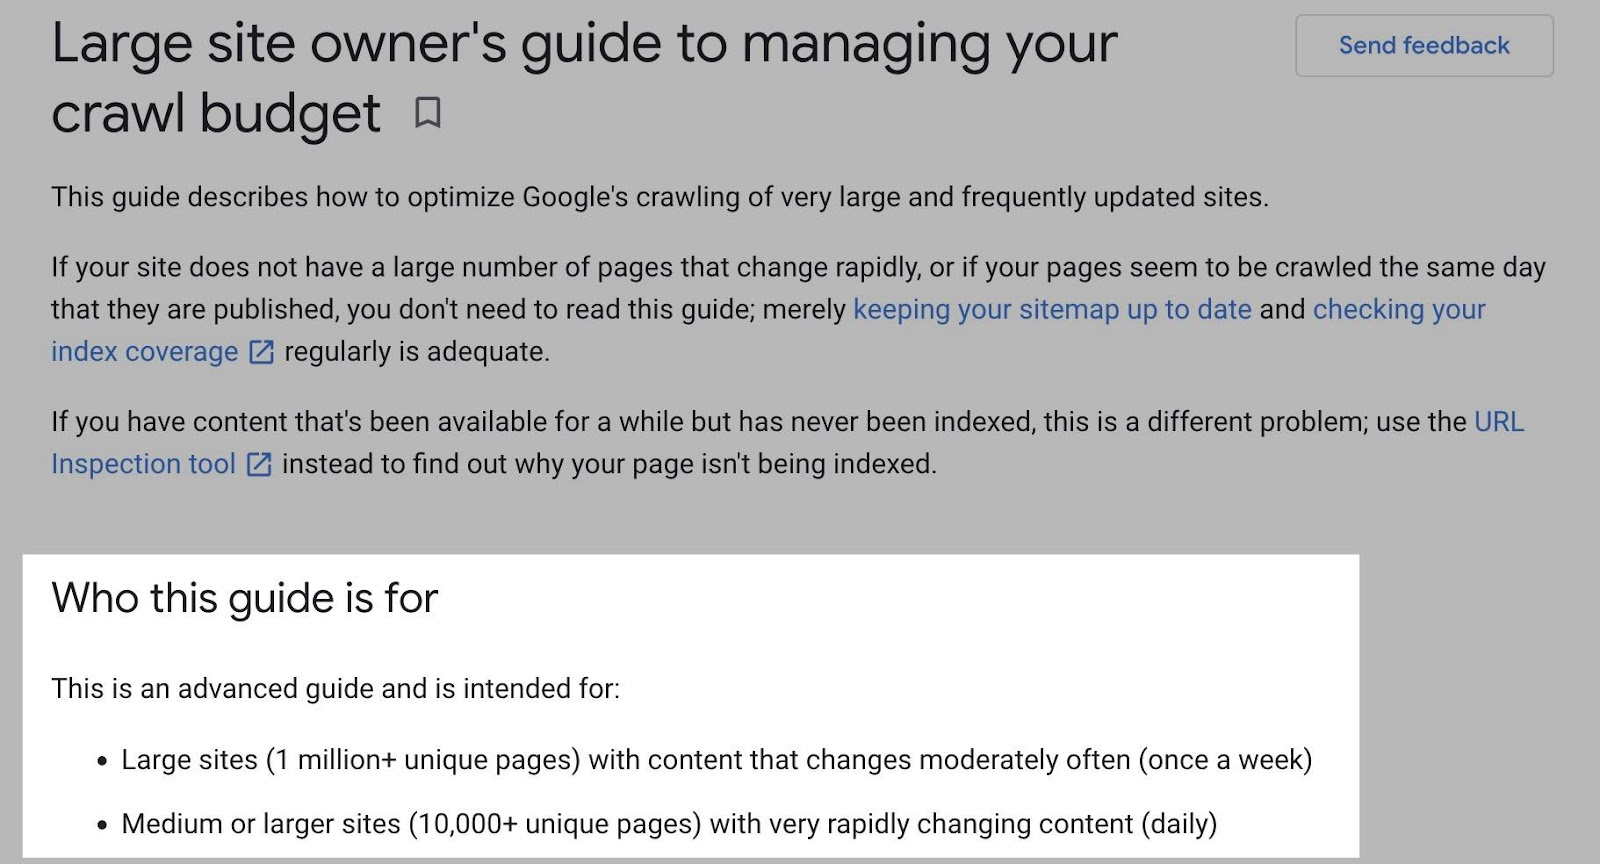
This is as log files primarily benefit sites by helping you better manage crawling. Google itself states managing the crawl budget is something larger-scale or frequently changing sites will benefit from.
The same is true for log file analysis.
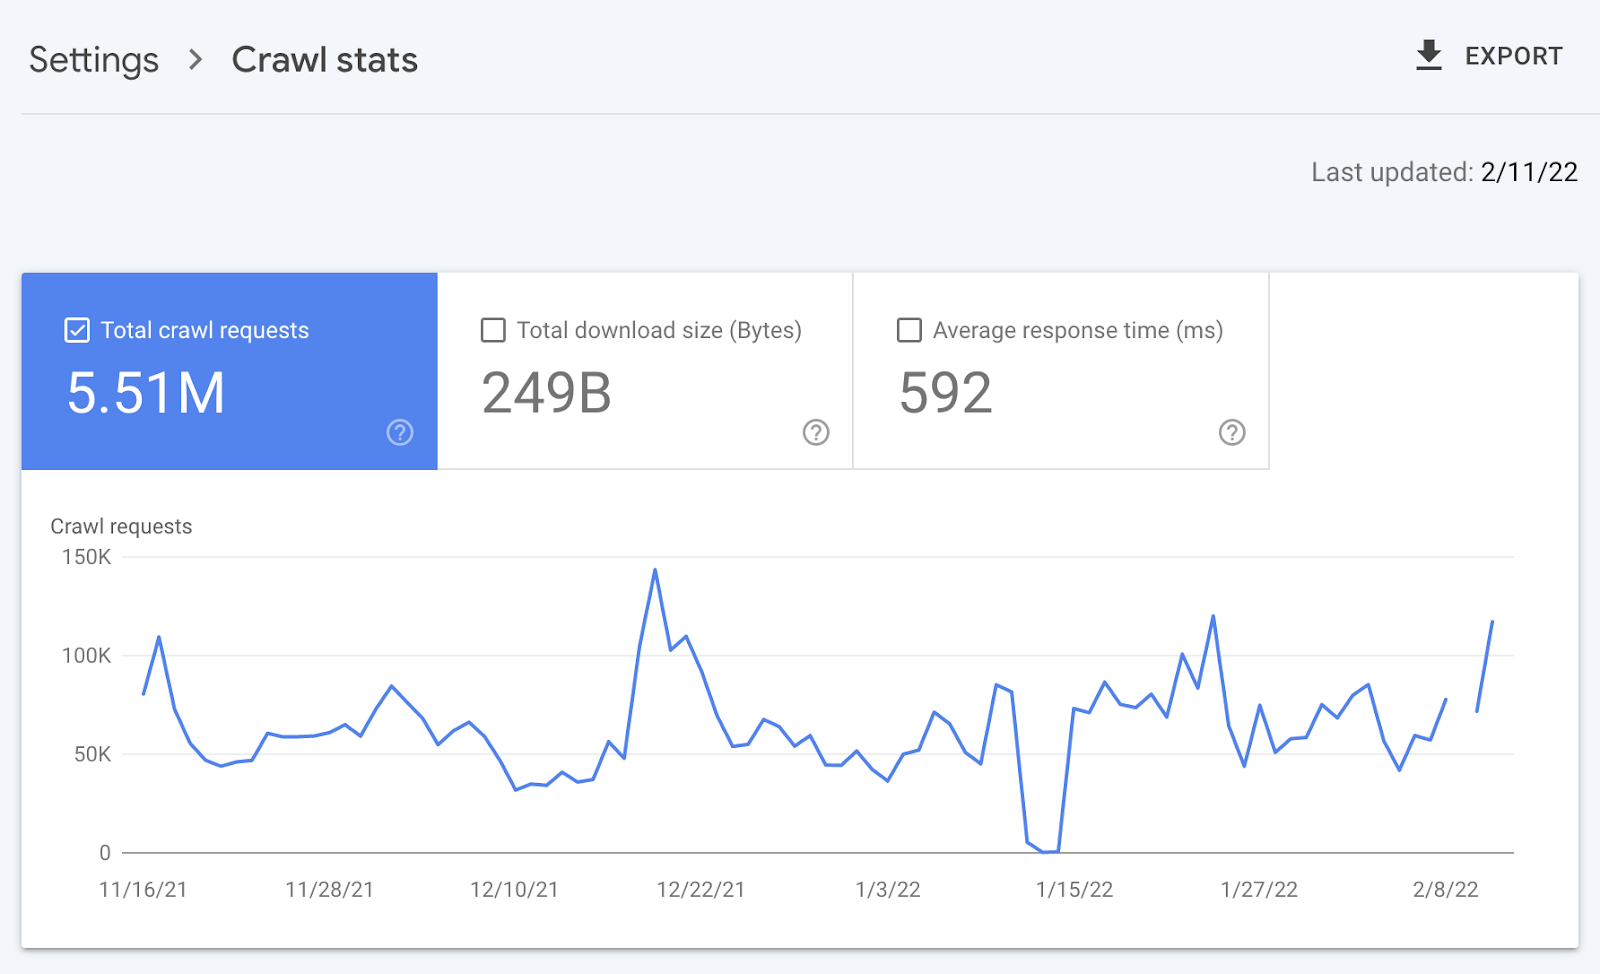
For example, smaller sites can likely use the “Crawl stats” data provided in Google Search Console and receive all of the benefits mentioned above—without ever needing to touch a log file.
Yes, Google won’t provide you with all URLs crawled (like with log files), and the trends analysis is limited to three months of data.
However, smaller sites that change infrequently also need less ongoing technical SEO. It’ll likely suffice to have a site auditor discover and diagnose issues.
For example, a cross-analysis from a site crawler, XML sitemaps, Google Analytics, and Google Search Console will likely discover all orphan pages.
You can also use a site auditor to discover error status codes from internal links.
There are a few key reasons I’m pointing this out:
- Access log files aren’t easy to get a hold of (more on this next).
- For small sites that change infrequently, the benefit of log files isn’t as much, meaning SEO focuses will likely go elsewhere.
In most cases, to analyze log files, you’ll first have to request access to log files from a developer.
The developer is then likely going to have a few issues, which they’ll bring to your attention. These include:
- Partial data – Log files can include partial data scattered across multiple servers. This usually happens when developers use various servers, such as an origin server, load balancers, and a CDN. Getting an accurate picture of all logs will likely mean compiling the access logs from all servers.
- File size – Access log files for high-traffic sites can end up in terabytes, if not petabytes, making them hard to transfer.
- Privacy/compliance – Log files include user IP addresses that are personally identifiable information (PII). User information may need removing before it can be shared with you.
- Storage history – Due to file size, developers may have configured access logs to be stored for a few days only, making them not useful for spotting trends and issues.
These issues will bring to question whether storing, merging, filtering, and transferring log files are worth the dev effort, especially if developers already have a long list of priorities (which is often the case).
Developers will likely put the onus on the SEO to explain/build a case for why developers should invest time in this, which you will need to prioritize among other SEO focuses.
These issues are precisely why log file analysis doesn’t happen frequently.
Log files you receive from developers are also often formatted in unsupported ways by popular log file analysis tools, making analysis more difficult.
Thankfully, there are software solutions that simplify this process. My favorite is Logflare, a Cloudflare app that can store log files in a BigQuery database that you own.
Now it’s time to start analyzing your logs.
I’m going to show you how to do this in the context of Logflare specifically; however, the tips on how to use log data will work with any logs.
The template I’ll share shortly also works with any logs. You’ll just need to make sure the columns in the data sheets match up.
1. Start by setting up Logflare (optional)
Logflare is simple to set up. And with the BigQuery integration, it stores data long term. You’ll own the data, making it easily accessible for everyone.
There’s one difficulty. You need to swap out your domain name servers to use Cloudflare ones and manage your DNS there.
For most, this is fine. However, if you’re working with a more enterprise-level site, it’s unlikely you can convince the server infrastructure team to change the name servers to simplify log analysis.
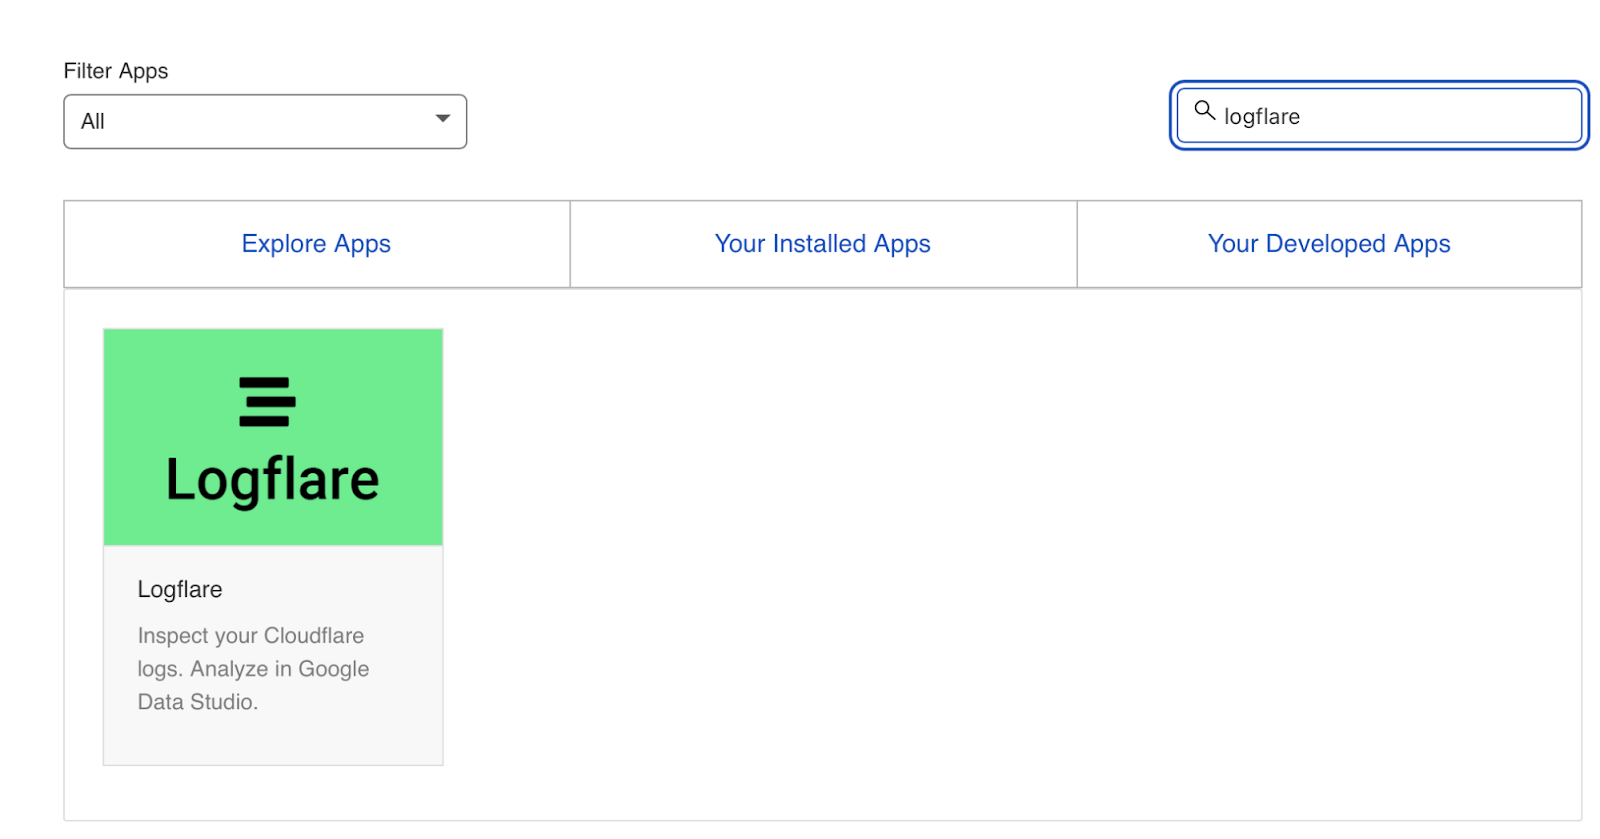
I won’t go through every step on how to get Logflare working. But to get started, all you need to do is head to the Cloudflare Apps part of your dashboard.
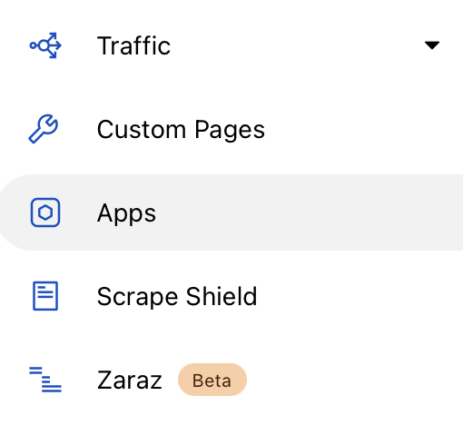
And then search for Logflare.
The setup past this point is self-explanatory (create an account, give your project a name, choose the data to send, etc.). The only extra part I recommend following is Logflare’s guide to setting up BigQuery.
Bear in mind, however, that BigQuery does have a cost that’s based on the queries you do and the amount of data you store.
2. Verify Googlebot
We’ve now stored log files (via Logflare or an alternative method). Next, we need to extract logs precisely from the user agents we want to analyze. For most, this will be Googlebot.
Before we do that, we have another hurdle to jump across.
Many bots pretend to be Googlebot to get past firewalls (if you have one). In addition, some auditing tools do the same to get an accurate reflection of the content your site returns for the user agent, which is essential if your server returns different HTML for Googlebot, e.g., if you’ve set up dynamic rendering.
I’m not using Logflare
If you aren’t using Logflare, identifying Googlebot will require a reverse DNS lookup to verify the request did come from Google.
Google has a handy guide on validating Googlebot manually here.
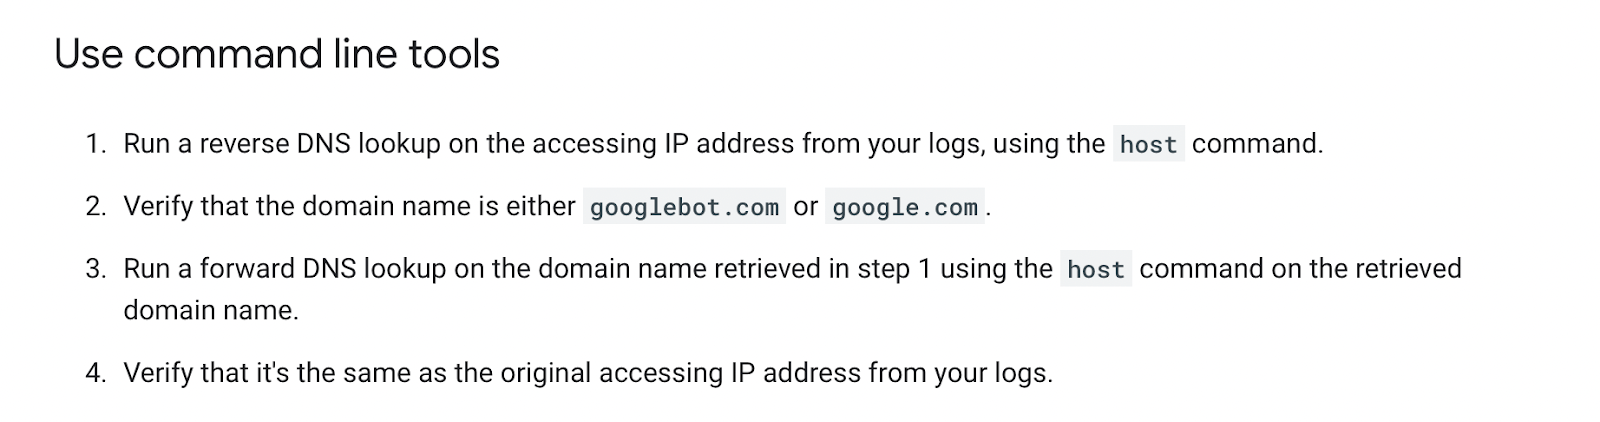
You can do this on a one-off basis, using a reverse IP lookup tool and checking the domain name returned.
However, we need to do this in bulk for all rows in our log files. This also requires you to match IP addresses from a list provided by Google.
The easiest way to do this is by using server firewall rule sets maintained by third parties that block fake bots (resulting in fewer/no fake Googlebots in your log files). A popular one for Nginx is “Nginx Ultimate Bad Bot Blocker.”
Alternatively, something you’ll note on the list of Googlebot IPs is the IPV4 addresses all begin with “66.”
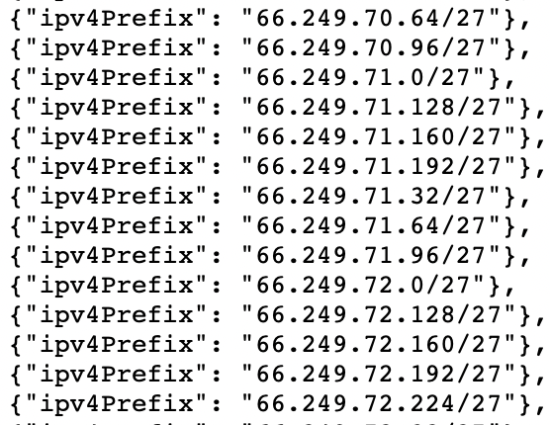
While it won’t be 100% accurate, you can also check for Googlebot by filtering for IP addresses starting with “6” when analyzing the data within your logs.
I’m using Cloudflare/Logflare
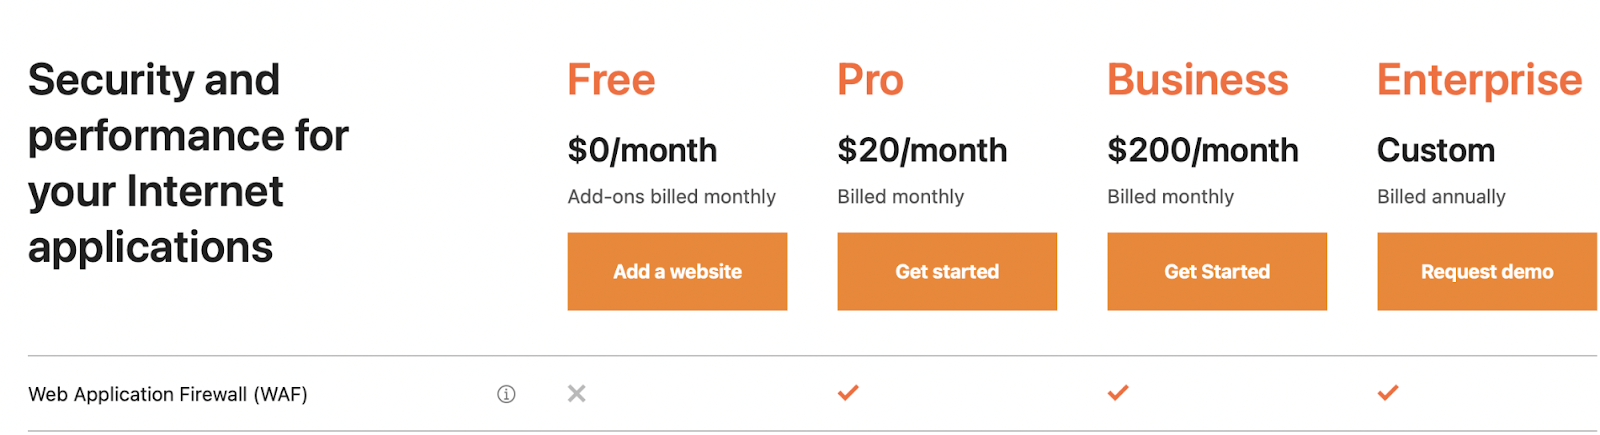
Cloudflare’s pro plan (currently $20/month) has built-in firewall features that can block fake Googlebot requests from accessing your site.
Cloudflare disables these features by default, but you can find them by heading to Firewall > Managed Rules > enabling “Cloudflare Specials” > select “Advanced”:
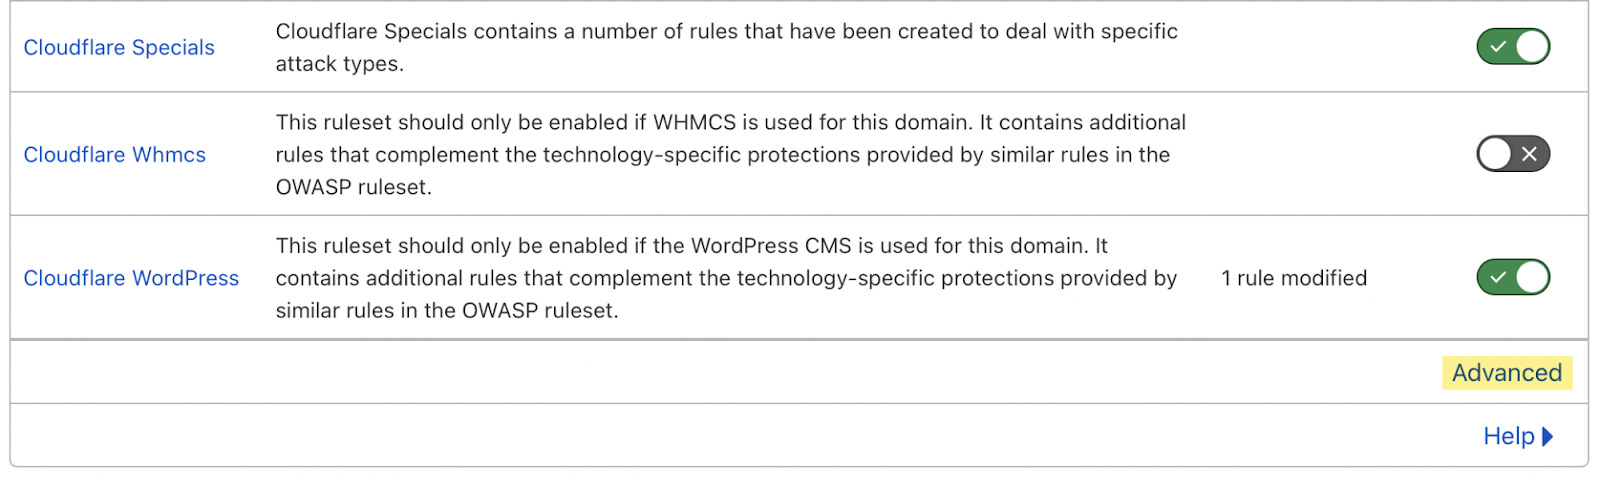
Next, change the search type from “Description” to “ID” and search for “100035.”
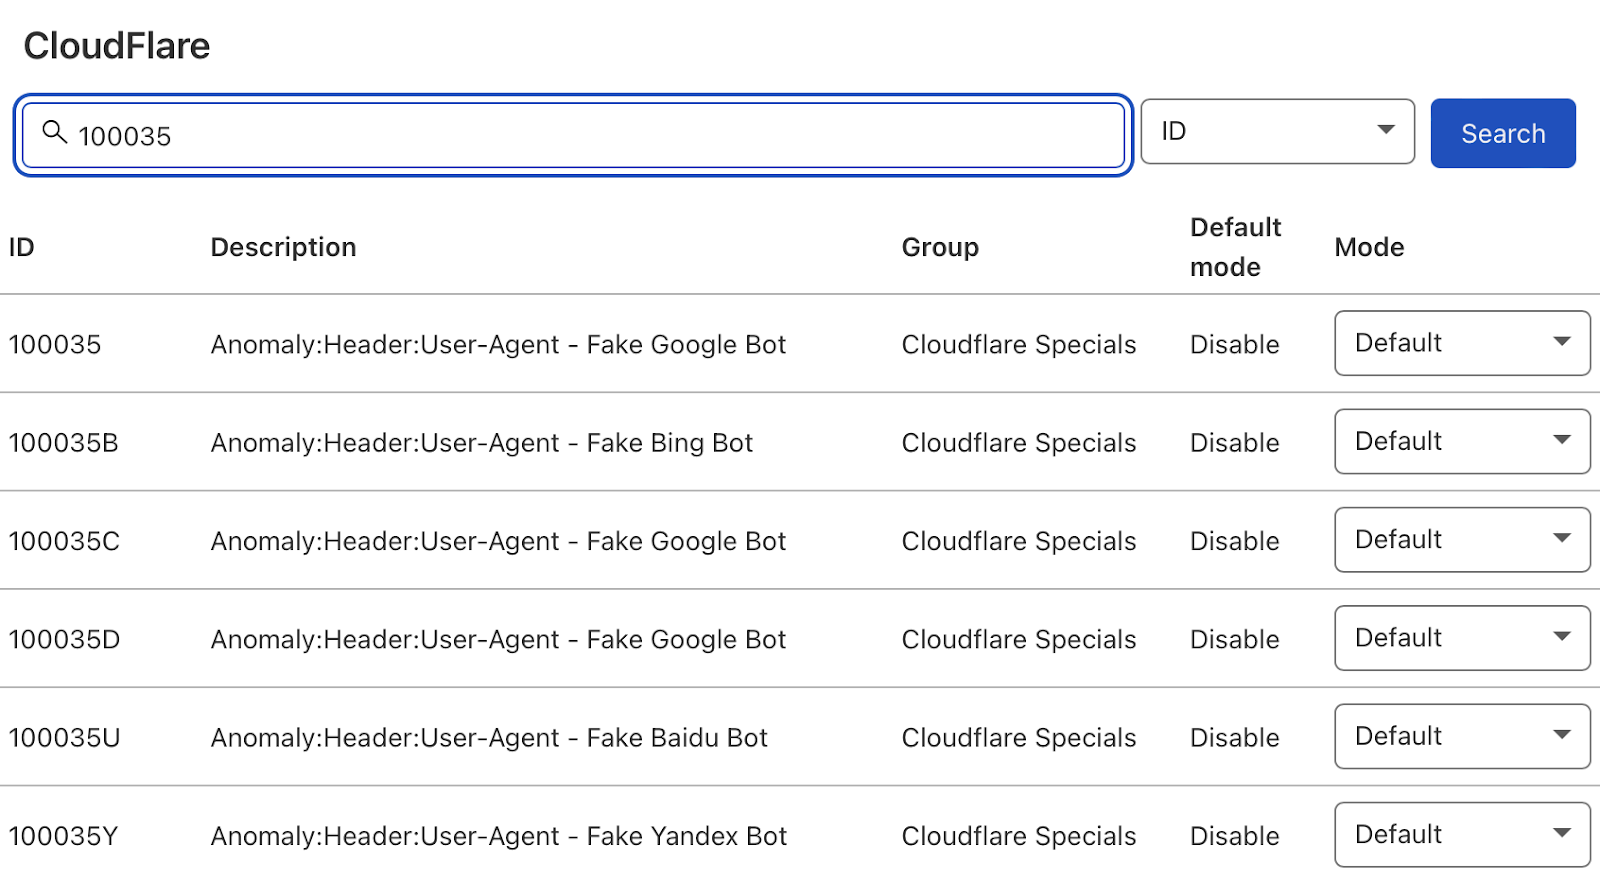
Cloudflare will now present you with a list of options to block fake search bots. Set the relevant ones to “Block,” and Cloudflare will check all requests from search bot user agents are legitimate, keeping your log files clean.
3. Extract data from log files
Finally, we now have access to log files, and we know the log files accurately reflect genuine Googlebot requests.
I recommend analyzing your log files within Google Sheets/Excel to start with because you’ll likely be used to spreadsheets, and it’s simple to cross-analyze log files with other sources like a site crawl.
There is no one right way to do this. You can use the following:
You can also do this within a Data Studio report. I find Data Studio helpful for monitoring data over time, and Google Sheets/Excel is better for a one-off analysis when technical auditing.
Open BigQuery and head to your project/dataset.
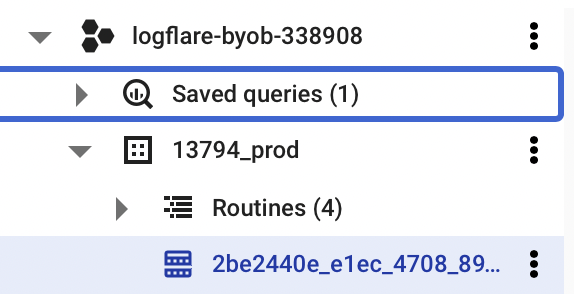
Select the “Query” dropdown and open it in a new tab.
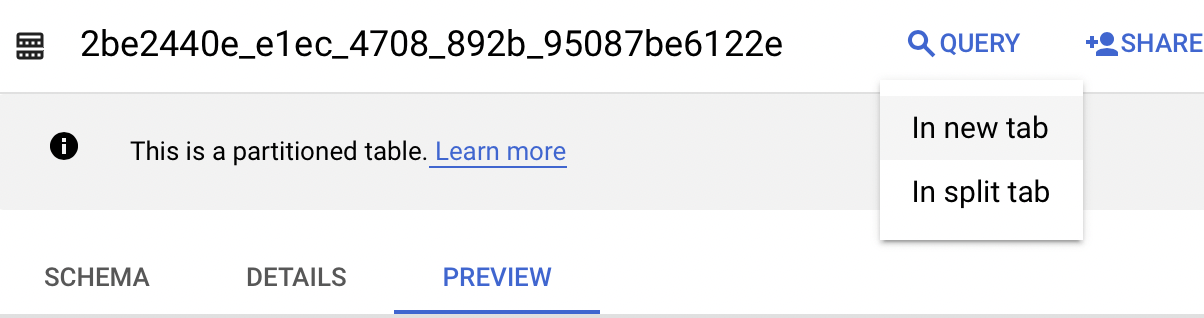
Next, you’ll need to write some SQL to extract the data you’ll be analyzing. To make this easier, first copy the contents of the FROM part of the query.
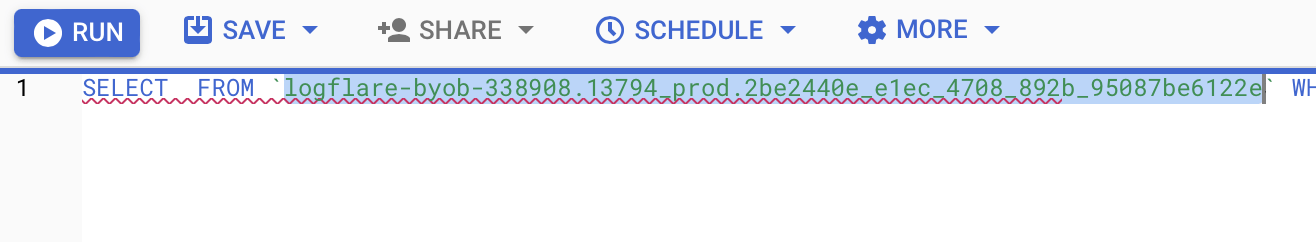
And then you can add that within the query I’ve written for you below:
SELECT DATE(timestamp) AS Date, req.url AS URL, req_headers.cf_connecting_ip AS IP, req_headers.user_agent AS User_Agent, resp.status_code AS Status_Code, resp.origin_time AS Origin_Time, resp_headers.cf_cache_status AS Cache_Status, resp_headers.content_type AS Content_Type
FROM `[Add Your from address here]`,
UNNEST(metadata) m,
UNNEST(m.request) req,
UNNEST(req.headers) req_headers,
UNNEST(m.response) resp,
UNNEST(resp.headers) resp_headers
WHERE DATE(timestamp) >= "2022-01-03" AND (req_headers.user_agent LIKE '%Googlebot%' OR req_headers.user_agent LIKE '%bingbot%')
ORDER BY timestamp DESC
This query selects all the columns of data that are useful for log file analysis for SEO purposes. It also only pulls data for Googlebot and Bingbot.
Select “Run” at the top. Then choose to save the results.
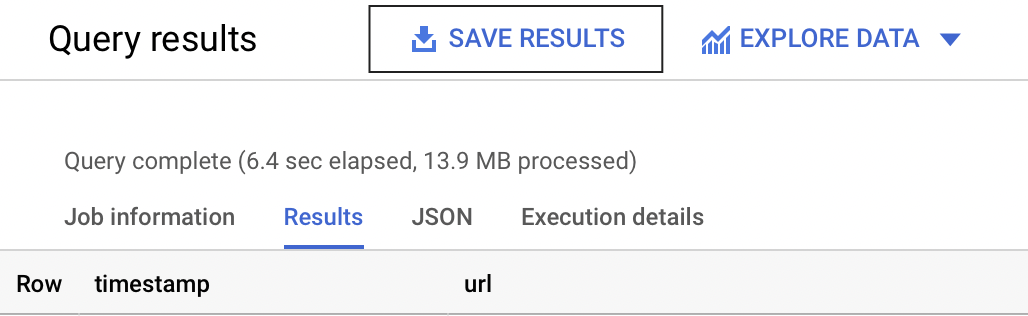
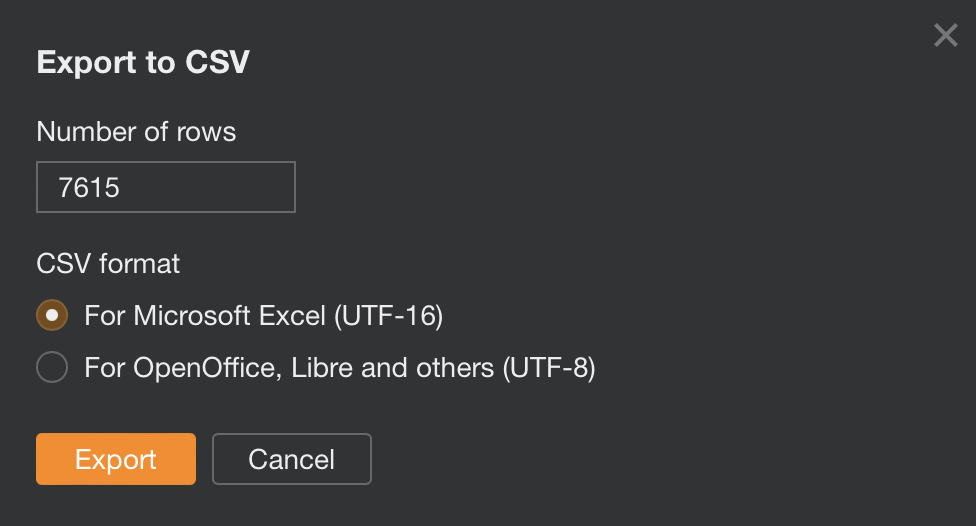
Next, save the data to a CSV in Google Drive (this is the best option due to the larger file size).
And then, once BigQuery has run the job and saved the file, open the file with Google Sheets.
4. Add to Google Sheets
We’re now going to start with some analysis. I recommend using my Google Sheets template. But I’ll explain what I’m doing, and you can build the report yourself if you want.
The template consists of two data tabs to copy and paste your data into, which I then use for all other tabs using the Google Sheets QUERY function.
To start with, copy and paste the output of your export from BigQuery into the “Data - Log files” tab.
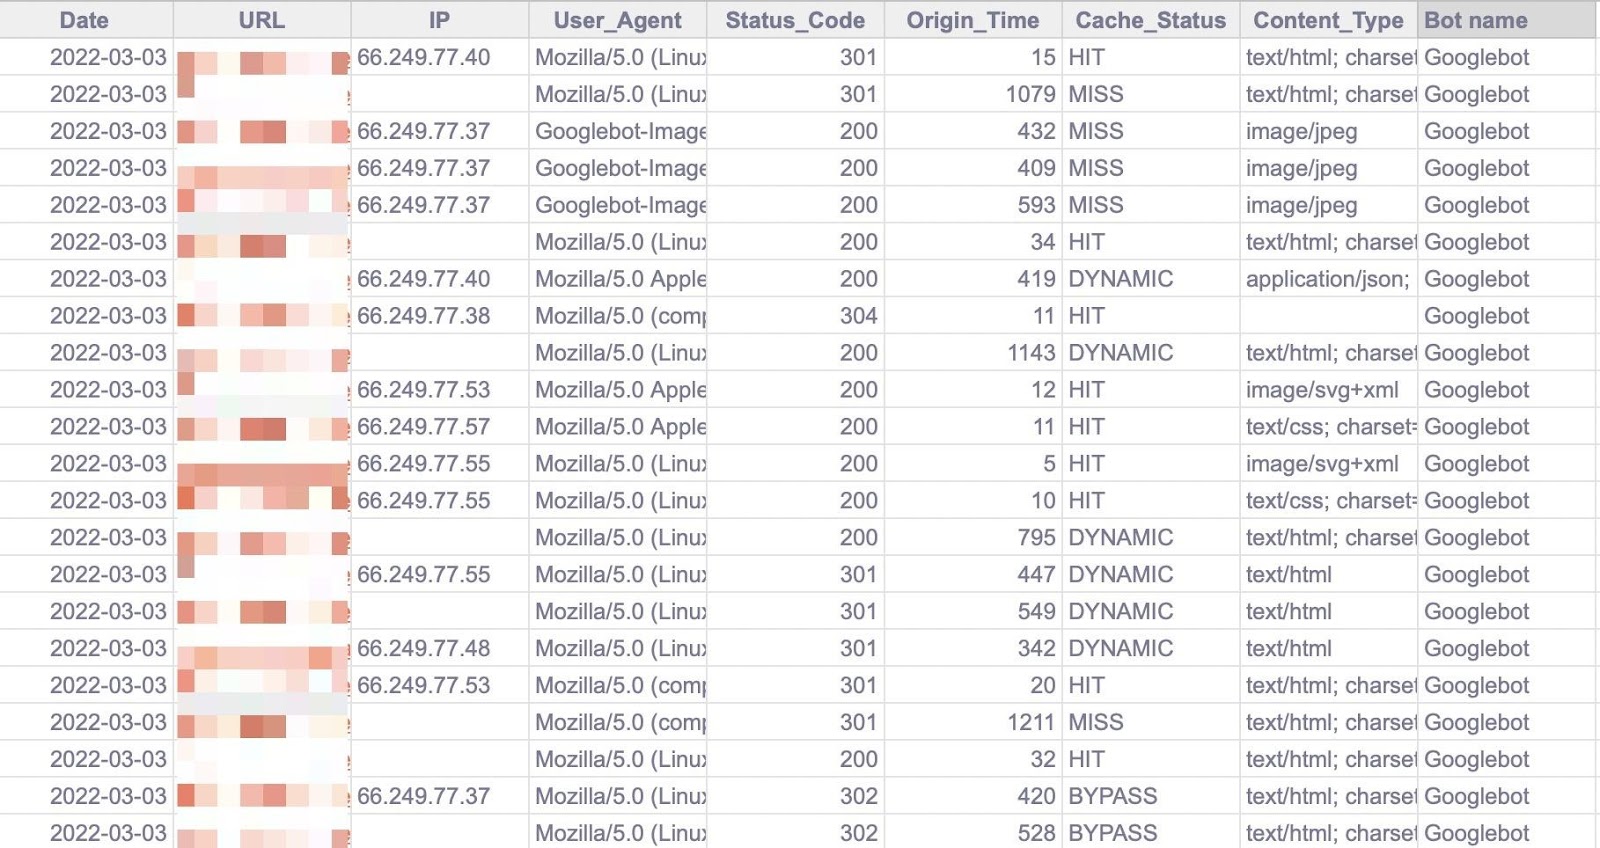
Note that there are multiple columns added to the end of the sheet (in darker grey) to make analysis a little easier (like the bot name and first URL directory).
5. Add Ahrefs data
If you have a site auditor, I recommend adding more data to the Google Sheet. Mainly, you should add these:
- Organic traffic
- Status codes
- Crawl depth
- Indexability
- Number of internal links
To get this data out of Ahrefs’ Site Audit, head to Page Explorer and select “Manage Columns.”
I then recommend adding the columns shown below:
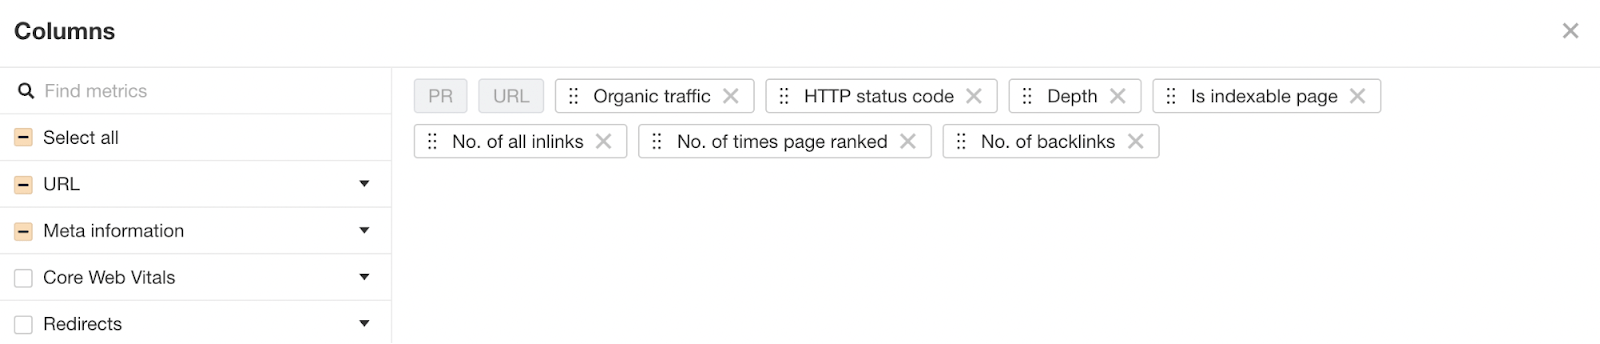
Then export all of that data.
And copy and paste into the “Data - Ahrefs” sheet.
6. Check for status codes
The first thing we’ll analyze is status codes. This data will answer whether search bots are wasting crawl budget on non-200 URLs.
Note that this doesn’t always point toward an issue.
Sometimes, Google can crawl old 301s for many years. However, it can highlight an issue if you’re internally linking to many non-200 status codes.
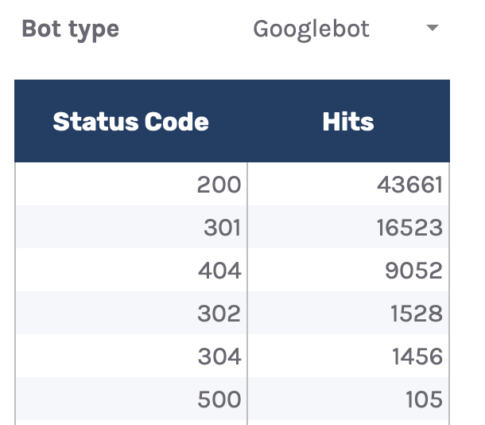
The “Status Codes - Overview” tab has a QUERY function that summarizes the log file data and displays the results in a chart.
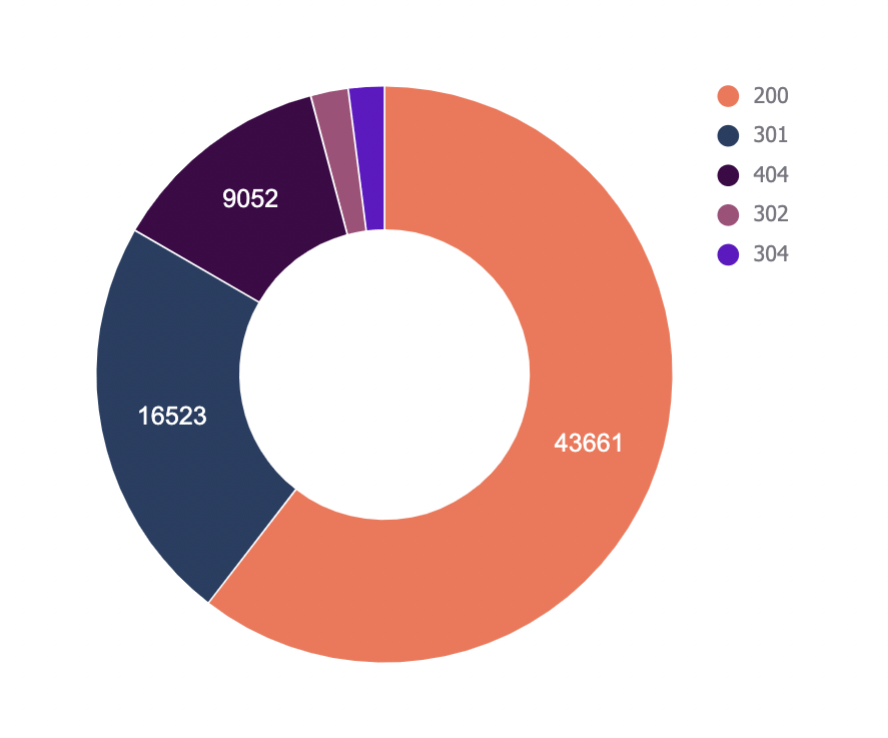
There is also a dropdown to filter by bot type and see which ones are hitting non-200 status codes the most.
Of course, this report alone doesn’t help us solve the issue, so I’ve added another tab, “URLs - Overview.”
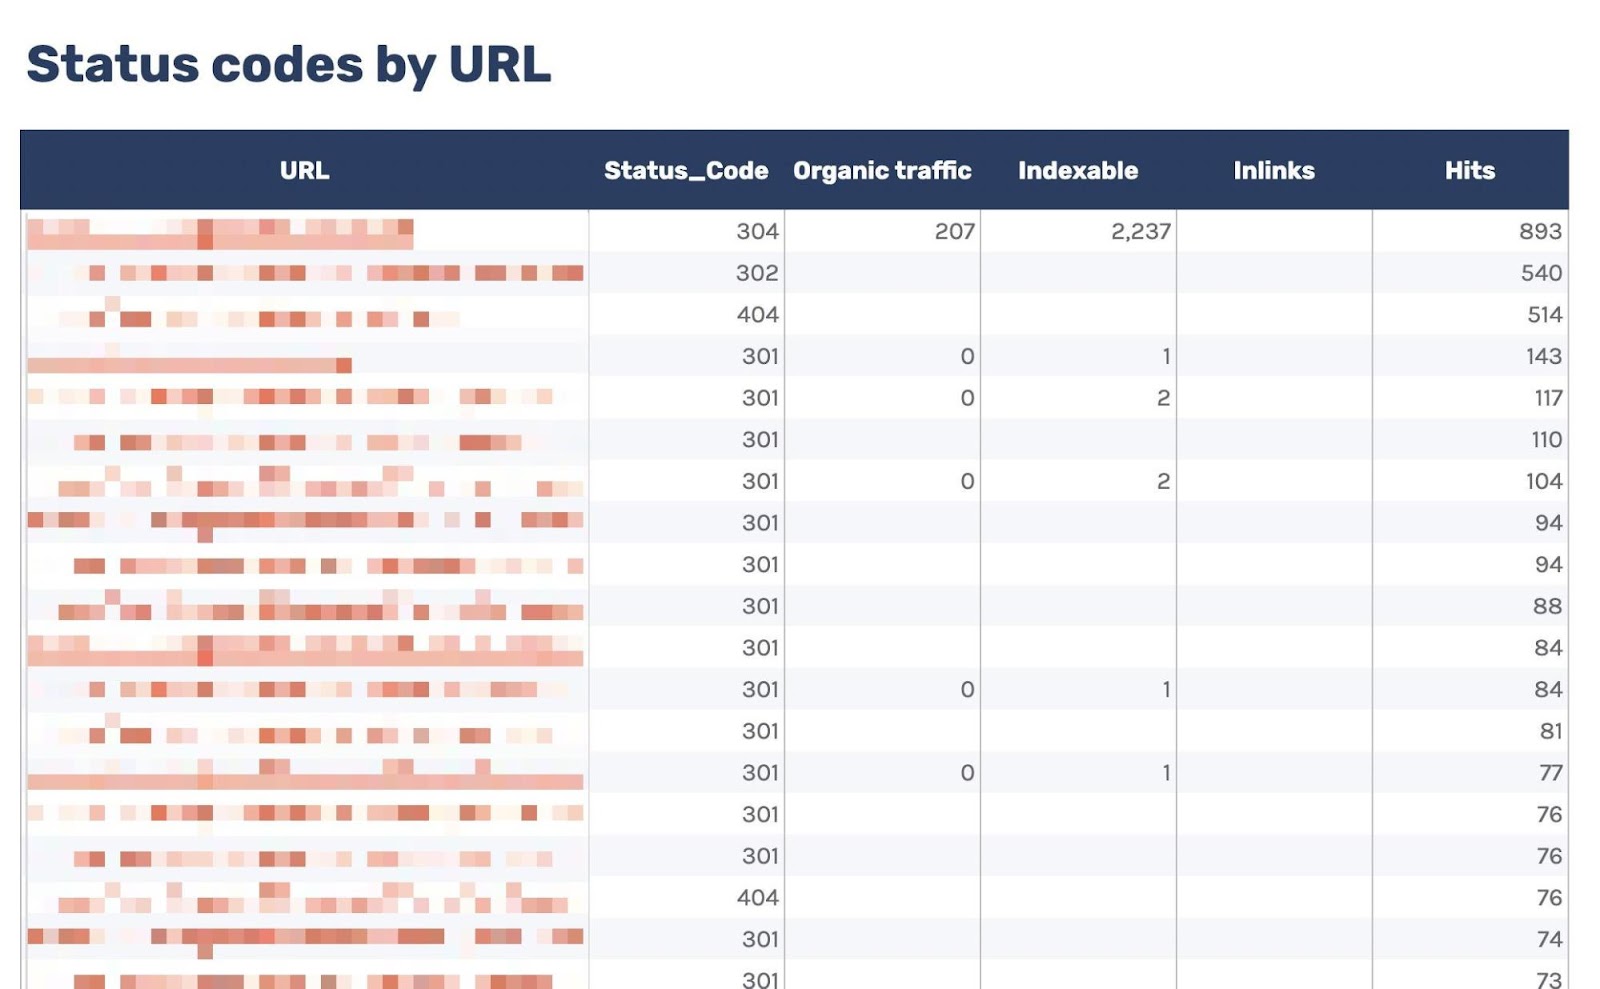
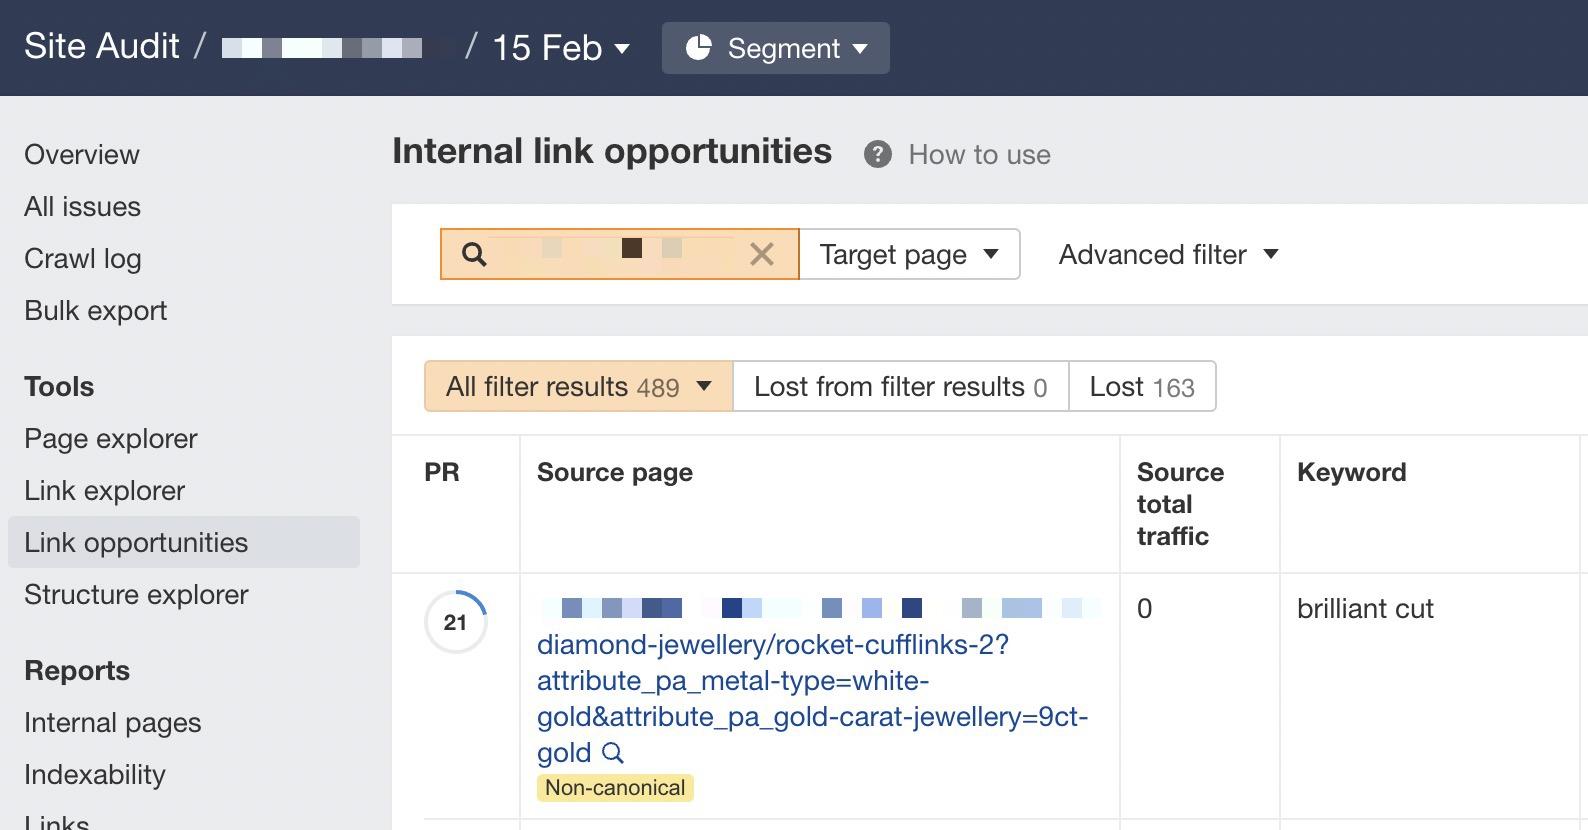
You can use this to filter for URLs that return non-200 status codes. As I’ve also included data from Ahrefs’ Site Audit, you can see whether you’re internally linking to any of those non-200 URLs in the “Inlinks” column.
If you see a lot of internal links to the URL, you can then use the Internal link opportunities report to spot these incorrect internal links by simply copying and pasting the URL in the search bar with “Target page” selected.
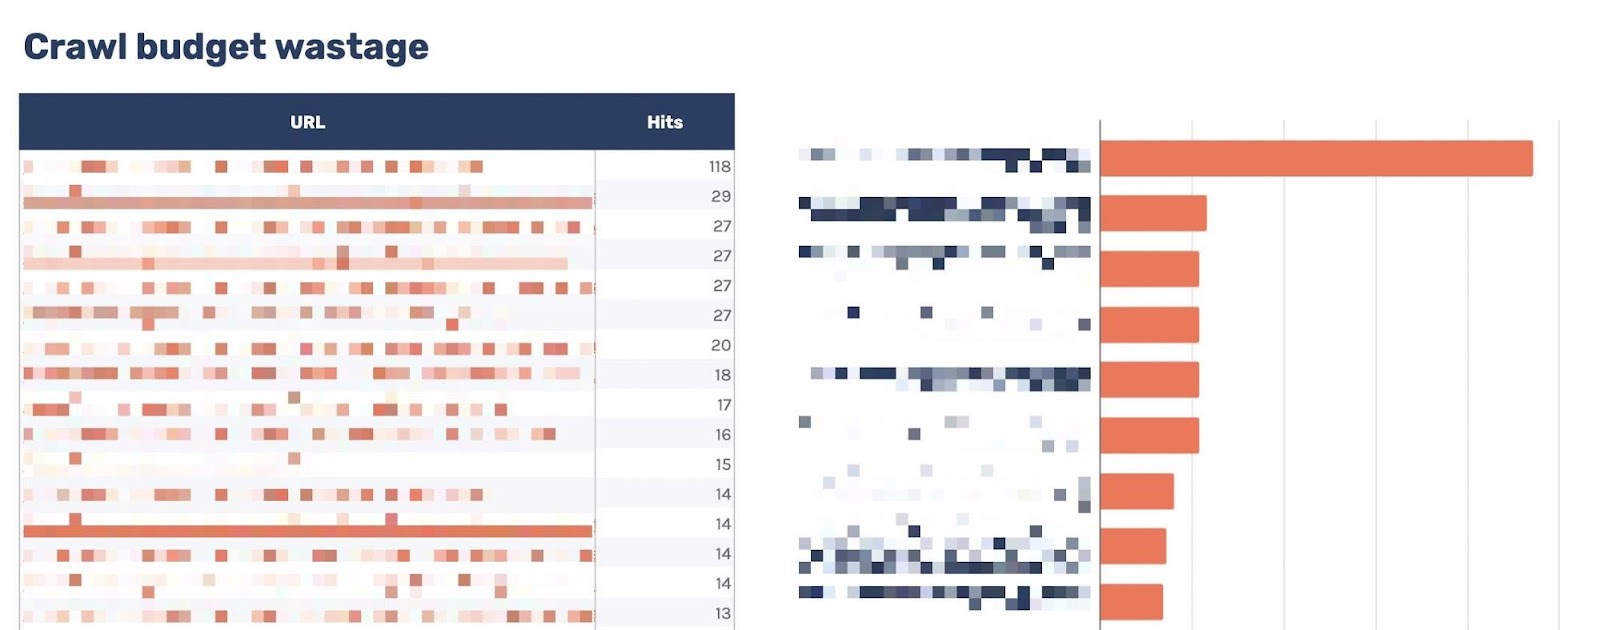
7. Detect crawl budget wastage
The best way to highlight crawl budget wastage from log files that isn’t due to crawling non-200 status codes is to find frequently crawled non-indexable URLs (e.g., they’re canonicalized or noindexed).
Since we’ve added data from our log files and Ahrefs’ Site Audit, spotting these URLs is straightforward.
Head to the “Crawl budget wastage” tab, and you’ll find highly crawled HTML files that return a 200 but are non-indexable.
Now that you have this data, you’ll want to investigate why the bot is crawling the URL. Here are some common reasons:
- It’s internally linked to.
- It’s incorrectly included in XML sitemaps.
- It has links from external sites.
It’s common for larger sites, especially those with faceted navigation, to link to many non-indexable URLs internally.
If the hit numbers in this report are very high and you believe you’re wasting your crawl budget, you’ll likely need to remove internal links to the URLs or block crawling with the robots.txt.
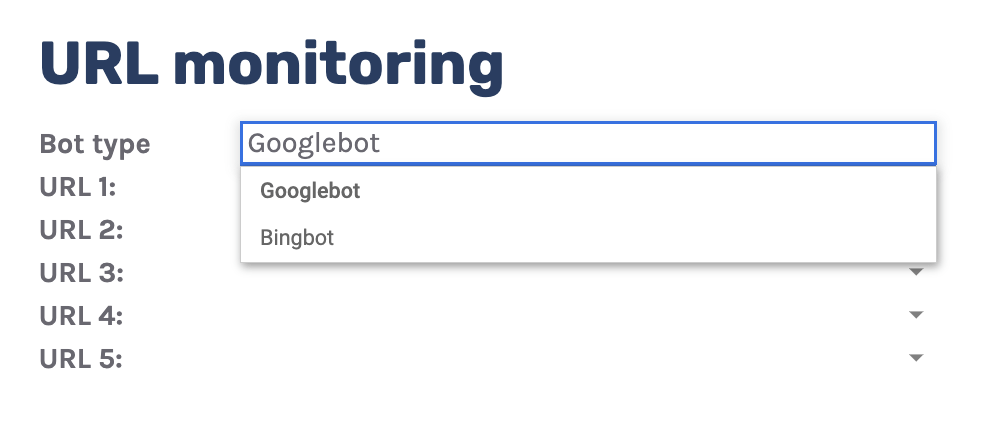
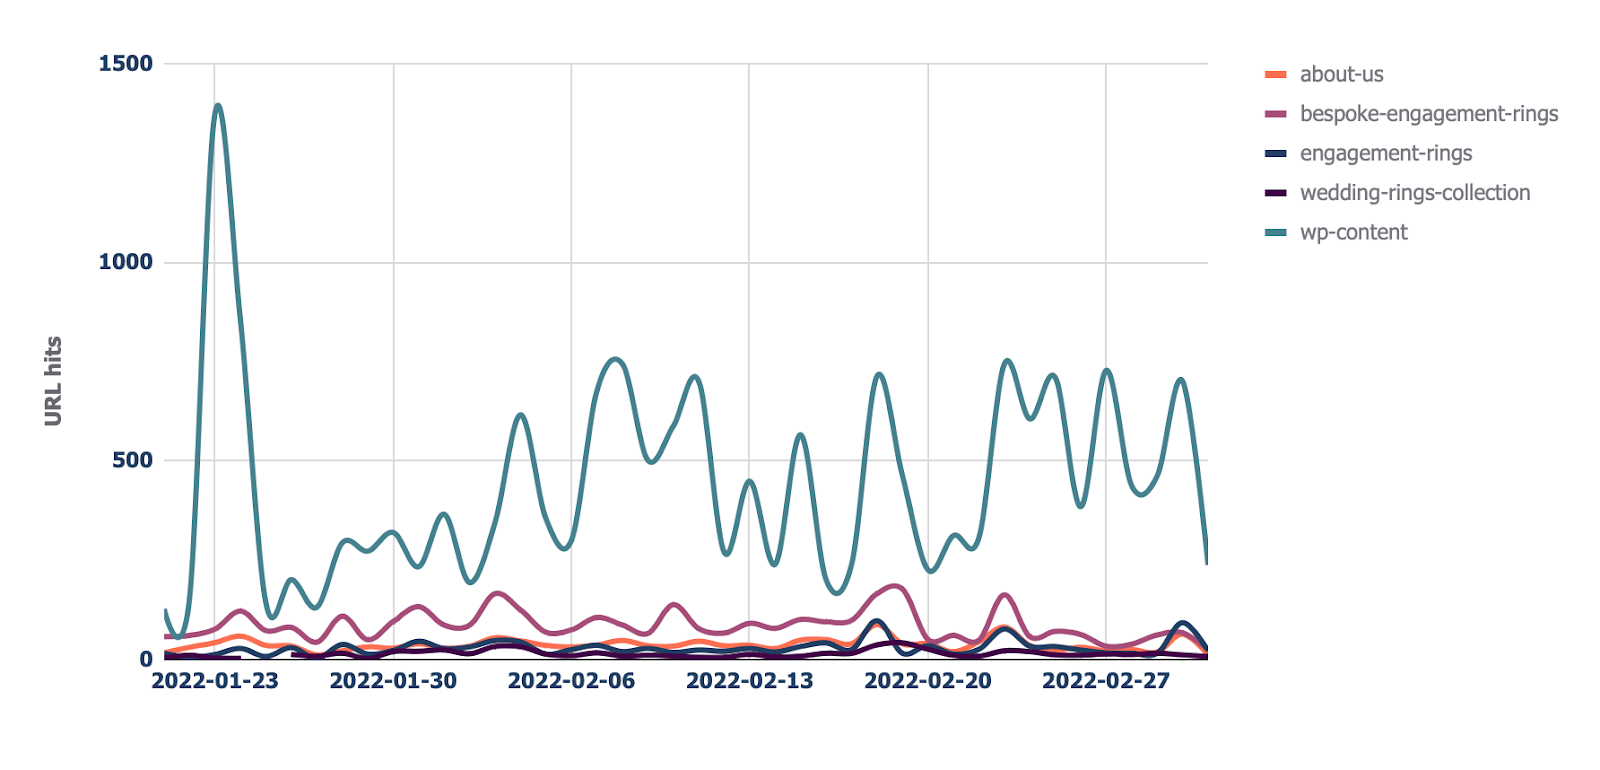
8. Monitor important URLs
If you have specific URLs on your site that are incredibly important to you, you may want to watch how often search engines crawl them.
The “URL monitor” tab does just that, plotting the daily trend of hits for up to five URLs that you can add.
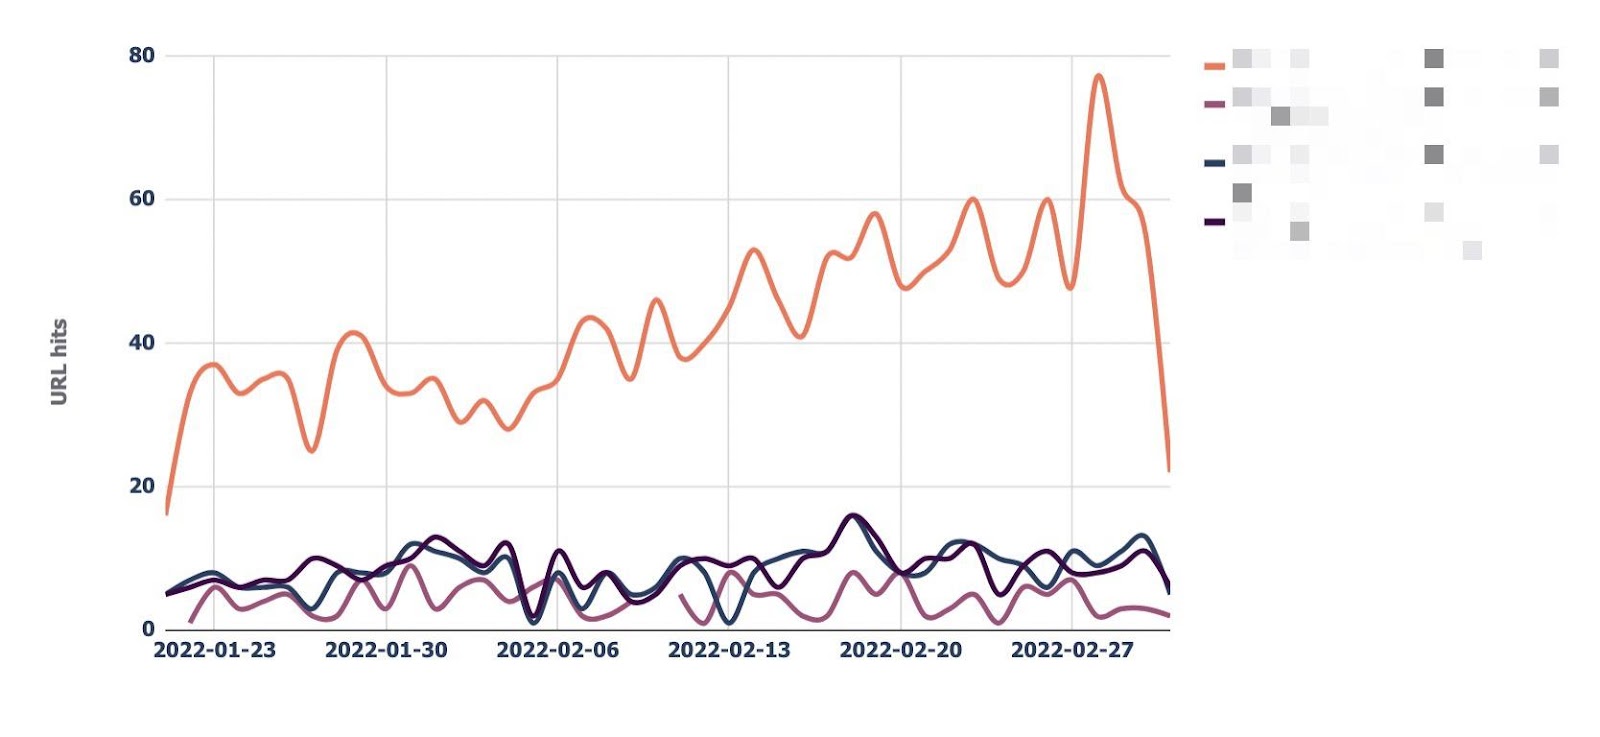
You can also filter by bot type, making it easy to monitor how often Bing or Google crawls a URL.
Often, the advice here is that it’s a bad thing if Google doesn’t crawl a URL frequently. That simply isn’t the case.
While Google tends to crawl popular URLs more frequently, it will likely crawl a URL less if it doesn’t change often.
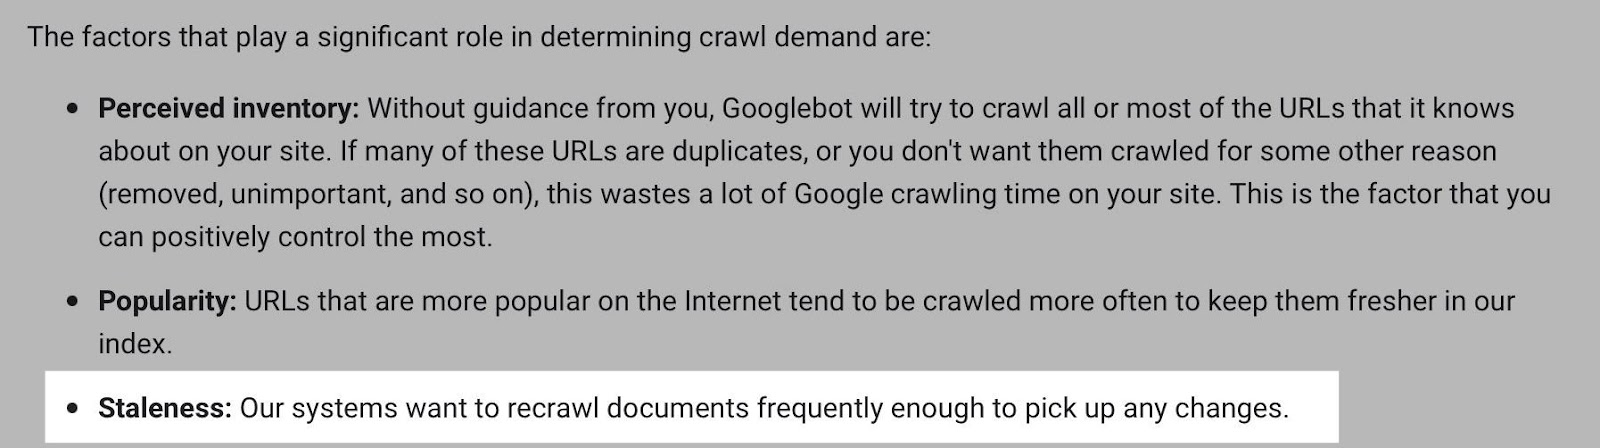
Still, it’s helpful to monitor URLs like this if you need content changes picked up quickly, such as on a news site’s homepage.
In fact, if you notice Google is recrawling a URL too frequently, I’ll advocate for trying to help it better manage crawl rate by doing things like adding <lastmod> to XML sitemaps. Here’s what it looks like:
<?xml version="1.0" encoding="UTF-8"?>
<urlset xmlns="http://www.sitemaps.org/schemas/sitemap/0.9">
<url>
<loc>https://www.logexample.com/example</loc>
<lastmod>2022-10-04</lastmod>
</url>
</urlset>
You can then update the <lastmod> attribute whenever the content of the page changes, signaling Google to recrawl.
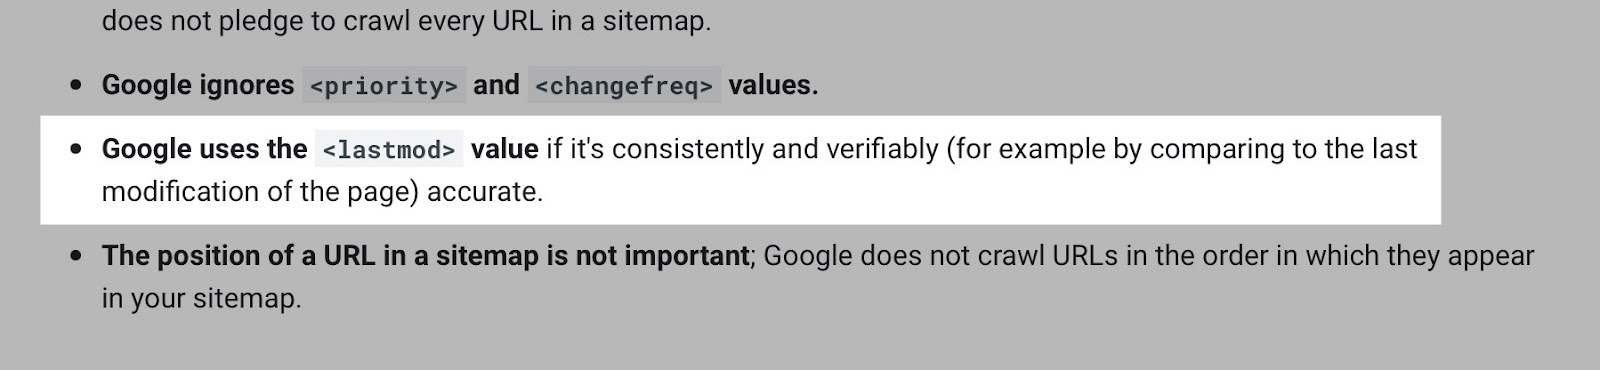
Be aware Google has provided mixed feedback on this attribute. In 2015, Gary Ilysses stated it’s mostly ignored. In 2017, John indicated it is used. Recently, in 2022, Gary stated, “We are just not going to use it.” Google’s XML sitemap documentation suggests the attribute is used. But if it isn’t accurate, it will be ignored.
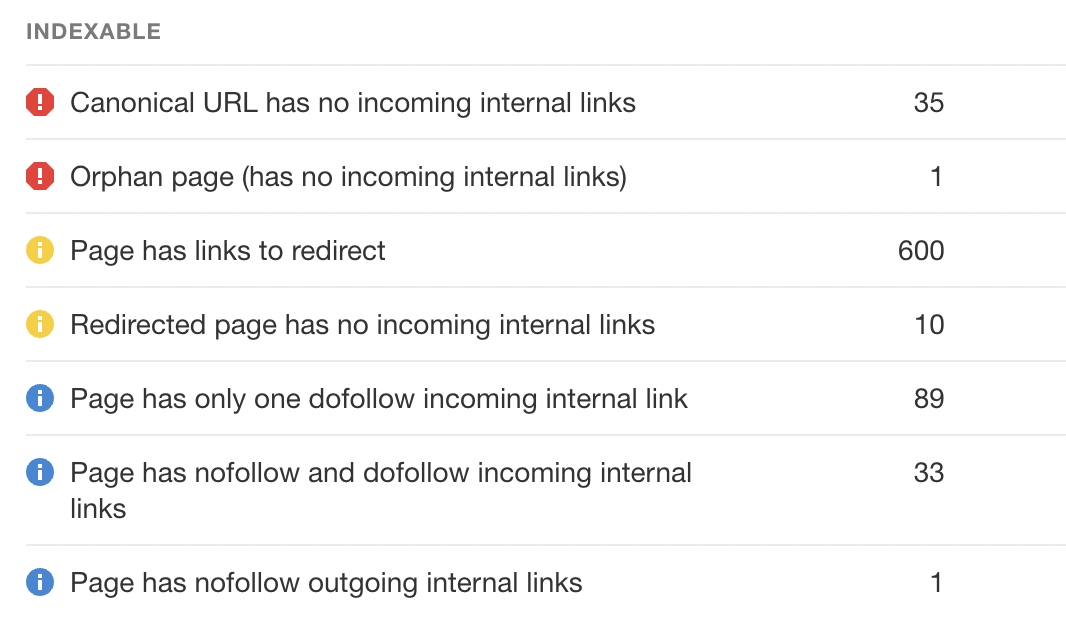
9. Find orphan URLs
Another way to use log files is to discover orphan URLs, i.e., URLs that you want search engines to crawl and index but haven’t internally linked to.
We can do this by checking for 200 status code HTML URLs with no internal links found by Ahrefs’ Site Audit.
You can see the report I’ve created for this named “Orphan URLs.”
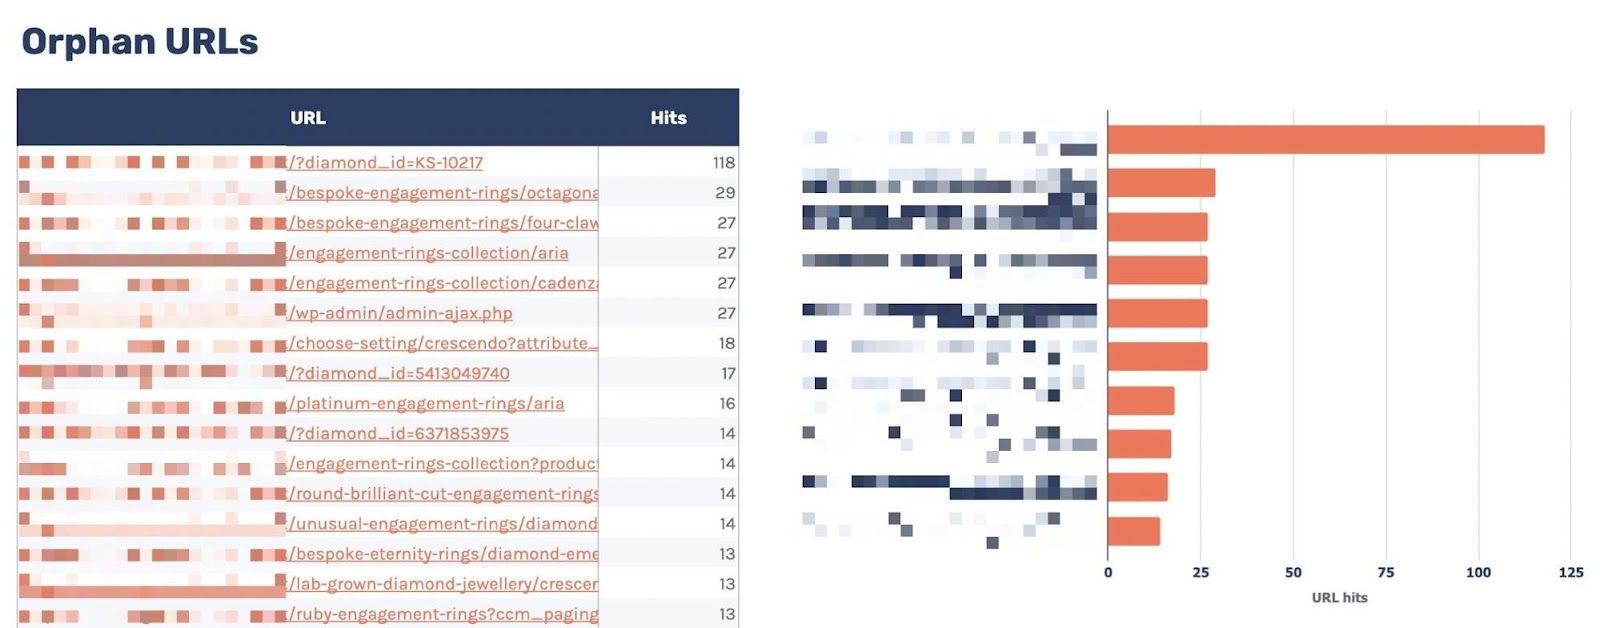
There is one caveat here. As Ahrefs hasn’t discovered these URLs but Googlebot has, these URLs may not be URLs we want to link to because they’re non-indexable.
I recommend copying and pasting these URLs using the “Custom URL list” functionality when setting up crawl sources for your Ahrefs project.
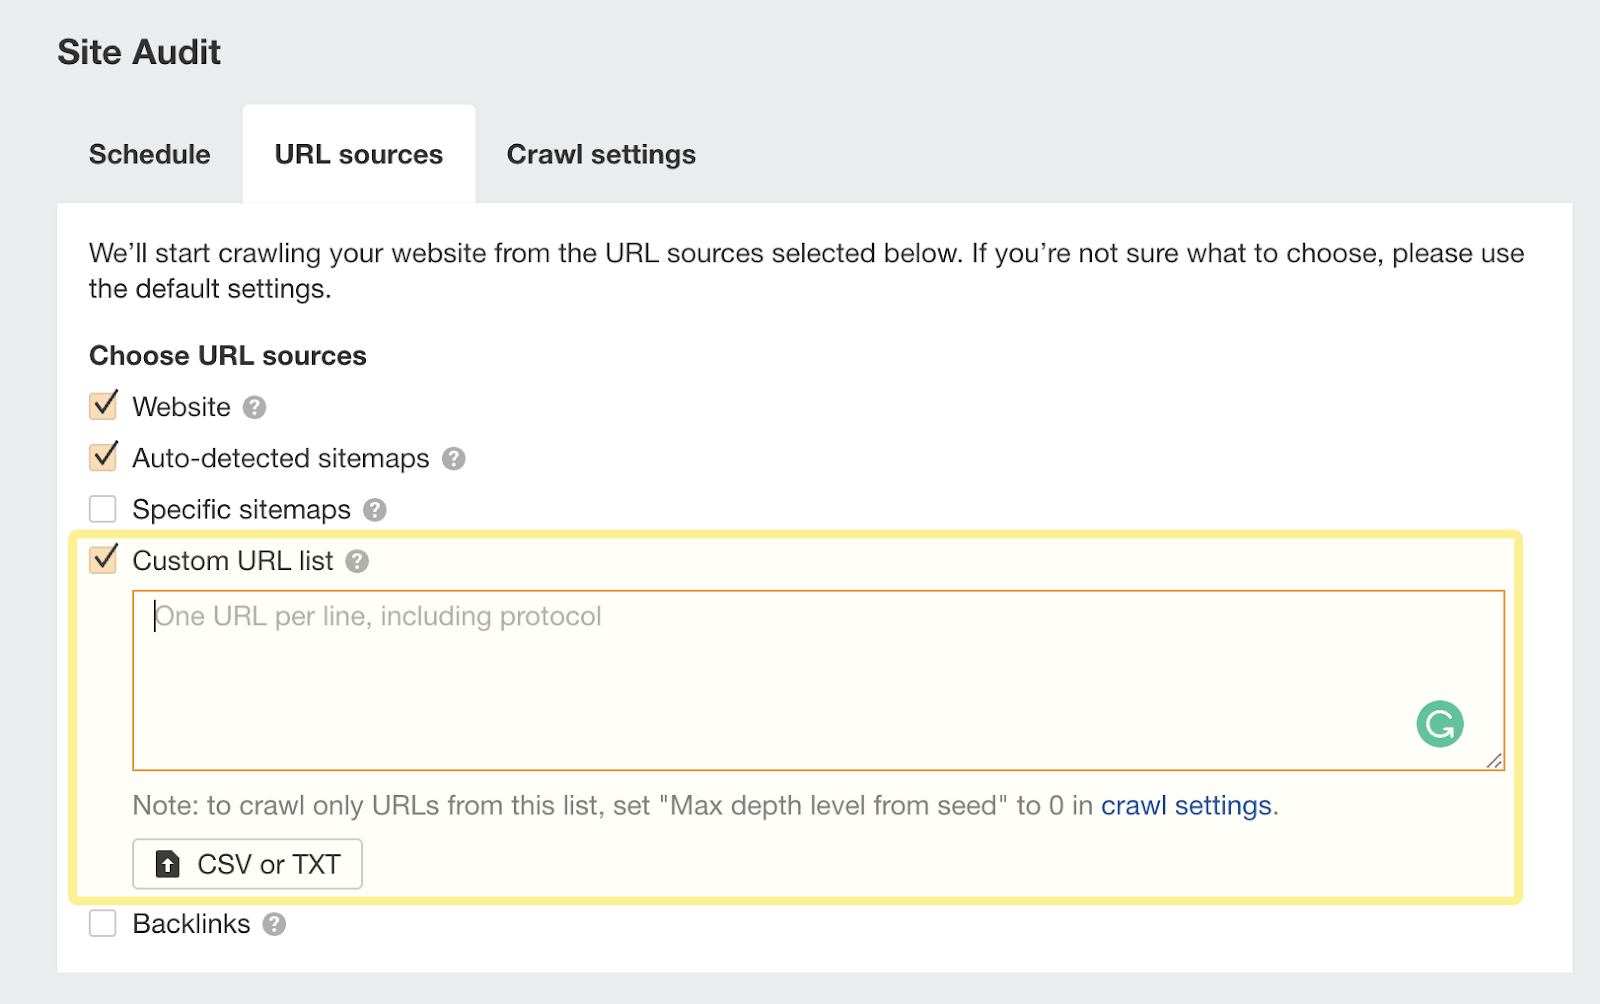
This way, Ahrefs will now consider these orphan URLs found in your log files and report any issues to you in your next crawl:
10. Monitor crawling by directory
Suppose you’ve implemented structured URLs that indicate how you’ve organized your site (e.g., /features/feature-page/).
In that case, you can also analyze log files based on the directory to see if Googlebot is crawling certain sections of the site more than others.
I’ve implemented this kind of analysis in the “Directories - Overview” tab of the Google Sheet.
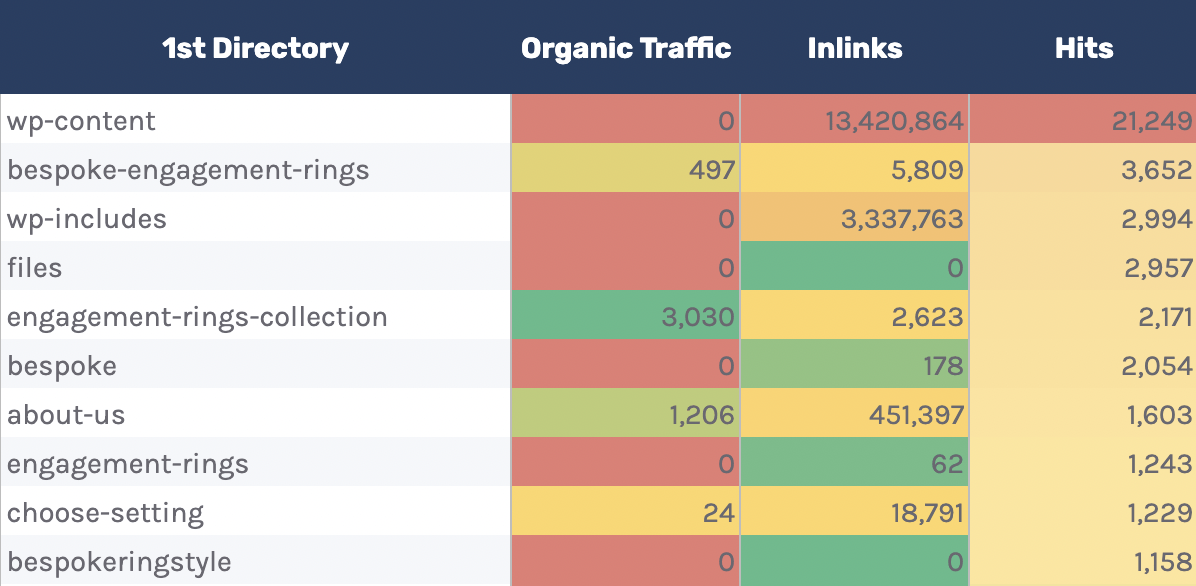
You can see I’ve also included data on the number of internal links to the directories, as well as total organic traffic.
You can use this to see whether Googlebot is spending more time crawling low-traffic directories than high-value ones.
But again, bear in mind this may occur, as some URLs within specific directories change more often than others. Still, it’s worth further investigating if you spot an odd trend.
In addition to this report, there is also a “Directories - Crawl trend” report if you want to see the crawl trend per directory for your site.
11. View Cloudflare cache ratios
Head to the “CF cache status” tab, and you’ll see a summary of how often Cloudflare is caching your files on the edge servers.
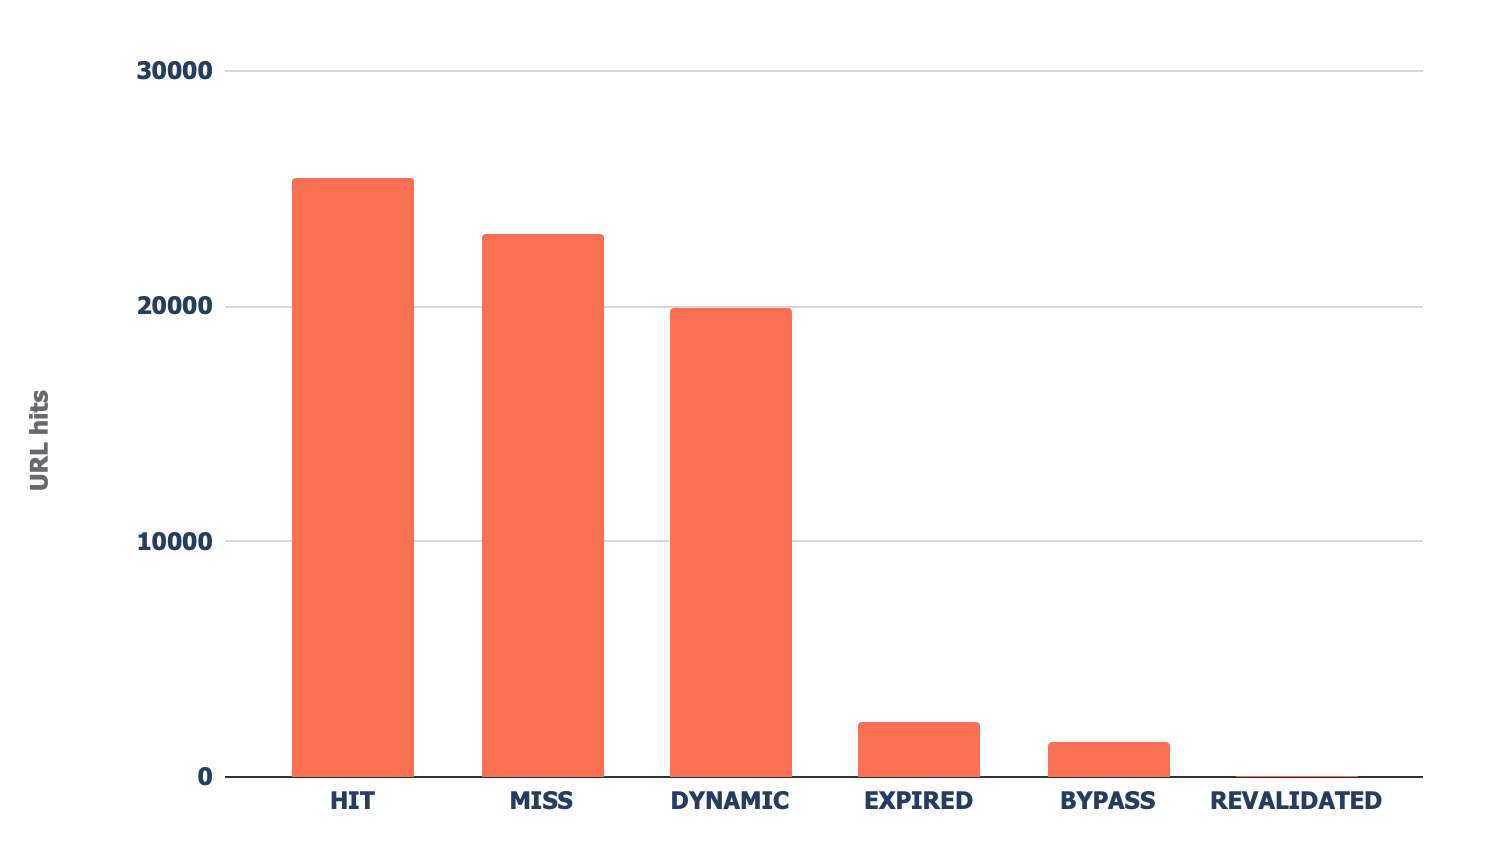
When Cloudflare caches content (HIT in the above chart), the request no longer goes to your origin server and is served directly from its global CDN. This results in better Core Web Vitals, especially for global sites.
If you see a large amount of “Miss” or “Dynamic” responses, I recommend investigating further to understand why Cloudflare isn’t caching content. Common causes can be:
- You’re linking to URLs with parameters in them – Cloudflare, by default, passes requests with parameters to your origin server, as they’re likely dynamic.
- Your cache expiry times are too low – If you set short cache lifespans, it’s likely more users will receive uncached content.
- You aren’t preloading your cache – If you need your cache to expire often (as content changes frequently), rather than letting users hit uncached URLs, use a preloader bot that will prime the cache, such as Optimus Cache Preloader.
12. Check which bots crawl your site the most
The final report (found in the “Bots - Overview” tab) shows you which bots crawl your site the most:
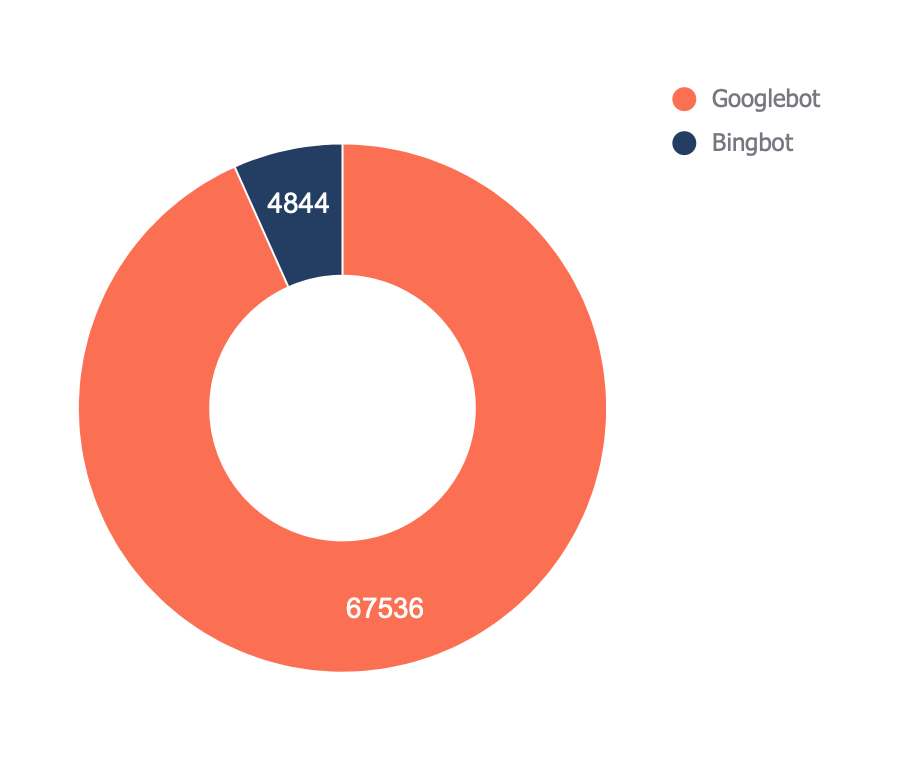
In the “Bots - Crawl trend” report, you can see how that trend has changed over time.
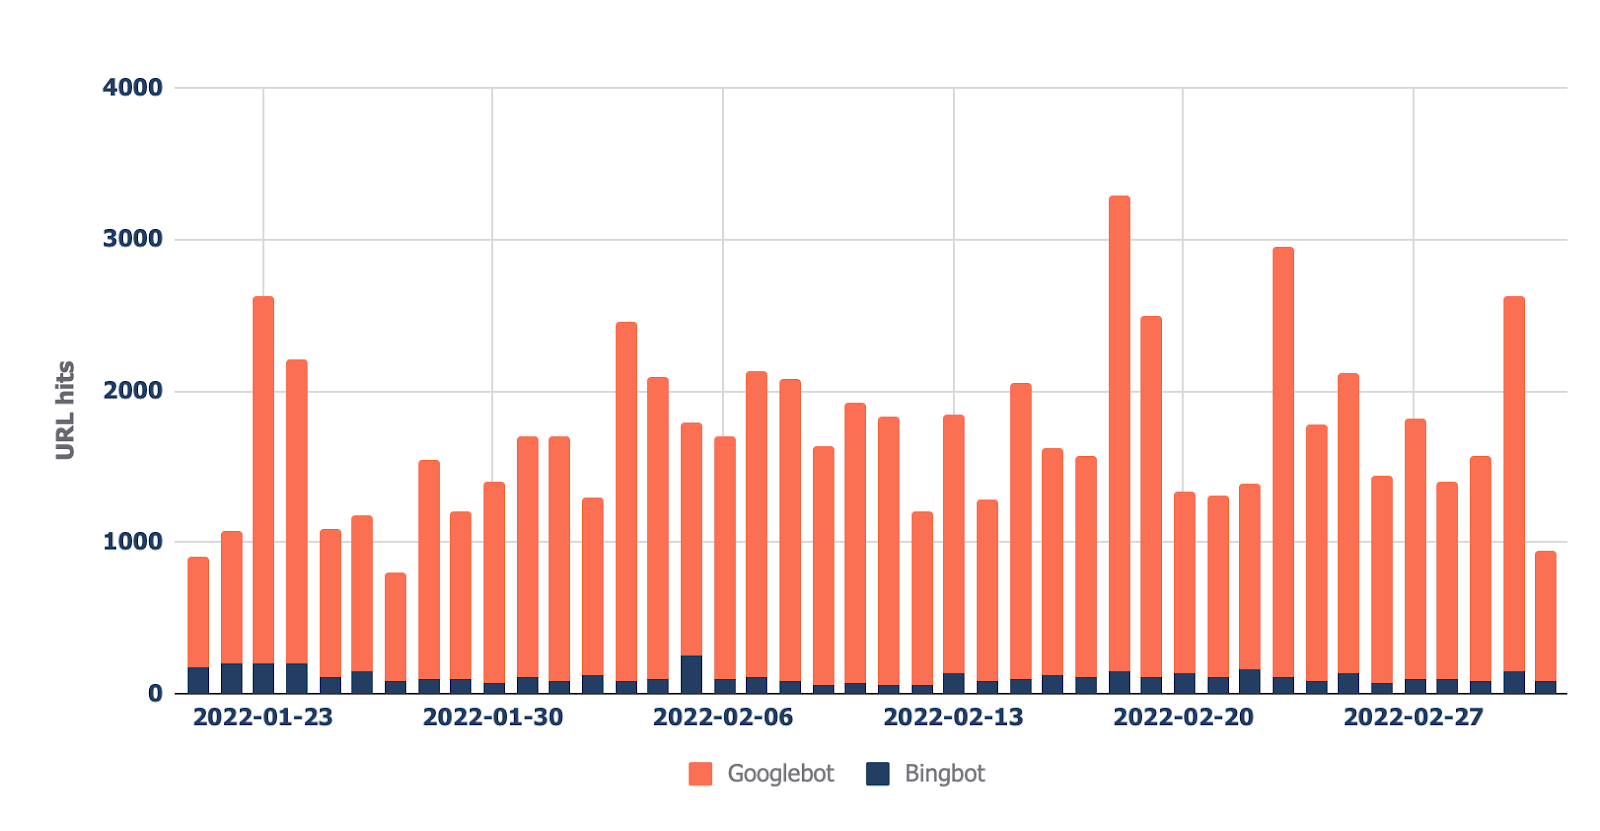
This report can help check if there’s an increase in bot activity on your site. It’s also helpful when you’ve recently made a significant change, such as a URL migration, and want to see if bots have increased their crawling to collect new data.
Final thoughts
You should now have a good idea of the analysis you can do with your log files when auditing a site. Hopefully, you’ll find it easy to use my template and do this analysis yourself.
Anything unique you’re doing with your log files that I haven’t mentioned? Tweet me.