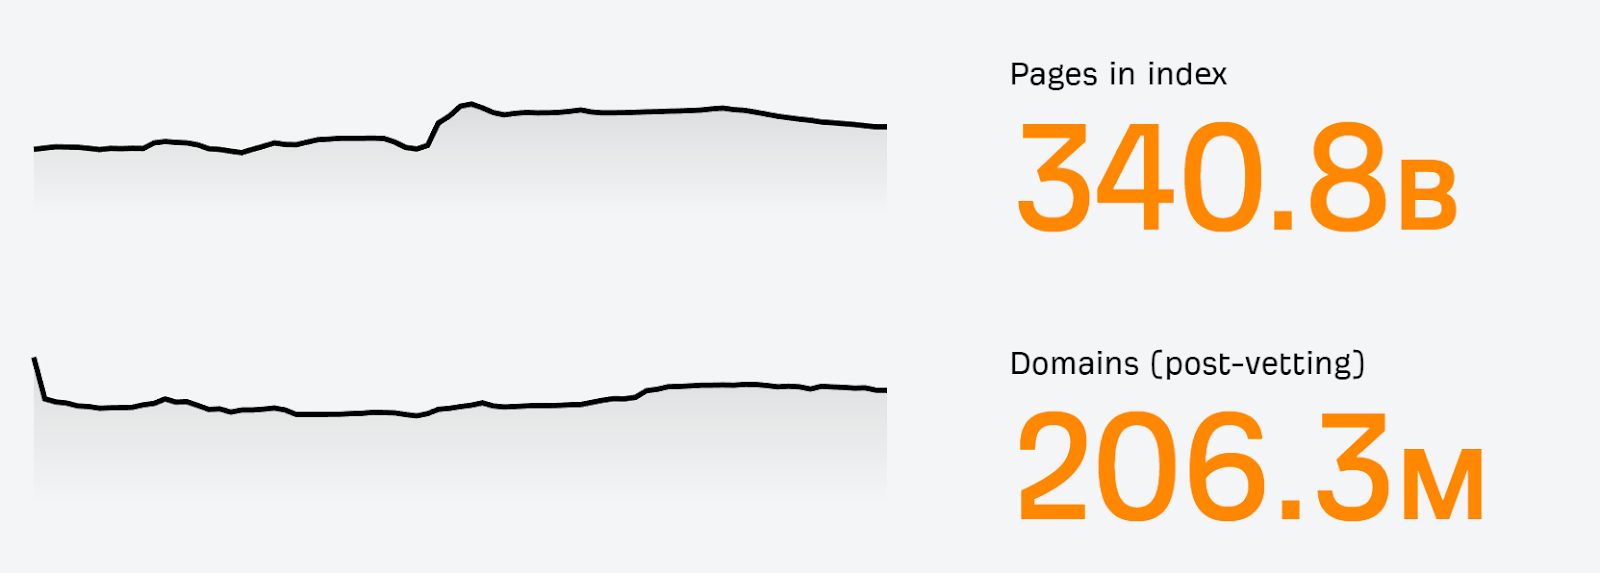
For Ahrefs, we choose to store about 340B pages in our index as of December 2023.
At a certain point, the quality of the web becomes bad. There are lots of spam and junk pages that just add noise to the data without adding any value to the index.
Large parts of the web are also duplicate content, ~60% according to Google’s Gary Illyes. Most of this is technical duplication caused by different systems. However, if you don’t account for this duplication, it can waste more resources and create more noise in the data.
When building an index of the web, companies have to make many choices around crawling, parsing, and indexing data. While there’s going to be a lot of overlap between indexes, there’s also going to be some differences depending on each company’s decisions.
Comparing link indexes is hard because of all the different choices the various tools have made. I try my best to make some comparisons more fair, but even for a few sites I’m telling you that I don’t want to put in all of the work needed to make an accurate comparison, much less do it for an entire study. You’ll see why I say this later when you read what it would take to compare the data accurately.
However, I did run some tests on a sample of sites and I’ll show you how to check the data yourself. I also pulled some fairly large 3rd party data samples for some additional validation.
Let’s dive in.
If you just looked at dashboard numbers for links and RDs in different tools you might see completely different things.
For example, here’s what we count in Ahrefs:
- Live links
- Live RDs
- 6 months of data
In Semrush, here’s what they count:
- Live + dead links
- Live + dead RDs
- 6 months of data + a bit more*
*By a bit more, what I mean is that their data goes back 6 months and to the start of the previous month. So, for instance, if it’s the 15th of the month, they would actually have about 6.5 months of data instead of 6 months of data. If it’s the last week of the month, they may have close to 7 months of data instead of 6.
This may not seem like a lot, but it can increase the numbers shown by a lot, especially when you’re still counting dead links and dead RDs.
I don’t think SEOs want to see a number that includes dead links. I don’t see a good reason to count them, either, other than to have bigger and potentially misleading numbers.
I only say this because I’ve called Semrush out on making this type of biased comparison before on Twitter, but I stopped arguing when I realized that they really didn’t want the comparison to be fair; they just wanted to win the comparison.
There are some ways you can compare the data to get somewhat similar time periods and only look at active links.
If you filter the Semrush backlinks report for “Active” links, you’ll have a somewhat more accurate number to compare against the Ahrefs dashboard number.
Alternatively, if you use the “Show history: Last 6 months” option in the Ahrefs backlink report, this would include lost links and be a fairer comparison to Semrush’s dashboard number.
Here’s an example of how to get more similar data:
- Semrush Dashboard: 5.1K = Ahrefs (6-month date comparison): 5.6K
- Semrush All Links: 5.1K = Ahrefs (6-month date comparison): 5.6K
- Semrush Active Links: 2.9K = Ahrefs Dashboard: 3.5K = Ahrefs (no date comparison): 3.5K
What you should not compare is Semrush Dashboard and Ahrefs Dashboard numbers. The number in Semrush (5.1K) includes dead links. The number in Ahrefs (3.5K) doesn’t; it’s only live links!
Note that the time periods may not be exactly the same as mentioned before because of the extra days in the Semrush data. You could look at what day their data stops and select that exact day in the Ahrefs data to get an even more accurate, but still not quite accurate comparison.
I don’t think the comparison works at all with larger domains because of an issue in Semrush. Here’s what I saw for semrush.com:
- Semrush Dashboard: 48.7M = Ahrefs (6 month date comparison): 24.7M
- Semrush All Links: 48.7M = Ahrefs (6 month date comparison): 24.7M
- Semrush Active Links: 1.8M = Ahrefs Dashboard: 15.9M = Ahrefs (no date comparison): 15.9M
So that’s 1.8M active links in Semrush vs 15.9M active in Ahrefs. But as I said, I don’t think this is a fair comparison. Semrush seems to have an issue with larger sites. There is a warning in Semrush that says, “Due to the size of the analyzed domain, only the most relevant links will be shown.” It’s possible they’re not showing all the links, but this is suspicious because they will show the total for all links which is a larger number, and I can filter those in other ways.
I can also sort normally by the oldest last seen date and see all the links, but when I do last seen + active, I see only 608K links. I can’t get more than 50k rows in their system to investigate this further, but something is fishy here.
More link differences
The above comparison wouldn’t be enough to make an accurate comparison. There are still a number of differences and problems that make any sort of comparison troublesome.
This tweet is as relevant as the day I wrote it:
It’s almost impossible to do a fair link comparison
Here’s how we count links, but it’s worth mentioning that each tool counts links in different ways.
To recap some of the main points, here are some things we do:
- We store some links inserted with JavaScript, no one else does this. We render ~250M pages a day.
- We have a canonicalization system in place that others may not, which means we shouldn’t count as many duplicates as others do.
- Our crawler tries to be intelligent about what to prioritize for crawling to avoid spam and things like infinite crawl paths.
- We count one link per page, others may count multiple links per page.
These differences make a fair link comparison nearly impossible to do.
How to see where the biggest link differences are
The easiest way to see the biggest discrepancies in link totals is to go to the Referring Domains reports in the tools and sort by the number of links. You can use the dropdowns to see what kinds of issues each index may have with overcounting some links. In many cases, you’re likely to see millions of links from the same site for some of the reasons mentioned above.
For example, when I looked in Semrush I found blogspot links that they claimed to have recently checked, but these are showing 404 when I visit them. Semrush still counts them for some reason. I saw this issue on multiple domains I checked. This is one of those pages:

Lots of links counted as live are actually dead
Seeing the dead link above counted in the total made me want to check how many dead links were in each index. I ran crawls on the list of the most recent live links in each tool to see how many were actually still live.
For Semrush, 49.6% of the links they said were live were actually dead. Some churn is expected as the web changes, but half the links in 6 months indicates that a lot of these may be on the spammier part of the web that isn’t as stable or they’re not re-crawling the links often. For some context, the same number for Ahrefs came back as 17.2% dead.
It’s going to get more complicated to compare these numbers
Ahrefs recently added a filter for “Best links” which you can configure to filter out noise. For instance, if you want to remove all blogspot.com blogs from the report, you can add a filter for it.
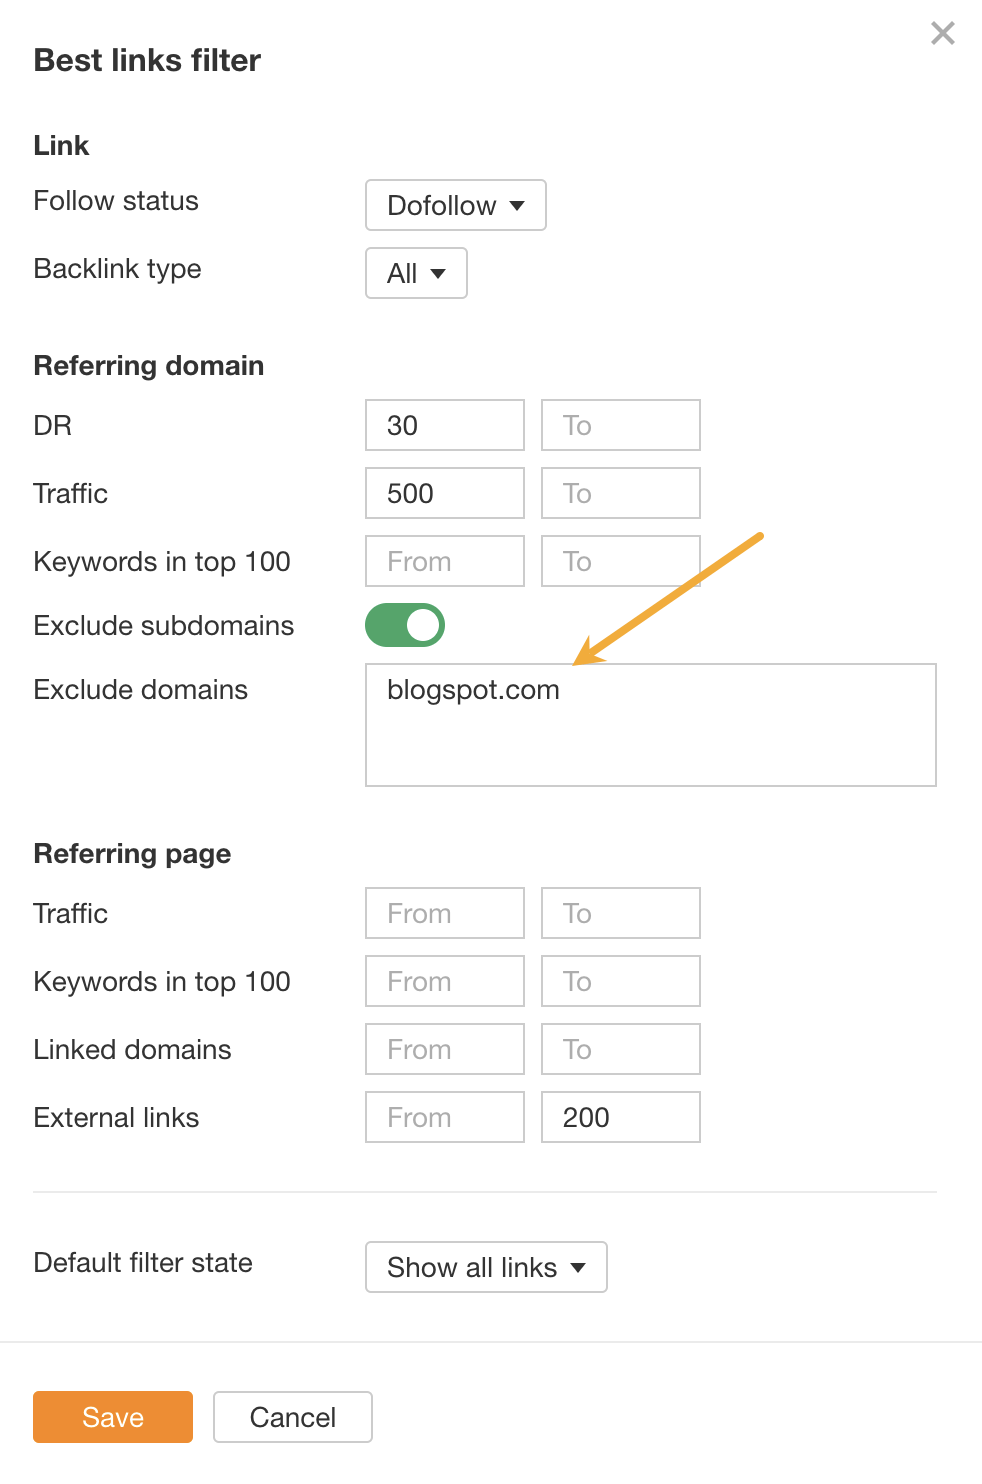
This means you’ll only see links you consider important in the reports. This can also be applied to the main dashboard numbers and charts now. If the filter is active, people will see different numbers depending on their settings.
This also leads to another point about granularity of data. Ahrefs has 77 data points around each link. Semrush has 22. If you really need to slice and dice the link data, Ahrefs is going to let you do it in more ways.
You would think this is straightforward, but it’s not.
Solving for all the issues is a lot of work
There are a lot of different things you’d have to solve for here:
- The extra days in Semrush’s data that you’ll have to remove or add to the Ahrefs number.
- Remember that Semrush also includes dead RDs in their dashboard numbers. So you need to filter their RD report to just “Active” to get the live ones.
- Remember that half the links in the test of Semrush live data were actually dead, so I would suspect that a number of the RDs are actually lost as well. You could possibly look for domains with low link counts and just crawl the listed links from those to remove most of the dead ones.
- After all that, you’re still going to need to strip the domains down to the root domain only to account for the differences in what each tool may be counting as a domain.
What is a domain?
Ahrefs currently shows 206.3M RDs in our database and Semrush shows 1.6B. Domains are being counted in extremely different ways between the tools.
According to the major sources who look at these kinds of things, the number of domains on the internet seems to be between 269M-359M and the number of websites between 1.1B-1.5B, with 191M-200M of them being active.
Semrush’s number of RDs is higher than the number of domains that exist.
I believe Semrush may be confusing different terms. Their numbers match fairly closely with the number of websites on the internet, but that’s not the same as the number of domains. Plus, many of those websites aren’t even live.
Another possibility is they’re counting dead domains. If we do that, our comparable number is 1.86B to their 1.6B.
It’s going to get more complicated to compare these numbers
Part of our process is dropping spam domains, and we also treat some subdomains as different domains. We come up close to the numbers from other 3rd party studies for the number of active websites and domains, whereas Semrush seems to come in closer to the total number of websites (including inactive ones).
We’re going to simplify our methodology soon so that one domain is actually just one domain. This is going to make our RD numbers go down, but be more accurate to what people actually consider a domain. It’s also going to make for an even bigger disparity in the numbers between the tools.
I ran some quality checks for both the first-seen and last-seen link data. On every site I checked, Ahrefs picked up more links first and on most Ahrefs updated the links more recently than Semrush. Don’t just believe me, though; check for yourself.
Comparing this is biased no matter how you look at it because our data is more granular and includes the hours and minutes instead of just the day. Leaving the hours and minutes creates a biased comparison, and so does removing it. You’ll have to match the URLs and check which date is first or if there is a tie and then count the totals. There will be some different links in each dataset, so you’ll need to do the lookups on each set of data for comparison.
Semrush claims, “We update the backlinks data in the interface every 15 minutes.”
Ahrefs claims, “The world’s largest index of live backlinks, updated with fresh data every 15–30 minutes.”
I pulled data at the same time from both tools to see when the latest links for some popular websites were found. Here’s a summary table:
| Domain | Ahrefs Latest | Semrush latest |
|---|---|---|
| semrush.com | 3 minutes ago | 7 days ago |
| ahrefs.com | 2 minutes ago | 5 days ago |
| hubspot.com | 0 minutes ago | 9 days ago |
| foxnews.com | 1 minute ago | 12 days ago |
| cnn.com | 0 minutes ago | 13 days ago |
| amazon.com | 0 minutes ago | 6 days ago |
That doesn’t seem fresh at all. Their 15-minute update claim seems pretty dubious to me with so many websites not having updates for many days.
In fairness, for some smaller sites it was more mixed on who showed fresher data. I think they may have some issues with the processing of larger sites.
One day after this post was published, Semrush is showing 7 links from 2 RDs and Ahrefs is showing 120 links from 19 RDs.
Don’t just trust me, though; I encourage you to check some websites yourself. Go into the backlinks reports in both tools and sort by last seen. Be sure to share your results on social media.
This will make our data even fresher. That’s ~2.5B URLs / day in March 2024. The websites tell us about new pages, deleted pages, or any changes they make so that we can go crawl them and update the data. Read more here.
Ahrefs crawls 7B+ pages every day. Semrush claims they crawl 25B pages per day. This would be ~3.5x what Ahrefs crawls per day. The problem is that I can’t find any evidence that they crawl that fast.
We saw that around half the links that Semrush had marked as active were actually dead compared to about 17% in Ahrefs, which indicated to me that they may not re-crawl links as often. That and the freshness test both pointed to them crawling slower. I decided to look into it.
Logs of my sites
I checked the logs of some of my sites and sites I have access to, and I didn’t see anything to support the claim that Semrush crawls faster. If you have access to logs of your own site, you should be able to check which bots are crawling the fastest.
80,000 months of log data
I was curious and wanted to look at bigger samples. I used Web Explorer and a few different footprints (patterns) to find log file summaries produced by AWStats and Webalizer. These are often published on the web.
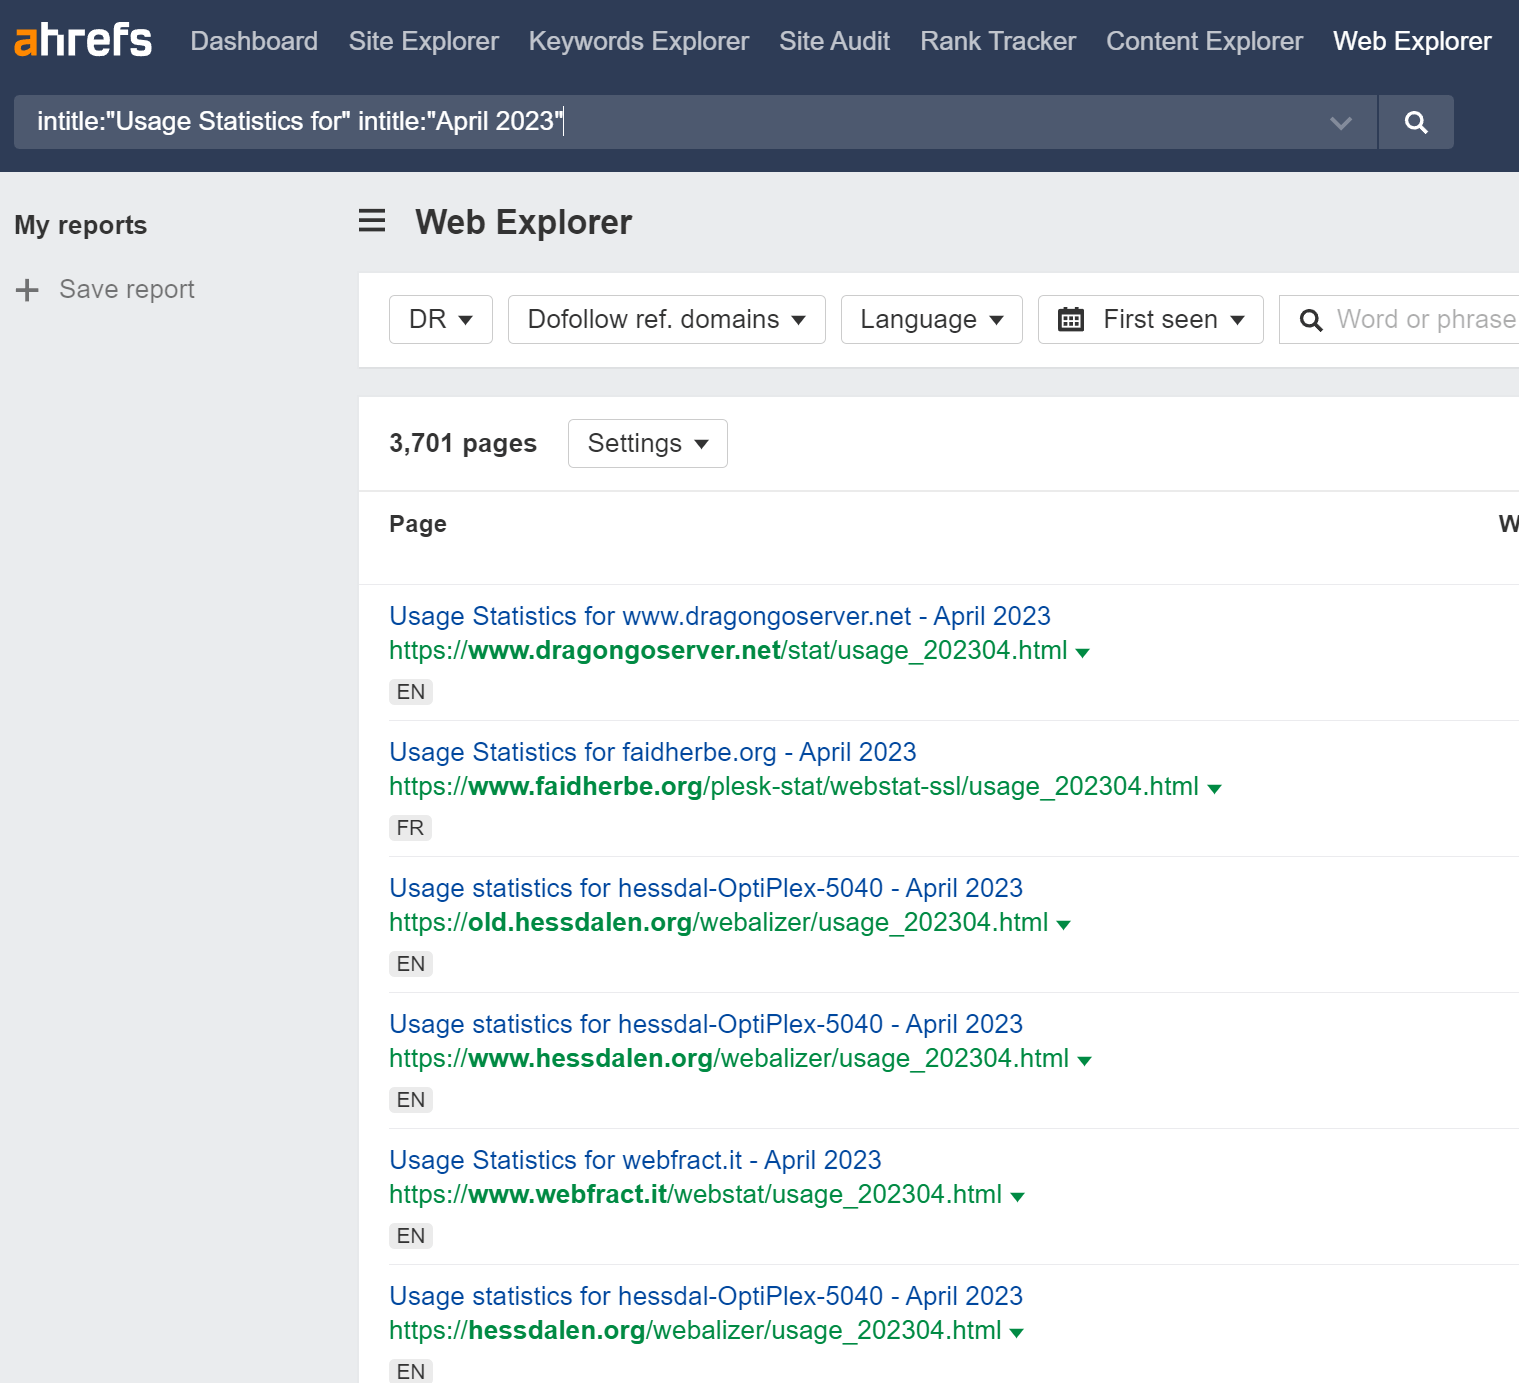
I scraped and parsed ~80,000 log file summaries that contained 1 month of data each and were generated in the last couple of years. This sample contained over 9k websites in total.
I did not see evidence of Semrush crawling many times faster than Ahrefs for these sites, as they claim they do. The only bot that was crawling much faster than Ahrefsbot in this dataset was Googlebot. Even other search engines were behind our crawl rate.
That’s just data from a small-ish number of sites compared to the scale of the web. What about for a larger chunk of the web?
Data from 20%+ of web traffic
At the time of writing, Cloudflare Radar has Ahrefsbot as the #7 most active bot on the web and Semrushbot at #40.
While this isn’t a complete picture of the web, it’s a fairly large chunk. In 2021, Cloudflare was said to manage ~20% of the web’s traffic, up from ~10% in 2018. It’s likely much higher now with that kind of growth. I couldn’t find the numbers from 2021, but in early 2022 they were handling 32 million HTTP requests / second on average and in early 2023 they had already grown to handling 45 million HTTP requests / second on average, over 40% more in one year!
Additionally, ~80% of websites that use a CDN use Cloudflare. They handle many of the larger sites on the web; BuiltWith shows that Cloudflare is used by ~32% of the Top 1M websites. That’s a significant sample size and likely the largest sample that exists.
How much do SEO tools crawl?
Some of the SEO tools share the number of pages they crawl on their websites. The only one in the chart below that doesn’t have a publicly published crawl rate is AhrefsSiteAudit bot, but I asked our team to pull the info for this. Let me put the rankings in perspective with actual and claimed crawl rates.
| Ranking | Bot | Crawl Rate |
|---|---|---|
| 7 | Ahrefsbot | 7B+ / day |
| 27 | DataForSEO Bot | 2B / day |
| 29 | AhrefsSiteAudit | 600M - 700M / day |
| 35 | Botify | 143.3M / day |
| 40 | Semrushbot | 25B / day* claimed |
The math isn’t mathing. How can Semrush claim they’re crawling multiple times as fast as these others, but their ranking is lower? Cloudflare doesn’t cover the entire web, but it’s a large chunk of the web and a more than representative sample size.
When they originally made this 25B claim, I believe they were closer to 90th on Cloudflare Radar, near the bottom of the list at the time. Semrush hasn’t updated this number since then, and I recall a period of time where they were in the 60s-70s on Cloudflare Radar as well. They do seem to be getting faster, but their claimed numbers still don’t add up.
I don’t hear SEOs raving about Moz or Sistrix having the best link data, but they are 21st and 36th on the list respectively. Both are higher than Semrush.
Possible explanations of differences
Semrush may be conflating the term pages with links, which is actually mentioned in some of their documentation. I don’t want to link to it, but you can find it with this quote: “Daily, our bot crawls over 25 billion links”. But links are not the same thing as pages and there can be hundreds of links on a single page.
It’s also possible they’re crawling a portion of the web that’s just more spammy and isn’t reflected in the data from either of the sources I looked at. Some of the numbers indicate this may be the case.
Y’all shouldn’t trust studies done by a specific vendor when it compares them to others, even this one. I try to be as fair as I can be and follow the data, but since I work at Ahrefs you can hardly consider me unbiased. Go look at the data yourselves and run your own tests.
There are some folks in the SEO community who try to do these tests every once in a while. The last major 3rd party study was run by Matthew Woodward, who initially declared Semrush the winner, but the conclusion was changed and Ahrefs was ultimately declared to be the rightful winner. What happened?
The methodology chosen for the study heavily favored Semrush and was investigated by a friend of mine, Russ Jones, may he rest in peace. Here’s what Russ had to say about it:
While services like Majestic and Ahrefs likely store a single canonical IP address per domain, SEMRush seems to store per link, which accounts for why there would be more IPs that referring domains in some cases. I do not think SEMRush is intentionally inflating their numbers, I think they are storing the data in a different way than competitors which results in a number that is higher and potentially misleading, but not due to ill intent.
The response from Matthew indicated that Semrush might have misled him in their favor. Here’s that comment:

In the end, Ahrefs won.
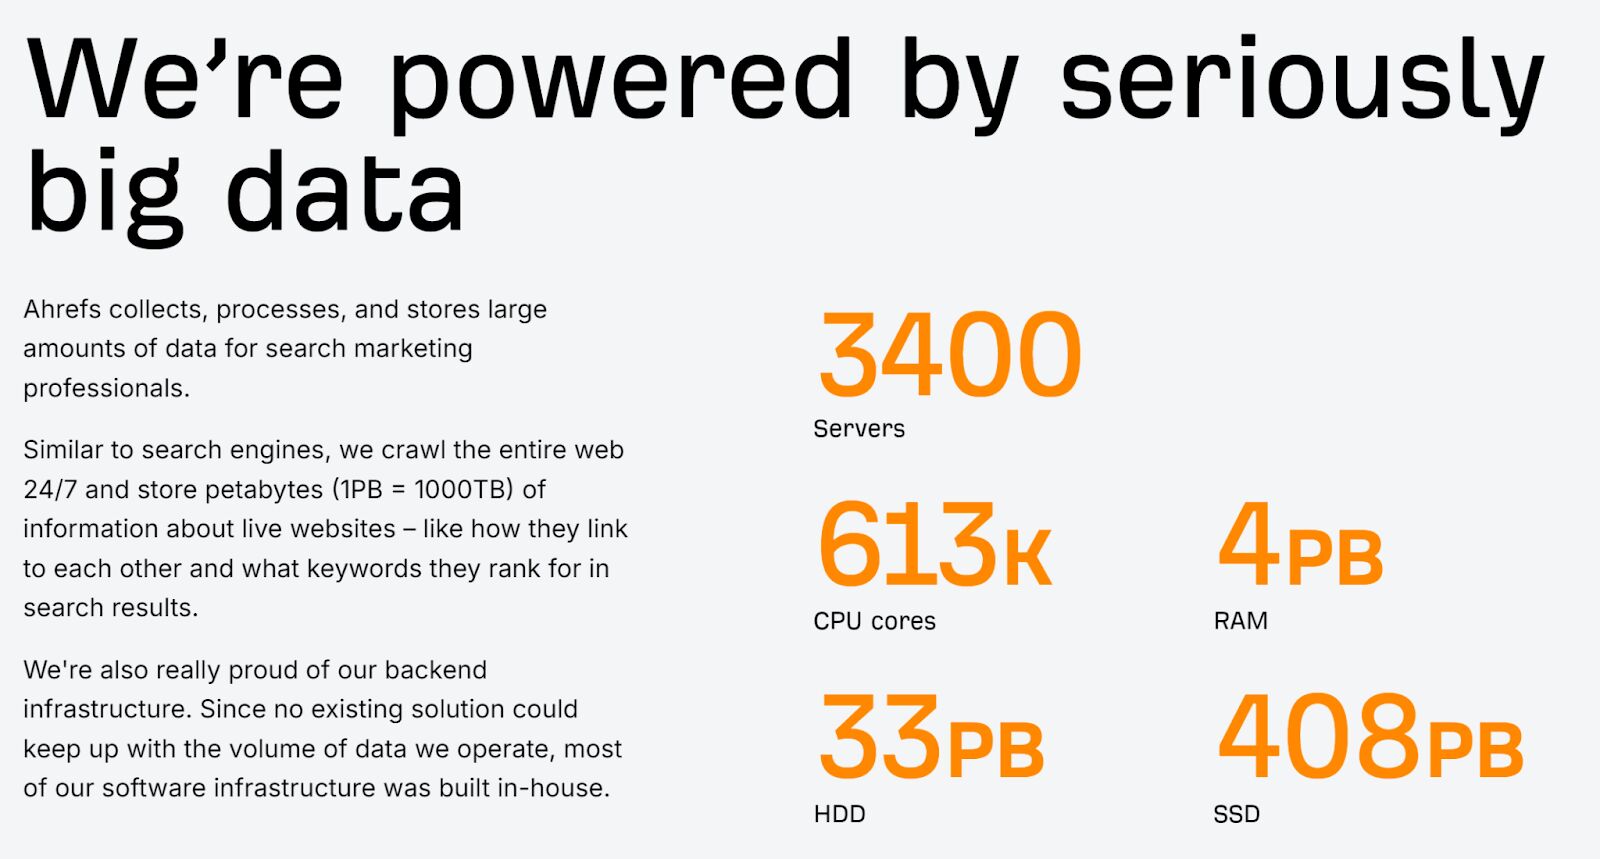
Check our current stats on our big data page.
While Semrush doesn’t provide current hardware stats, they did provide some in the past when they made changes to their link index.
In June 2019, they made an announcement that claimed they had the biggest index. The test from Matthew Woodward that I talked about happened after this test, and as you saw, Ahrefs won that.
In June 2021, they made another announcement about their link index that claimed they were the biggest, fastest, and best.
These are some stats they released at the time:
- 500 servers
- 16,128 cpu cores
- 245 TB of memory
- 13.9 PB of storage
- 25B+ pages / day
- 43.8T links
The release said they increased storage, but their previous release said they had 4000 PBs of storage. They said the storage was 4x, so I guess the previous number was supposed to be 4000 TBs and not 4000 PBs, and they just got mixed up on the terminology.
I checked our numbers at the time, and this is how we matched up:
- 2400 servers (~5x greater)
- 200,000 cpu cores (~12.5x greater)
- 900 TB of memory (~4x greater)
- 120 PB of storage (~9x greater)
- 7B pages / day (~3.5x less???)
- 2.8T live links (I’m not sure the total size, but to this day it’s not as big as the number they claimed)
They were claiming more links and faster crawling with much less storage and hardware. Granted, we don’t know the details of the hardware, but we don’t run on dated tech.
They claimed to store more links than we have even now and in less space than we add to our system each month. It really doesn’t make sense.
Final thoughts
Don’t blindly trust the numbers on the dashboards or the general numbers because they may represent completely different things. While there’s no perfect way to compare the data between different tools, you can run many of the checks I showed to try to compare similar things and clean up the data. If something looks off, ask the tool vendors for an explanation.
If there ever comes a time when we stop winning on things like tech and crawl speed, go ahead and switch to another tool and stop paying us. But until that time, I’d be highly skeptical of any claims by other tools.
If you have questions, message me on X.