While the amount of data you can get is amazing, you don’t need to track every single thing. Trying to do so will send you down a rabbit hole with no real outcome. There are only three metrics you need to track growth over time.
But first, let’s make sure we’re on the same page about what a metric is.
Ahrefs Web Analytics is a simple Google Analytics alternative. Fast, privacy-friendly, and free for up to 1 million events per month per site.
What is a metric in Google Analytics?
Metrics are quantitative measurements that tell you how some aspect of your website performed. For example, the number of times a specific page was viewed or how many times a certain video was played.
It’s important to note that metrics are different from dimensions. Dimensions are what your metrics are measured against. This means instead of just measuring users, you could measure users (metric) by channel (dimension).
Three Google Analytics metrics you should be tracking
There are over 100 different metrics available in Google Analytics (GA), but only three metrics are useful for tracking growth over time.
1. Users
At the most basic level, you need to know if the marketing efforts are resulting in site growth.
Users will tell you exactly that. The users metric in GA tells us how many unique visitors a website received within a set period of time and provides a high-level view of whether marketing efforts are resulting in site growth.
To view all users by traffic source, open the Life cycle > Acquisition > Traffic acquisition report and set your desired date range.
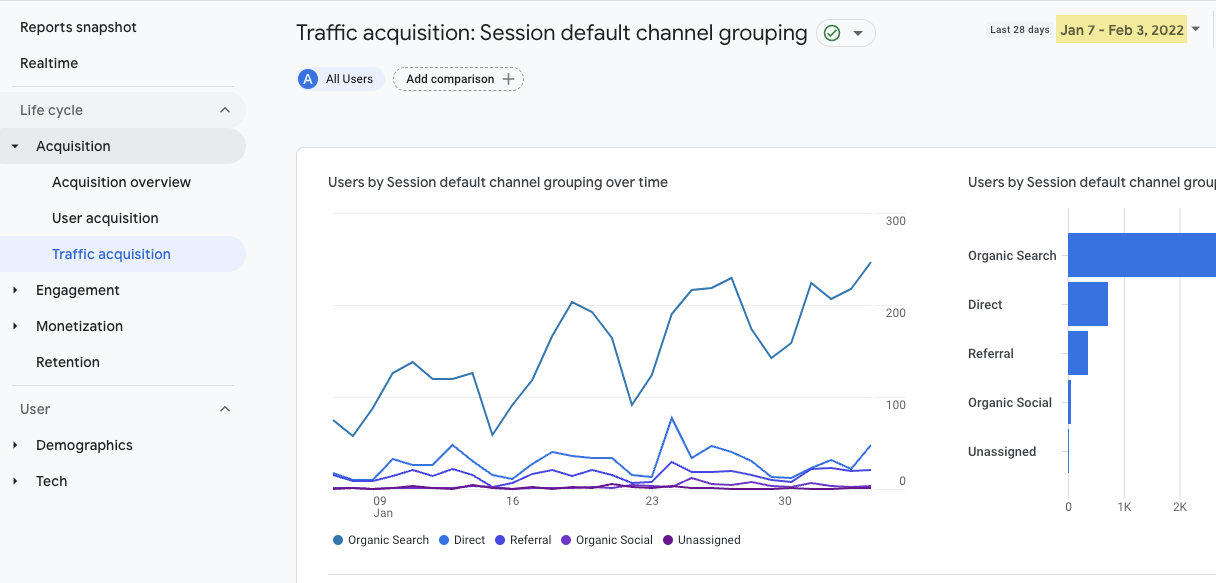
The report will automatically display the session default channel grouping. Default channel grouping is the marketing channel defined by GA and utilized by new and returning users to arrive on your site or app.
For example, the screenshot below shows that we received 3,666 users from Organic Search in Q4 2021:
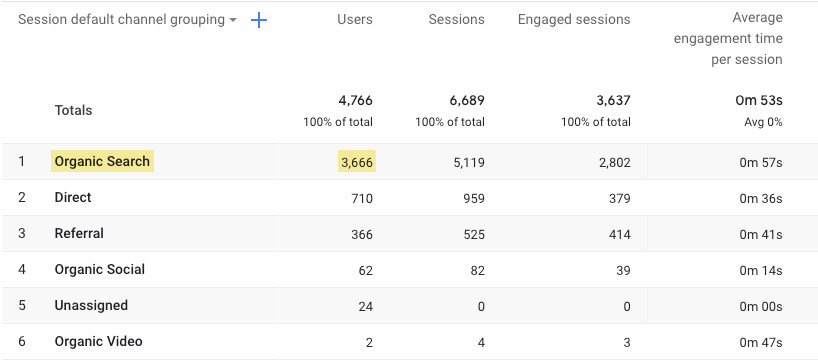
To find the traffic’s source, we can add a secondary dimension by clicking on the blue “plus” sign next to Session default channel grouping and selecting Session Acquisition > Session source.
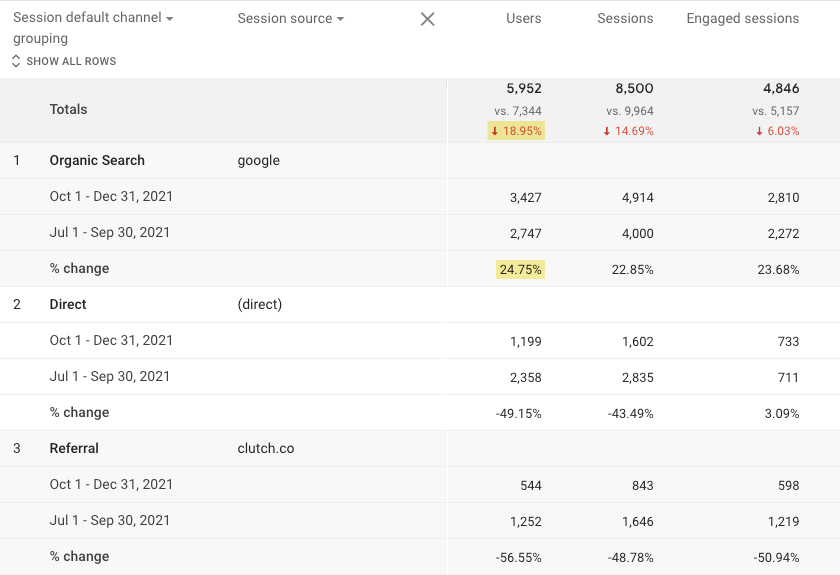
To see the percent change, we can add a comparison period. In the top right, click on the date range drop-down arrow and select a custom date range for Q4 > Compare > Preceding period (match day of week) to compare performance.
Which comparison period you should choose will depend on various factors like how old the GA account is, if seasonality plays a role in the business, or if the company is new to investing in the marketing channel.
We chose the previous period for this example because the site did not have GA set up last year and seasonality does not play a major role.
The screenshot below shows an overall decrease in users by 18.95%, but Google/Organic Search increased by 24.75% in Q4 2021 as compared to Q3 2021.
2. User engagement
Now that we know where users are coming from, we need to understand what content they’re engaging with and what fails to earn their attention.
Average engagement time tells us the average length of time that the site had focus in the user’s browser. (Meaning the user was most likely looking at it.)
By viewing this metric for different pages on our site, we can learn what articles to write more of (those with the highest engagement time) and which articles require further analysis (low engagement time).
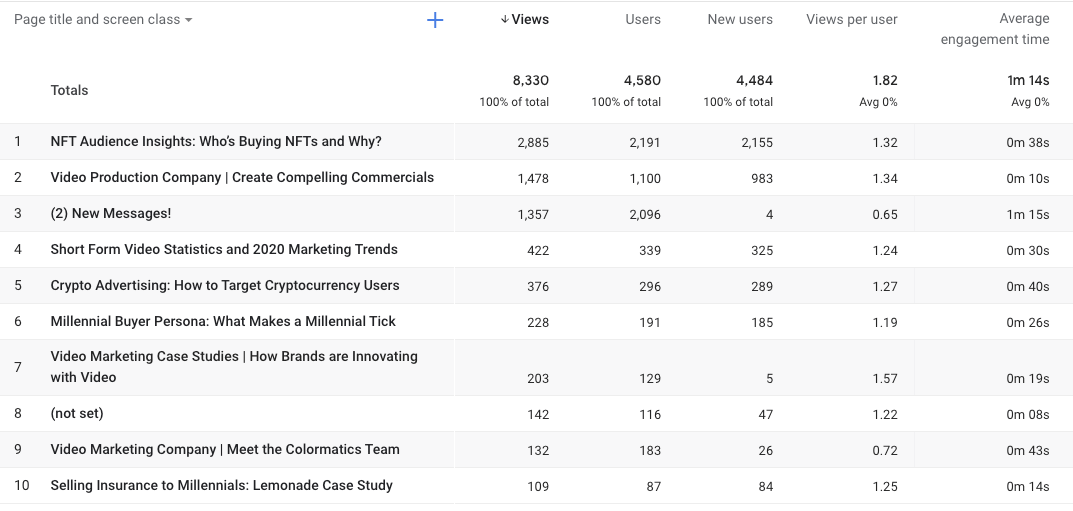
To view all users by traffic source, open the Life cycle > Engagement > Pages and screens report and set your desired date range.
Now we need to segment this data to just the traffic source we are analyzing.
Take Google organic. We can add a dimension by clicking on Add comparison in the top left, adding the “session/source medium” dimension, adding the “google/organic” dimension values, and removing “All Users” by hovering over text and clicking the “x.”
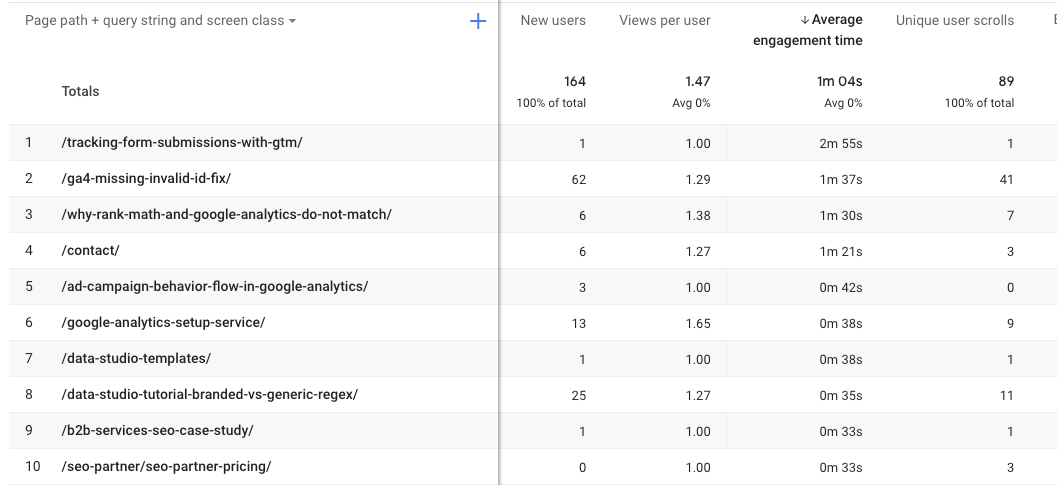
You can change how the data is displayed in the table using the drop-down arrow. If you prefer to see the page title, select “Page title.” Or if you want to know the URL, choose Page path + query string and screen class.
Lastly, click on the Average engagement time column to sort the table from highest to lowest.
In the example below, Google organic search users are interested in fixing GA4 missing or invalid ID errors. Creating more content about fixing GA errors may be helpful.
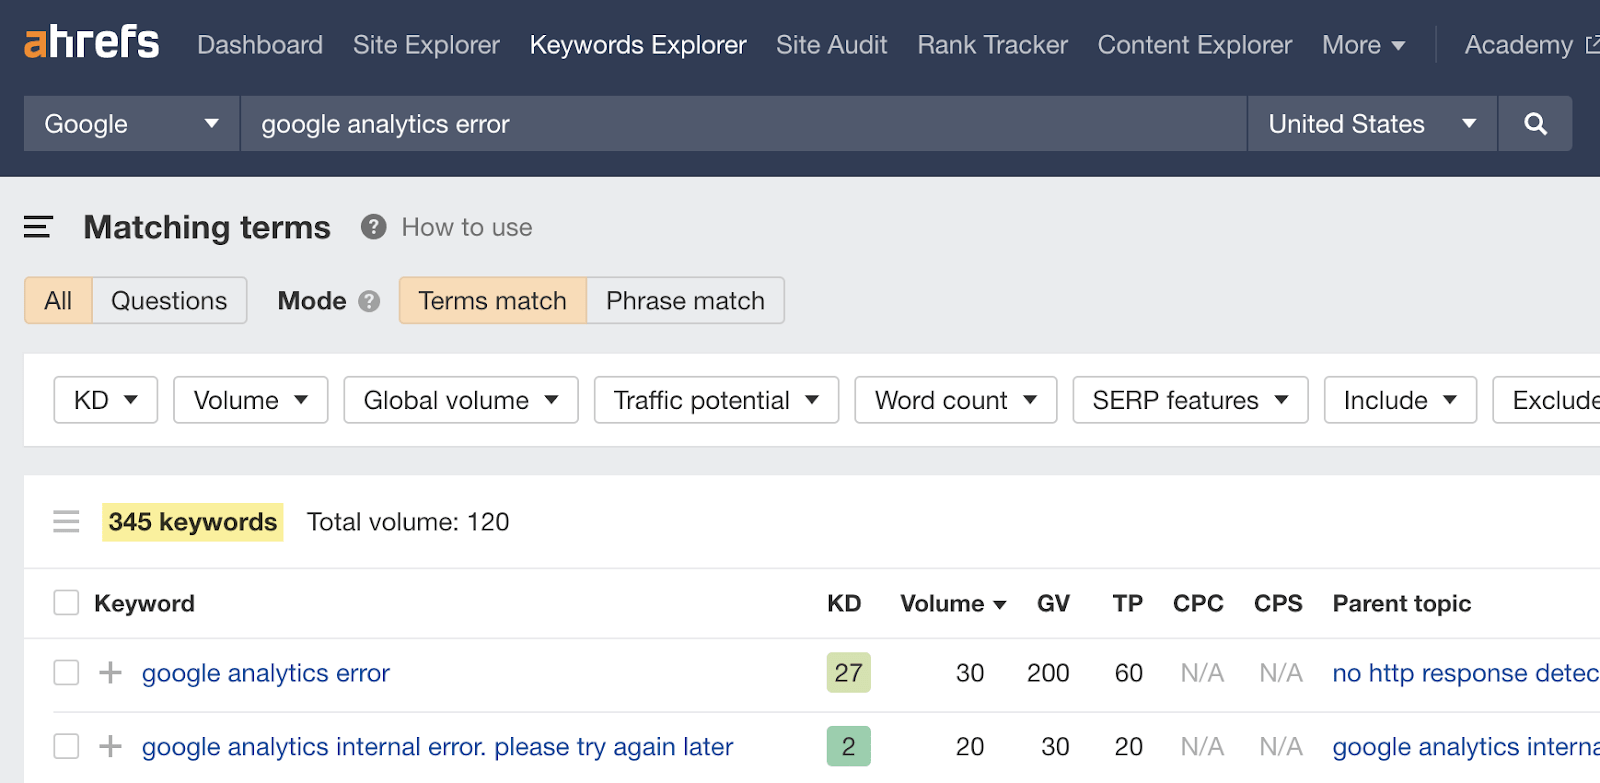
Now that you know what topics are resonating with your readers the most, plug them into Ahrefs’ Keywords Explorer to find similar topics people are searching for.
3. Conversions
The most important metric is conversions. Conversions are user activities that contribute to the success of your business.
A Conversion in GA4 is equivalent to what we know as a Goal in Universal Analytics (UA).
To view the Conversions report in GA4, open the Life cycle > Engagement > Conversions report. You will see collected events automatically marked as conversions and any event that you manually marked as a conversion.
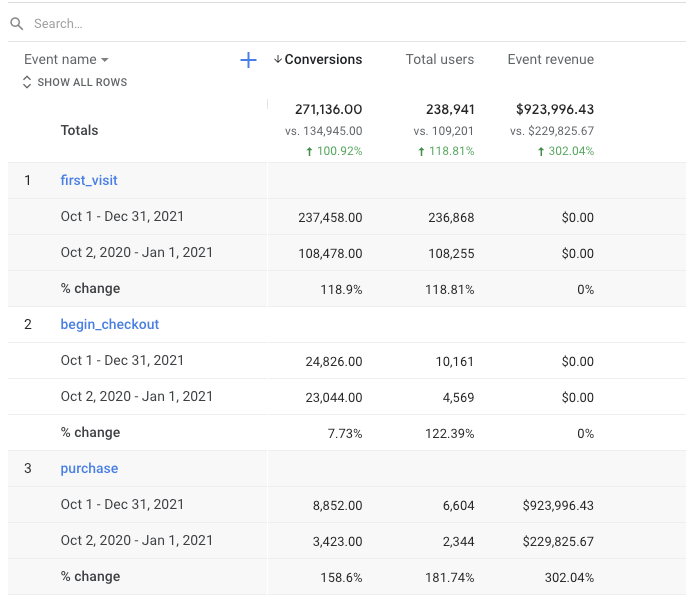
The image above shows conversions in Q4 2021 compared to Q4 2020 (matching day of the week). You can drill down to a specific conversion by clicking on the blue text, such as clicking on purchase.
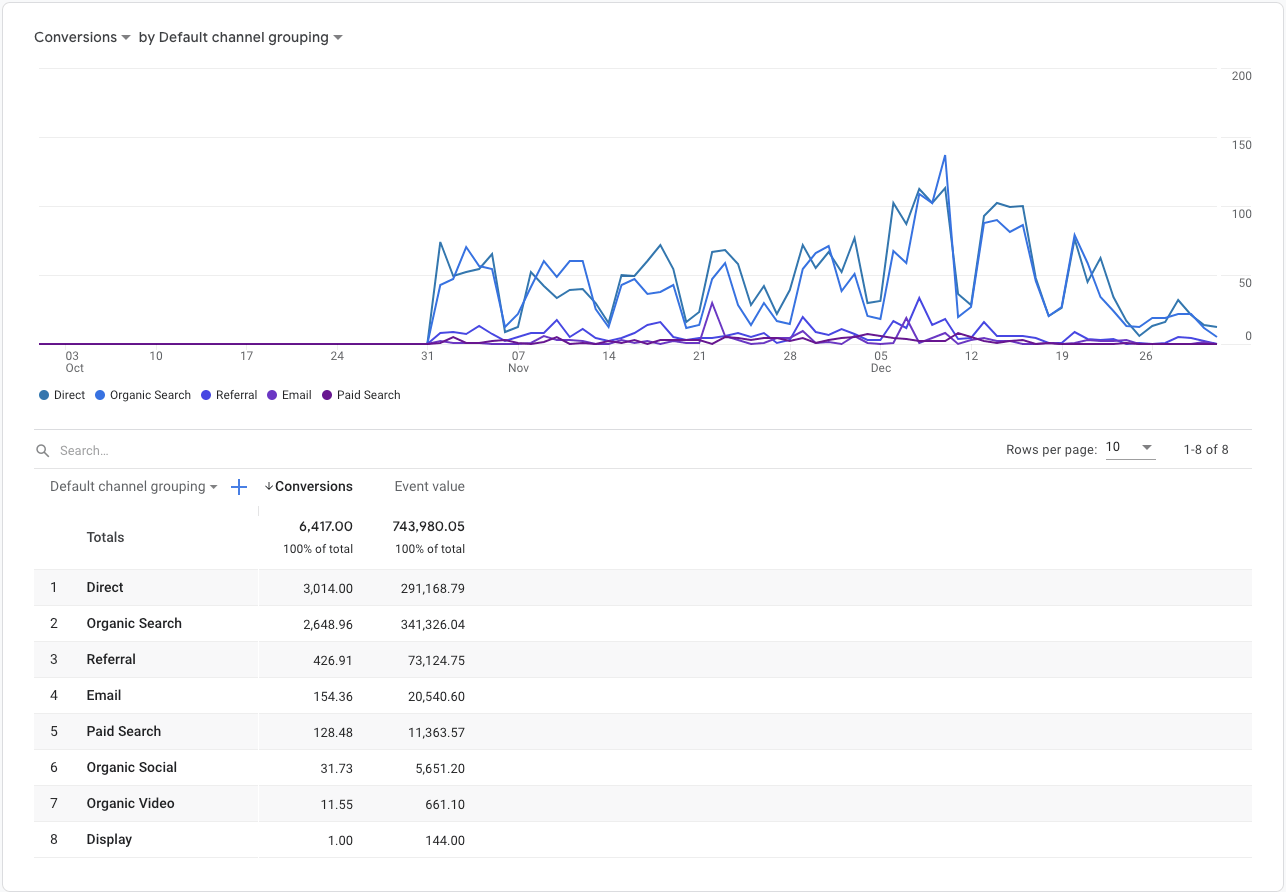
Now we can see the marketing channel where purchases came from.
Going beyond the basic metrics
The three metrics above are great for tracking your site’s growth over time, but they don’t tell you much beyond that.
If you want to know more about who’s visiting your site, how they’re interacting with it, and what you can do to improve performance, you’ll need to analyze other metrics in the context of what you’re trying to achieve.
Let’s look at a few of these metrics and how they can be useful.
1. New and returning visitors
By viewing new and returning users, you can understand which channels bring in the most engaged users and if your customers are more likely to convert on their first visit or return visits.
A new user is someone who visits your website for the first time. GA tracks this by looking at whether someone has a User ID or a Device ID from your site/app. If they don’t, they’re counted as a new user.
It is important to analyze new users because knowing where they come from can help improve inbound marketing efforts and conversion funnels.
Looking at returning users is important because it can help you better understand which products or content pages bring your customers back.
To view new and returning users, open the Life cycle > Retention report in GA4 and set a comparison date range. The report will automatically display new users, and you can toggle to see returning users.
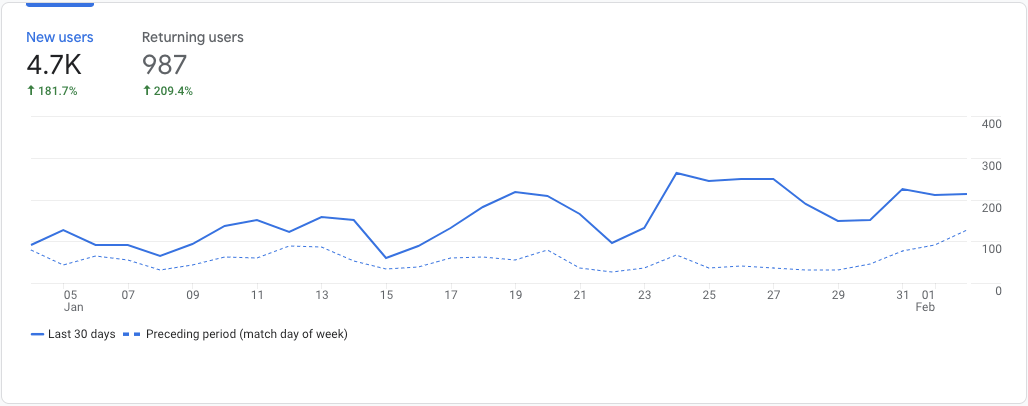
In the above example, we can see New users increased by 181.7% compared to the preceding period.
For a more robust report, we need to open the Audience > Behavior > New vs Returning report in UA.
The UA report will show you acquisition, behavior, and conversion metrics by user type: new and returning visitors.
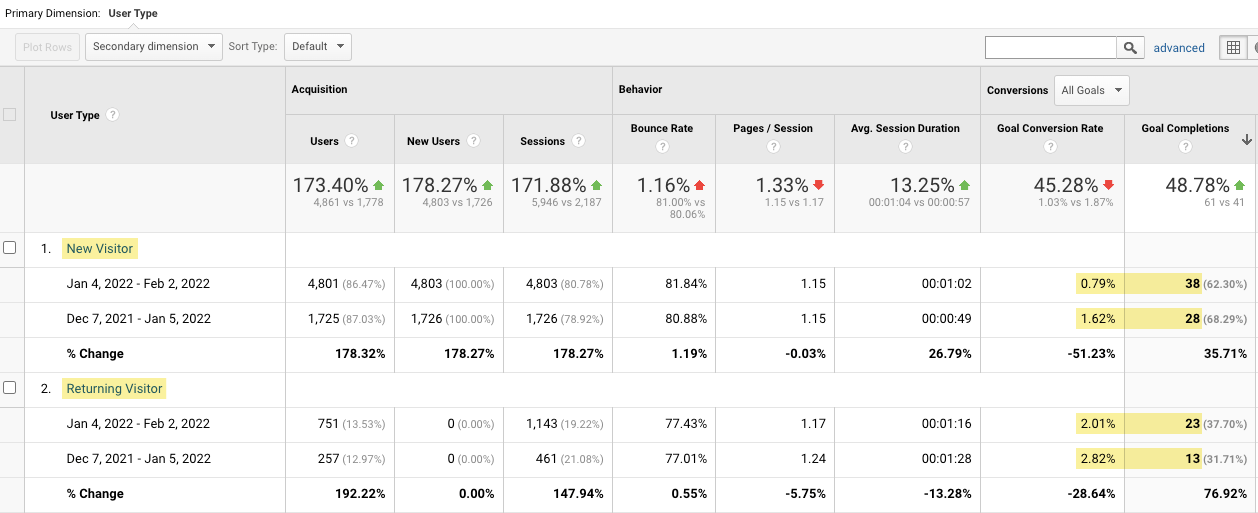
In the above report, we see more conversions come from new visitors, but returning visitors convert at a higher rate.
From here, we can segment to Organic traffic and add a secondary dimension: landing page. This will allow us to see which organic landing pages new users are converting on.
We may find patterns in the content that converts and identify pages to A/B test CTAs (call to actions) on.
2. Events
Events provide insight into what users are doing on the site. This information can be used to better inform A/B testing.
To view user event metrics, open Life cycle > Engagement > Events report in GA4. The report will show the automatically collected events and any enhanced measurement events you added.
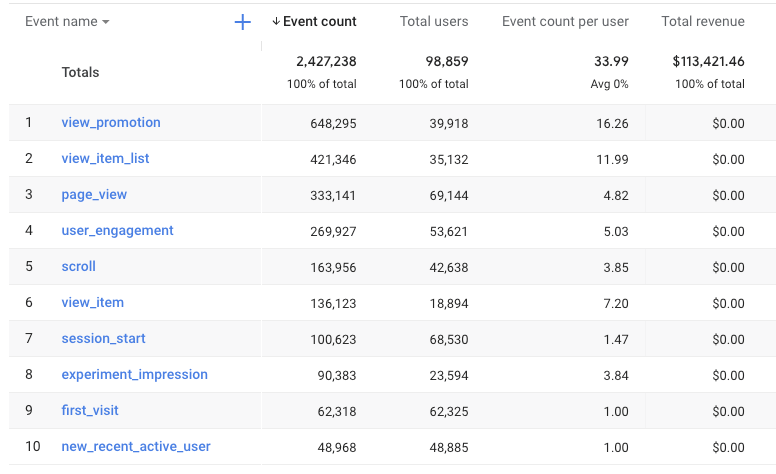
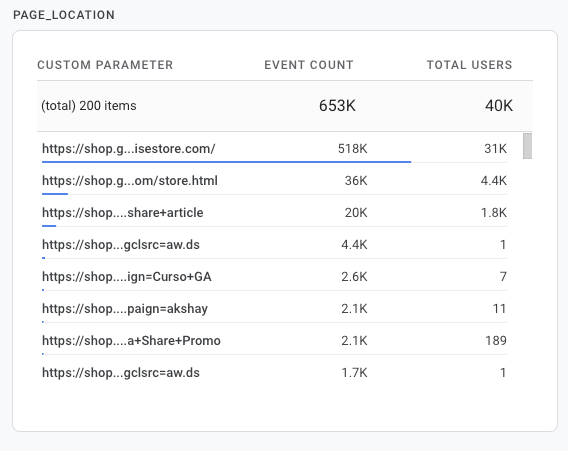
Right now, the information available in GA4 is limited. We can click on the event name to see event count by country, sessions, and page location. But we cannot open the Page Location tile to get anything useful from the data.
For a more robust report, use UA. The UA report can display revenue, transactions, and eCommerce Conversion rate data by event label. Here’s how to do it.
Open UA. Click on Behavior > Events > Top events report. You will see a table of all your event categories. Event categories will depend on how event buckets are set up in Google Tag Manager (GTM).
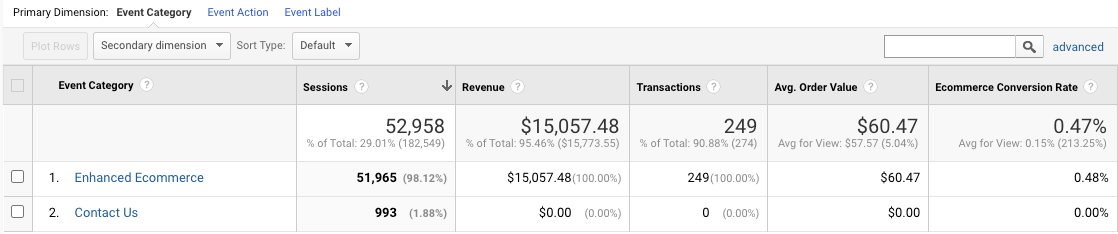
For this example, we will select the Enhanced Ecommerce event category. Now we see event actions. Event Action is going to tell us what the user did.
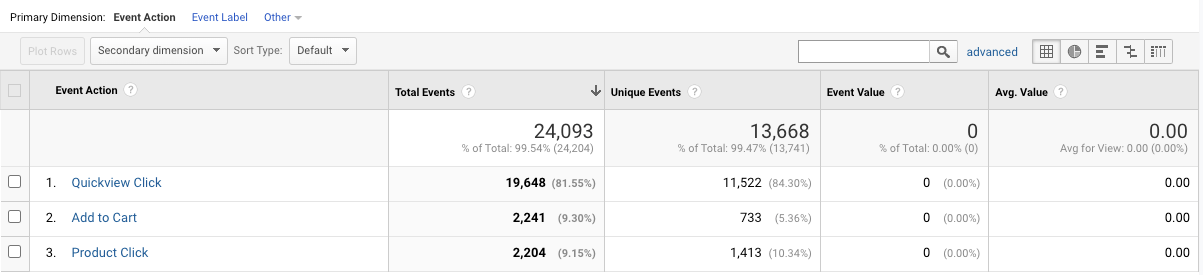
In this example, we will click on “Quickview Click” because we want to know all the different products users selected as a “quick view.”
One more step, find the tab labeled Explorer above the events graph and below the segment All Users, then click Ecommerce.
Now our table is pulling in our product pages that have triggered the “quick view” event and displaying the eCommerce conversion rate for these specific product pages.
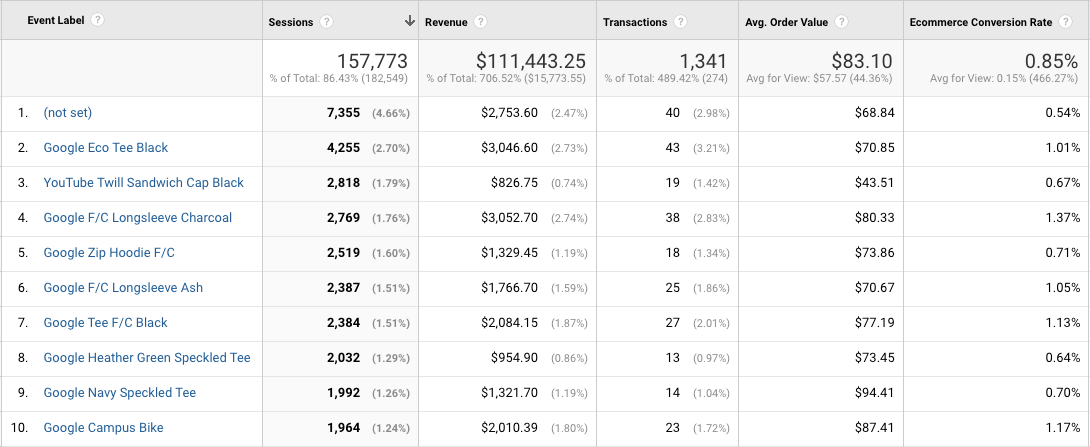
Here is where the analysis really begins. We can start to understand how user behavior is helping or hurting conversions and ultimately define some A/B tests.
3. Pageviews
Pageviews tell us the number of times a specific webpage was viewed, which by itself isn’t very helpful. But when segmented by a marketing channel, it can tell us how to improve performance.
To view pageviews, open Life cycle > Engagement > Pages and screens report. Filter the report to a source/medium like google/organic by clicking “Add comparison” and selecting a session source/medium dimension with a value of google/organic.
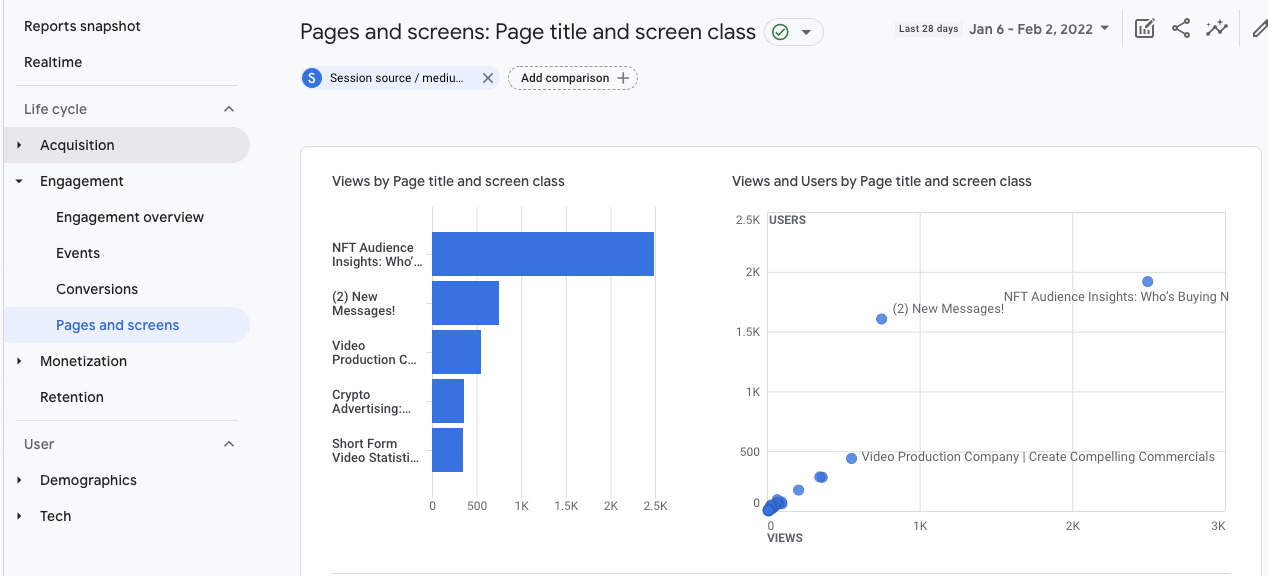
Scroll down and take a look at the page title table. You will see views and engagement metrics like average engagement time and unique user scrolls here.
If there are a lot of pageviews but the average engagement time or scroll depth is low, then it may not be the content people were expecting. Try rewriting the introduction found in these articles to grab the readers’ attention.
In the case of google/organic, you may want to investigate how well pages with high pageviews are performing in organic search for their target keywords.
If they’re in positions #2-10, you can get way more traffic just by ranking a few positions higher—so that may be a good focus. Of course, you can check ranking positions by plugging the URL into Ahrefs’ Rank Tracker.
Final thoughts
GA can quickly become confusing because there are so many numbers and so much technical jargon.
But for tracking success, you only need to focus on the handful of important metrics shared in this article: users, engagement, and conversions.
Got questions? Ping me on Twitter.