Ups and downs, peaks and troughs.
If we’re doing our job properly, we generally expect traffic to trend upwards over time, but in any given month, it’s difficult to say whether a peak or a trough is worth paying attention to.
Did we do something great and trigger a new phase of growth? Did we benefit from a new Google update? Or is it just normal variation, part of the natural ebb and flow of people finding our website?
Or suppose you make a change to your content process—you pruned and redirected a bunch of old content—and then traffic dropped the next month. Was that drop caused by the change, or was it just a coincidence?
I’ve been experimenting with a simple statistical tool designed to help answer these questions: XmR charts, also known as process control charts.
All of these XmR charts were generated using Xmrit by Cedric Chin.
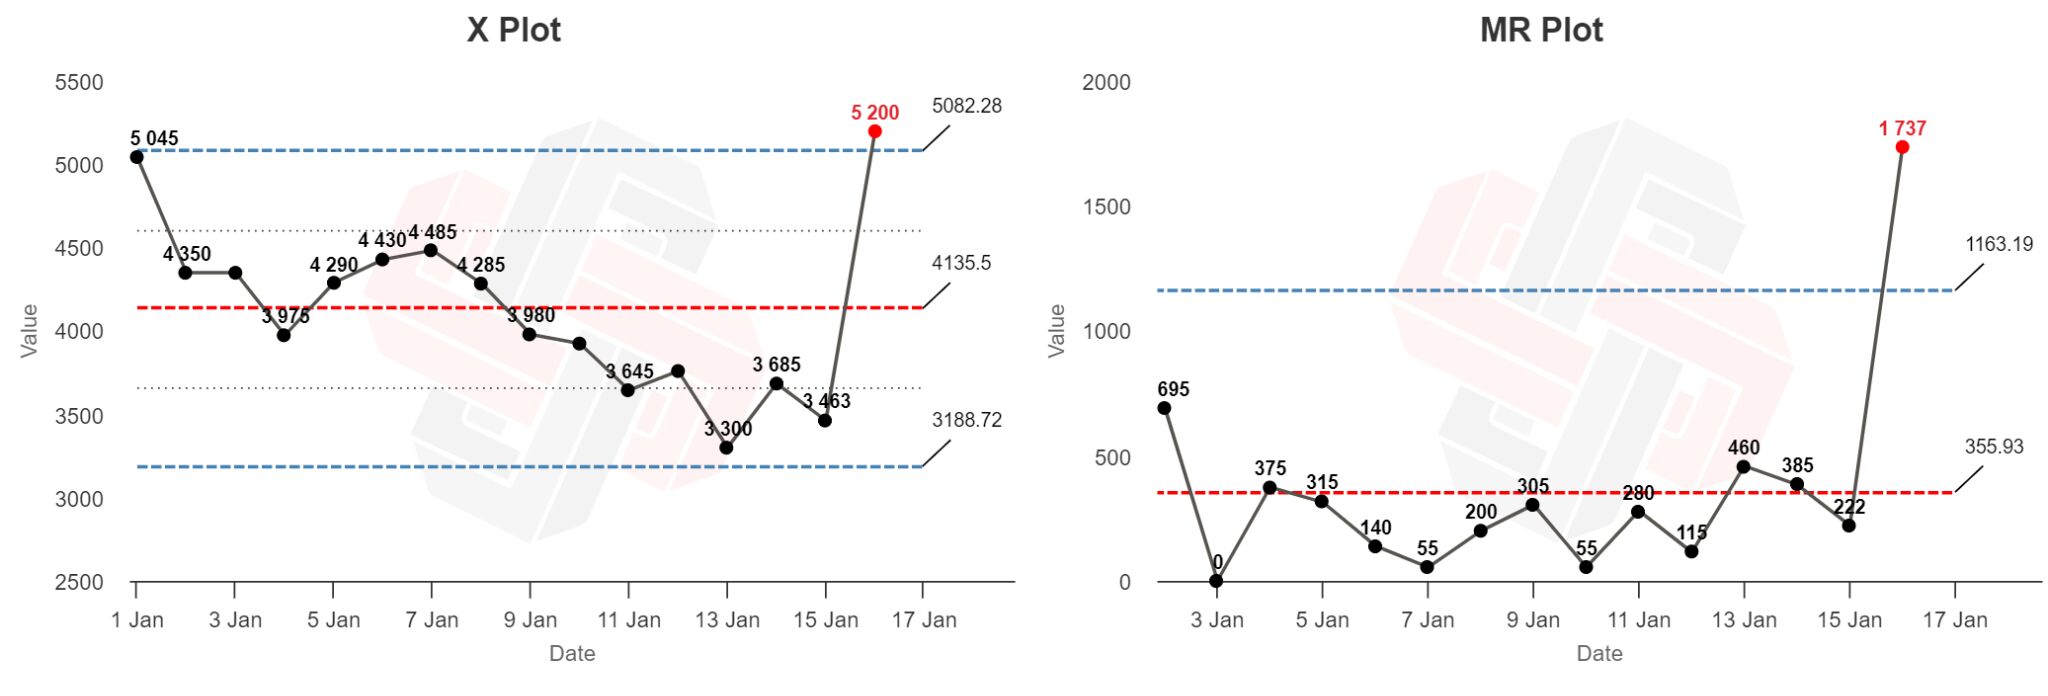
Here’s an XmR chart:
XmR charts are designed to tell you whether any single data point from a time series is likely to be caused by normal fluctuation (“routine variation”) or a sign that something happened and needs to be investigated (“exceptional variation”).
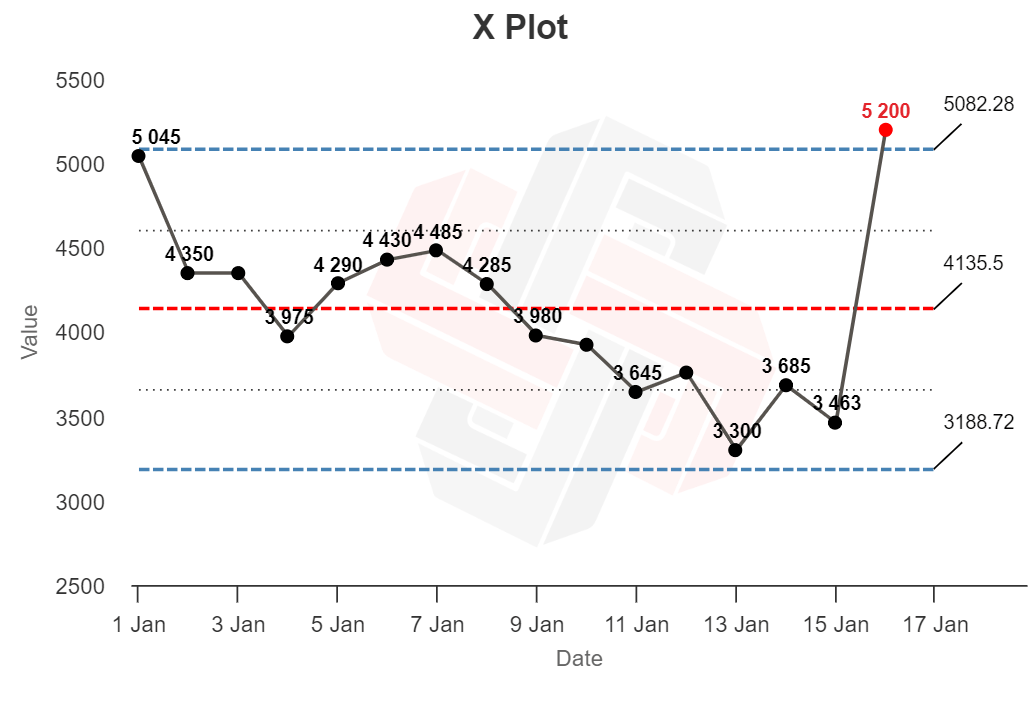
XmR charts consist of an X plot (named after the x-value, the “thing” we care about—like widgets produced or sales closed)…
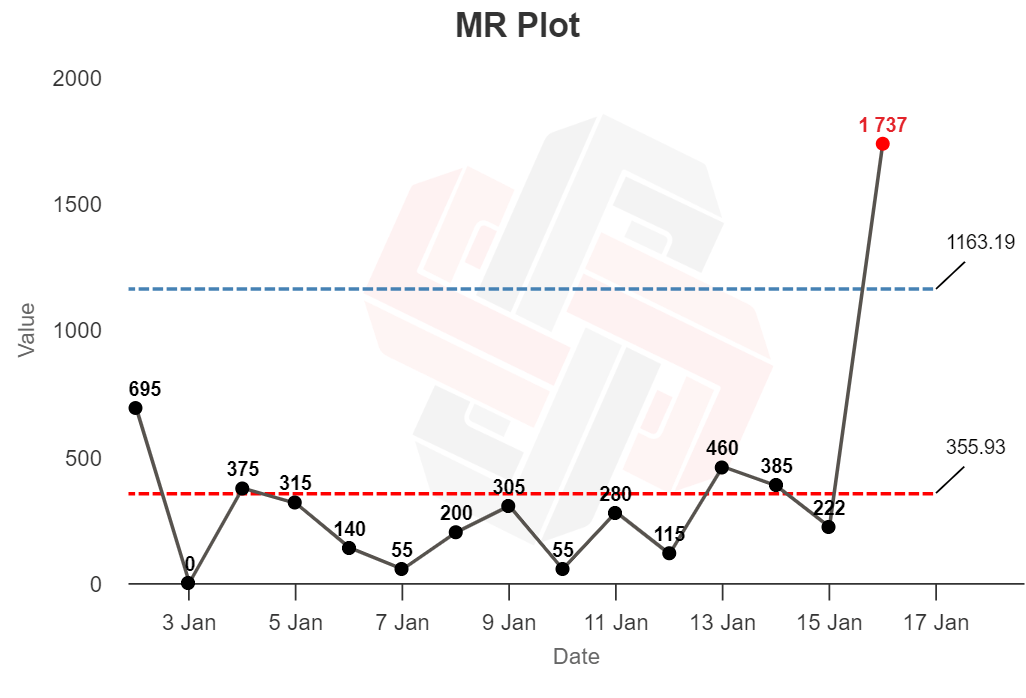
…and an MR plot (named after the moving range, basically the “gap” between each data point):
In its simplest use, if you plot your data on the chart and it wiggles up and down around the central line, without crossing the upper and lower bounds—no problem! These ups and downs likely represent normal variation.
But any points that appear outside the upper or lower bounds (shown in red) should be treated as anomalies that need to be investigated.
In the X plot above, the time series seems to show routine variation until January 16th, when the first red out-of-bounds point appears.
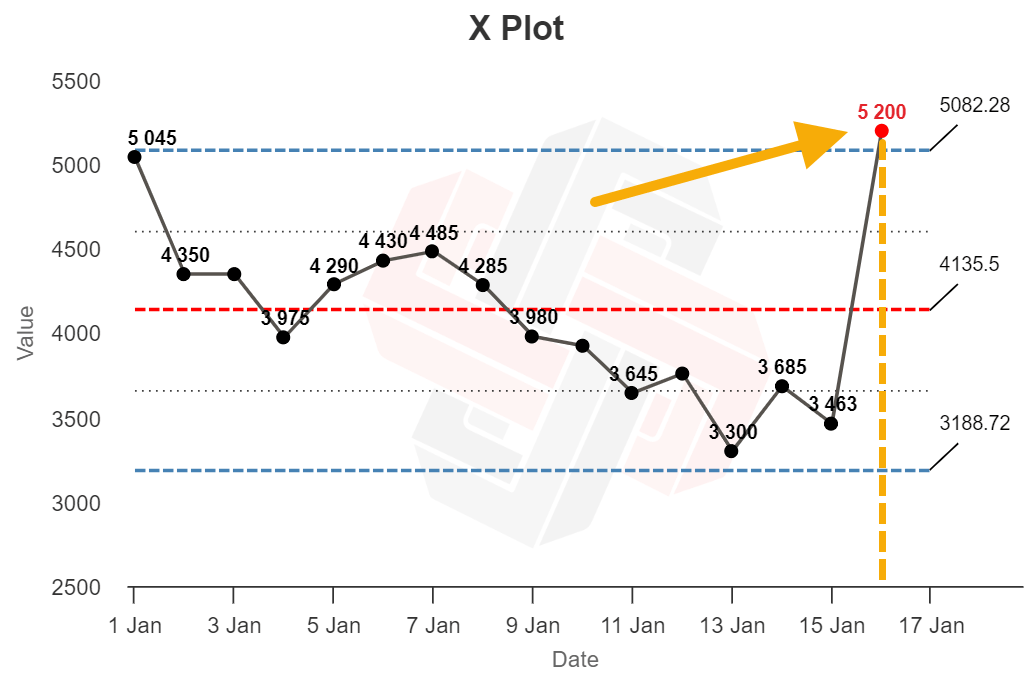
The XmR chart suggests that something happened on the 16th to mess with our production process (for better or for worse). Our job is to investigate why.
The line in the middle is the average value of the dataset; the upper and lower bounds represent 3-standard deviations away from the average (known as three-sigma). Any point that falls outside of these upper and lower bounds is very likely to be an anomaly, and not part of the original probability distribution.
There are other “signals” that the XmR chart can show you (like eight consecutive points on one side of the average line representing another type of exceptional variation)—but I will leave you to investigate those on your own time.
When I started reading about XmR charts, one obvious use came to mind: identifying the impact of Google algorithm updates.
If a site’s traffic tanks to zero, it’s easy to say “we were hit by a manual penalty.” But for smaller changes, like a few months’ consecutive traffic decline, it’s harder to work out the cause. Did we get caught out by a Google update? Is it seasonality? Or is it just a coincidence, with traffic likely to return to normal in the future?
Here’s two years of monthly organic traffic data for the Ahrefs blog, pulled from Site Explorer and plotted on an XmR chart:
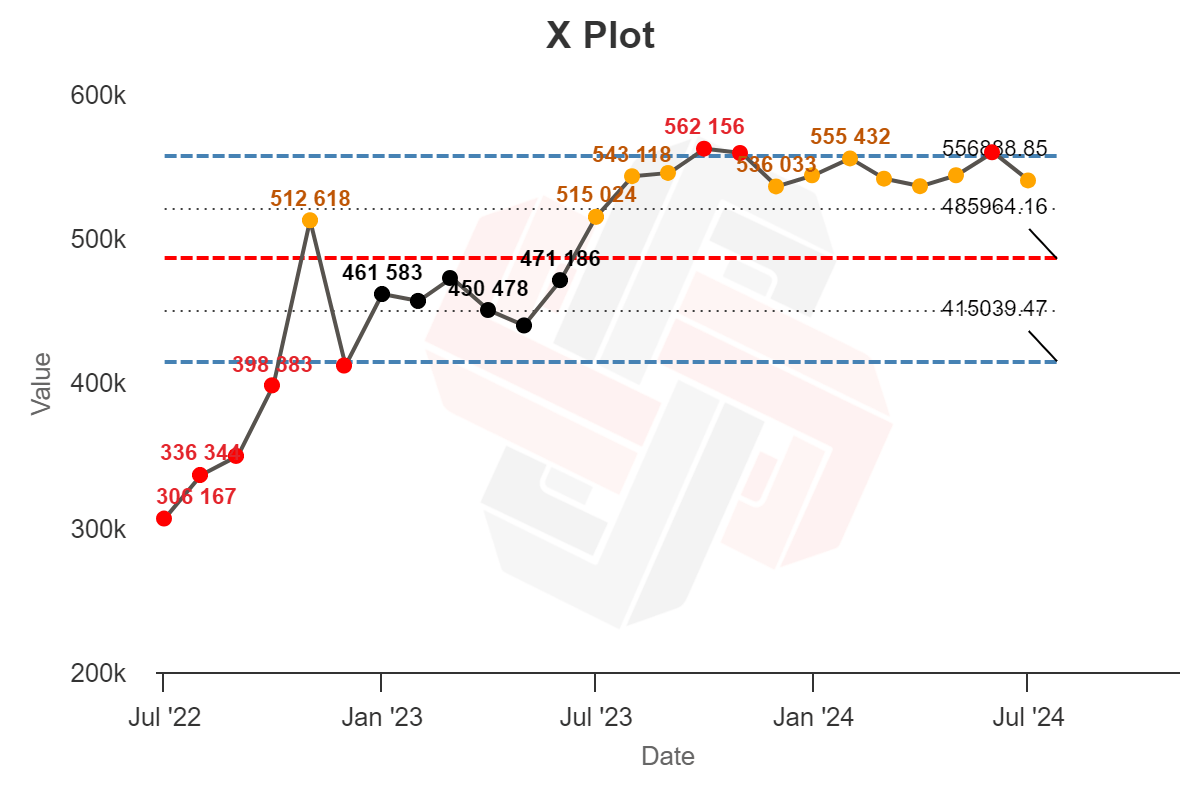
Now… this is not particularly useful.
There are tons of data points outside the expected range (red), with very few sitting nearer the center line than the quartile limits (orange).
The XmR chart is supposed to show exceptional variation in a consistent process—but in this image, almost all of the data points suggest exceptional variation. What gives?
Process charts were designed around simple manufacturing processes, and they work very well when the expected output of a process is constant.
If your goal is manufacturing 10,000 widgets each and every week, an XmR chart will help you work out if that 5,600-widget month was a normal “blip” in routine operation, or caused by a real problem that needs to be investigated.
Website traffic is more complicated. There are tons of variables that impact traffic:
- the fluctuating search volume of each topic,
- individual ranking positions,
- new competing articles,
- search features,
- seasonality,
- publishing frequency,
- Google algorithm updates…
That means that running an XmR analysis on a long series of traffic data probably won’t be very helpful. Your “blogging process” is not likely to remain stable for very long.
In my case, this particular two-year snapshot of data probably doesn’t come from a single, stable process—there may be multiple probability distributions hidden in there.
But we can make the analysis more useful.
The best practice for XmR charts is to limit the analysis to a period of time when you know the process was relatively static, and recalculate it when you suspect something has changed.
Looking at the Moving Range chart for this data below, large amounts of traffic variance happened in November and December. We should investigate possible causes. 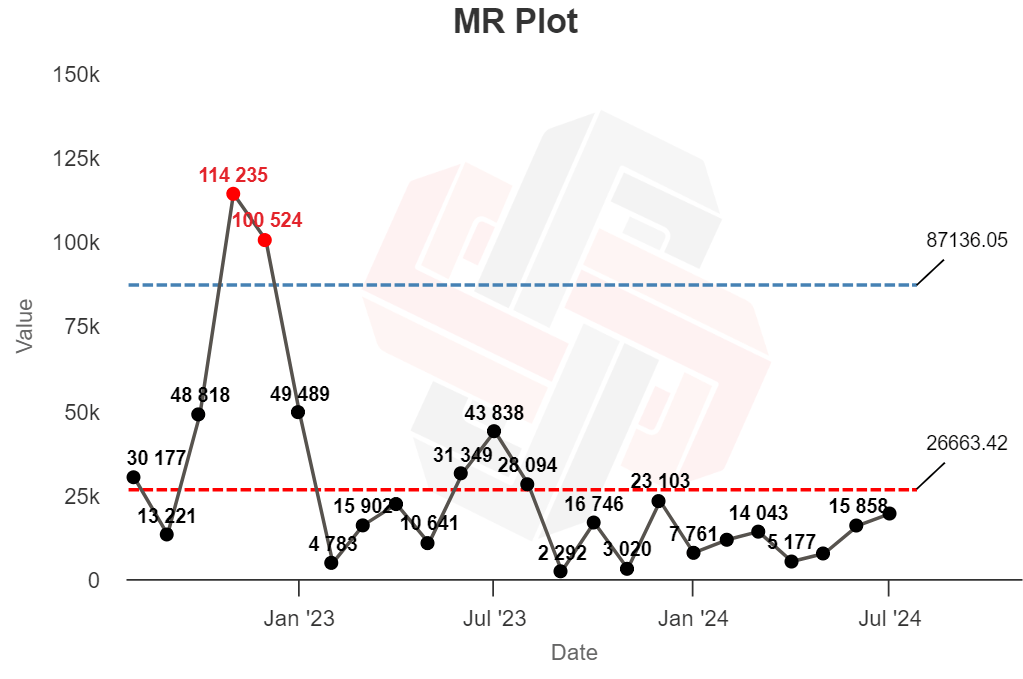
I know that our publishing frequency was fairly static (we definitely didn’t double our content output). Seasonality would cause a traffic drop, not a spike (we’re writing about SEO, not holiday gift guides).
But there was a big Google update at the start of December:
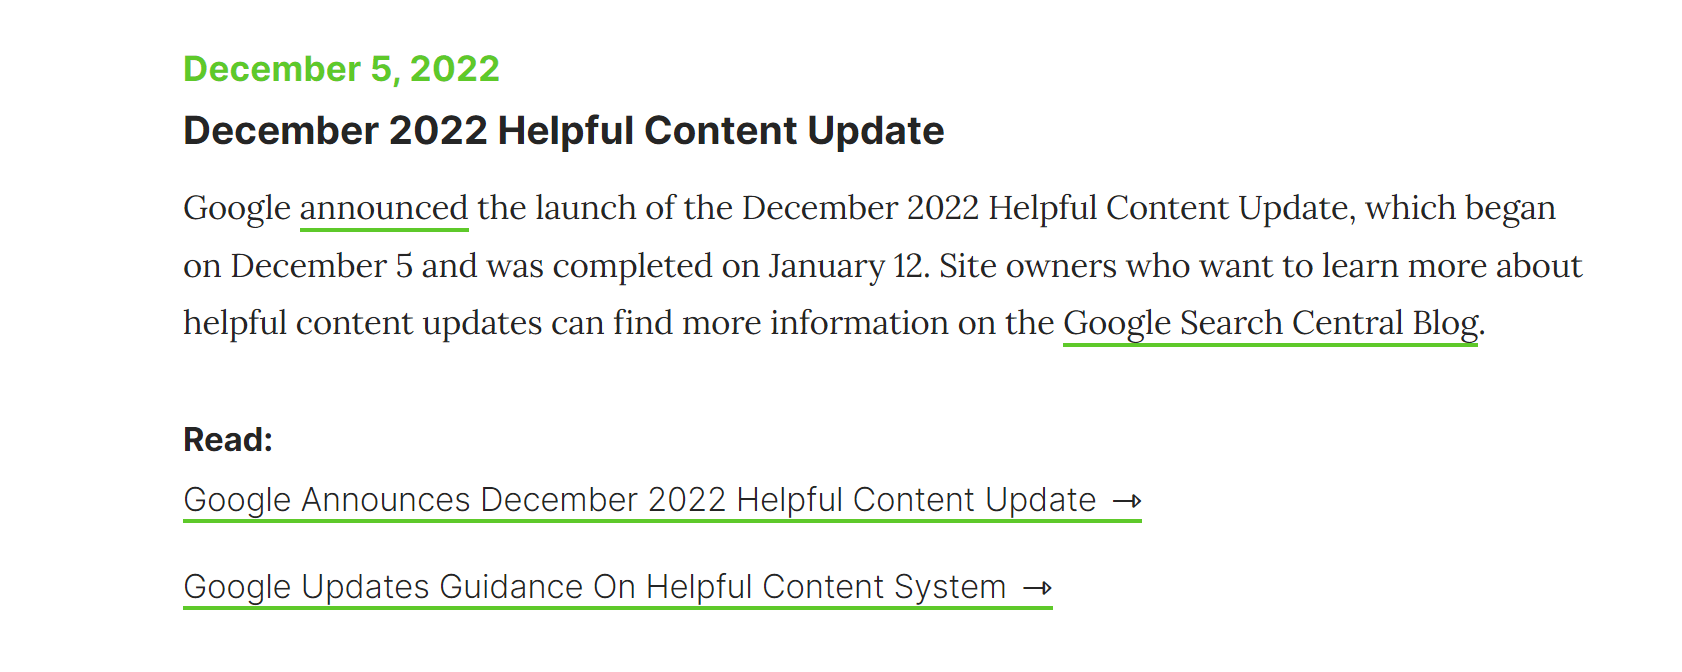
If we work on the assumption that something happened to our blog process around this time—likely a change to traffic caused by the Google update—we can add a divider to our XmR chart.
Instead of trying to analyze our traffic as a single process, we can treat it as two processes, and calculate XmR charts separately:
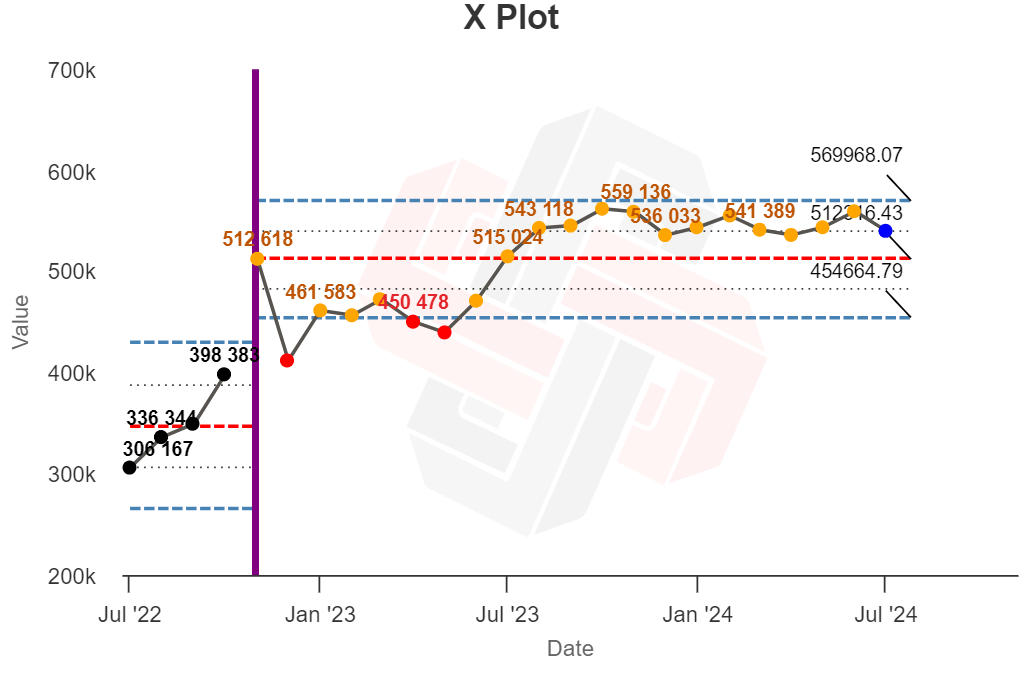
Now the first process looks stable (all black dots). The second process shows less extreme variation (red) too, but there’s still too much moderate variation (orange) to look stable. There may be another process lurking within.
And per a rule of thumb for analyzing XmR charts: “the duration of an XmR chart needs to be revisited when a ‘long-run’ of data remains above or below the Average line.” This trend begins in late summer (which is also around the time that Google announced another core update):

We can add another divider at the start of this “long-run” of data to create three separate XmR analyses:
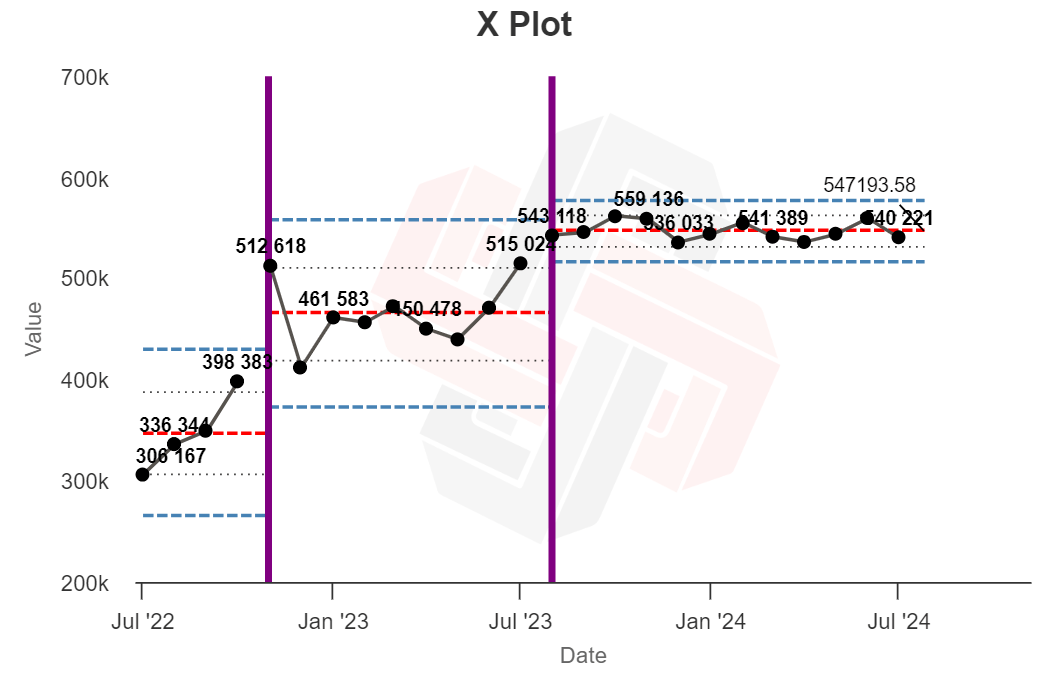
In doing so, all three analyses seem stable, with no points of extreme variance. In other words, we seem to have done a good job at capturing three distinct processes happening within our traffic data.
From this analysis, there seems to be a good chance that our traffic was impacted by external factors around the time of two major Google updates.
Now… this is basically a post-hoc data torturing exercise. We can’t infer any causation from this analysis, and it’s entirely possible that other arbitrary divisions would yield similar results.
But that’s okay. These charts can’t give you definitive, concrete reasons why your traffic changed, but they can tell you where to look, and help you work out whether troubleshooting a traffic dip or spike is a good use of your time.
The ultimate measure of a model’s usefulness is its ability to help you predict things. Will XmR charts help me do a better job running the Ahrefs blog in the future?
I think yes.
Assuming my “blog process” remains relatively stable—I publish at the same frequency, target the same topics, compete with the same competitors—I now have a set of “stable” data that I can use to provide extra context for future traffic numbers:
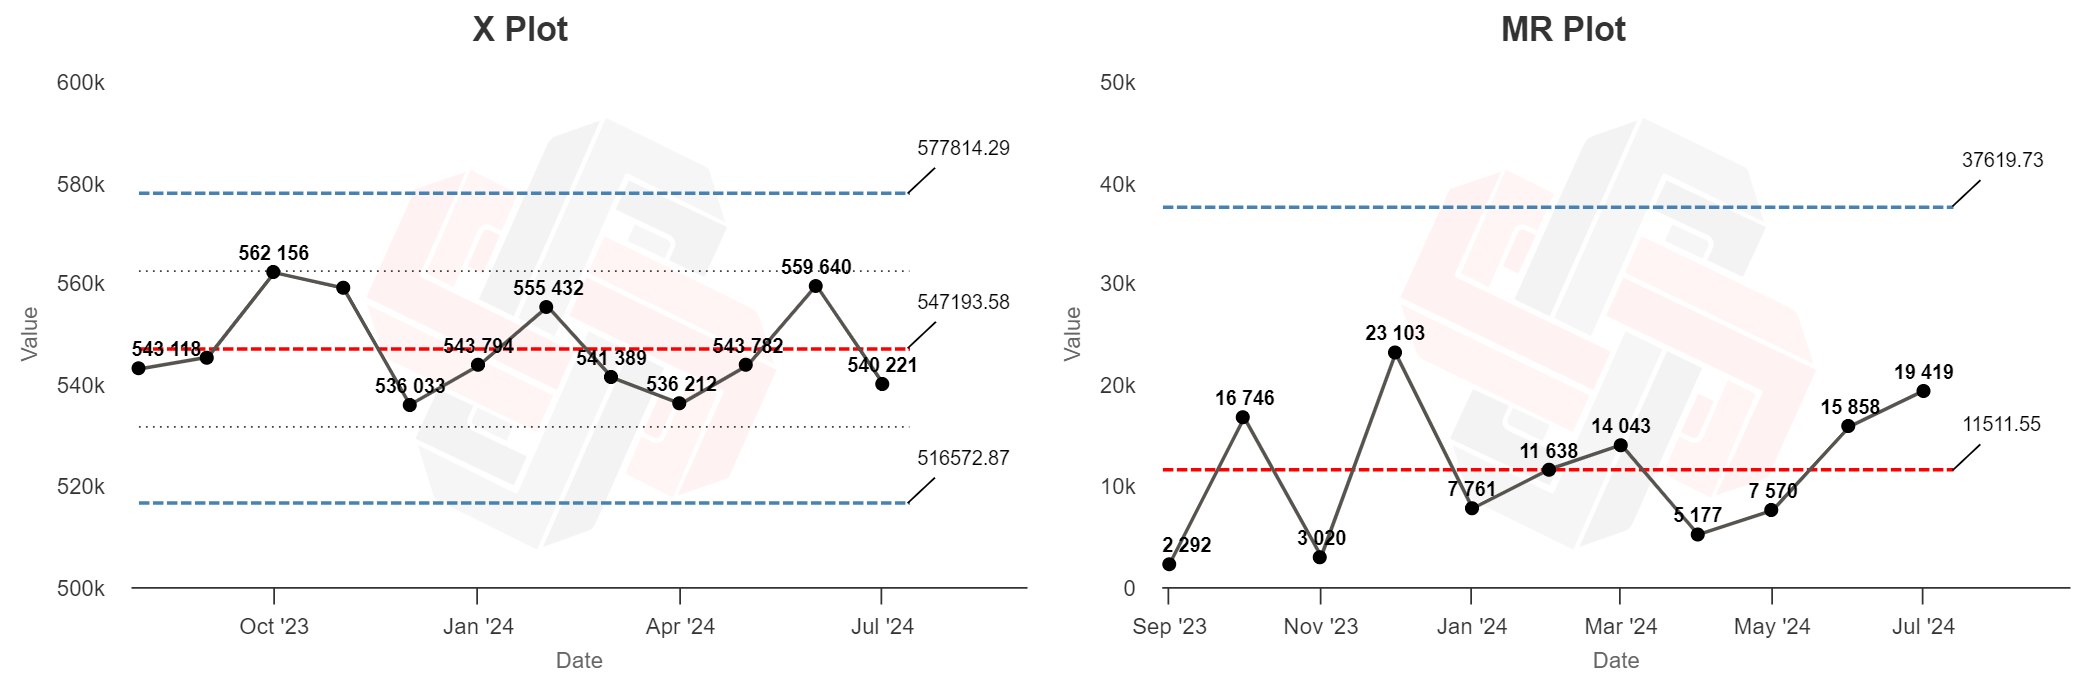
In the months that follow, I can work out whether dips or spikes in our traffic are likely the result of normal variance, or whether something has changed that requires my attention—like a Google update.
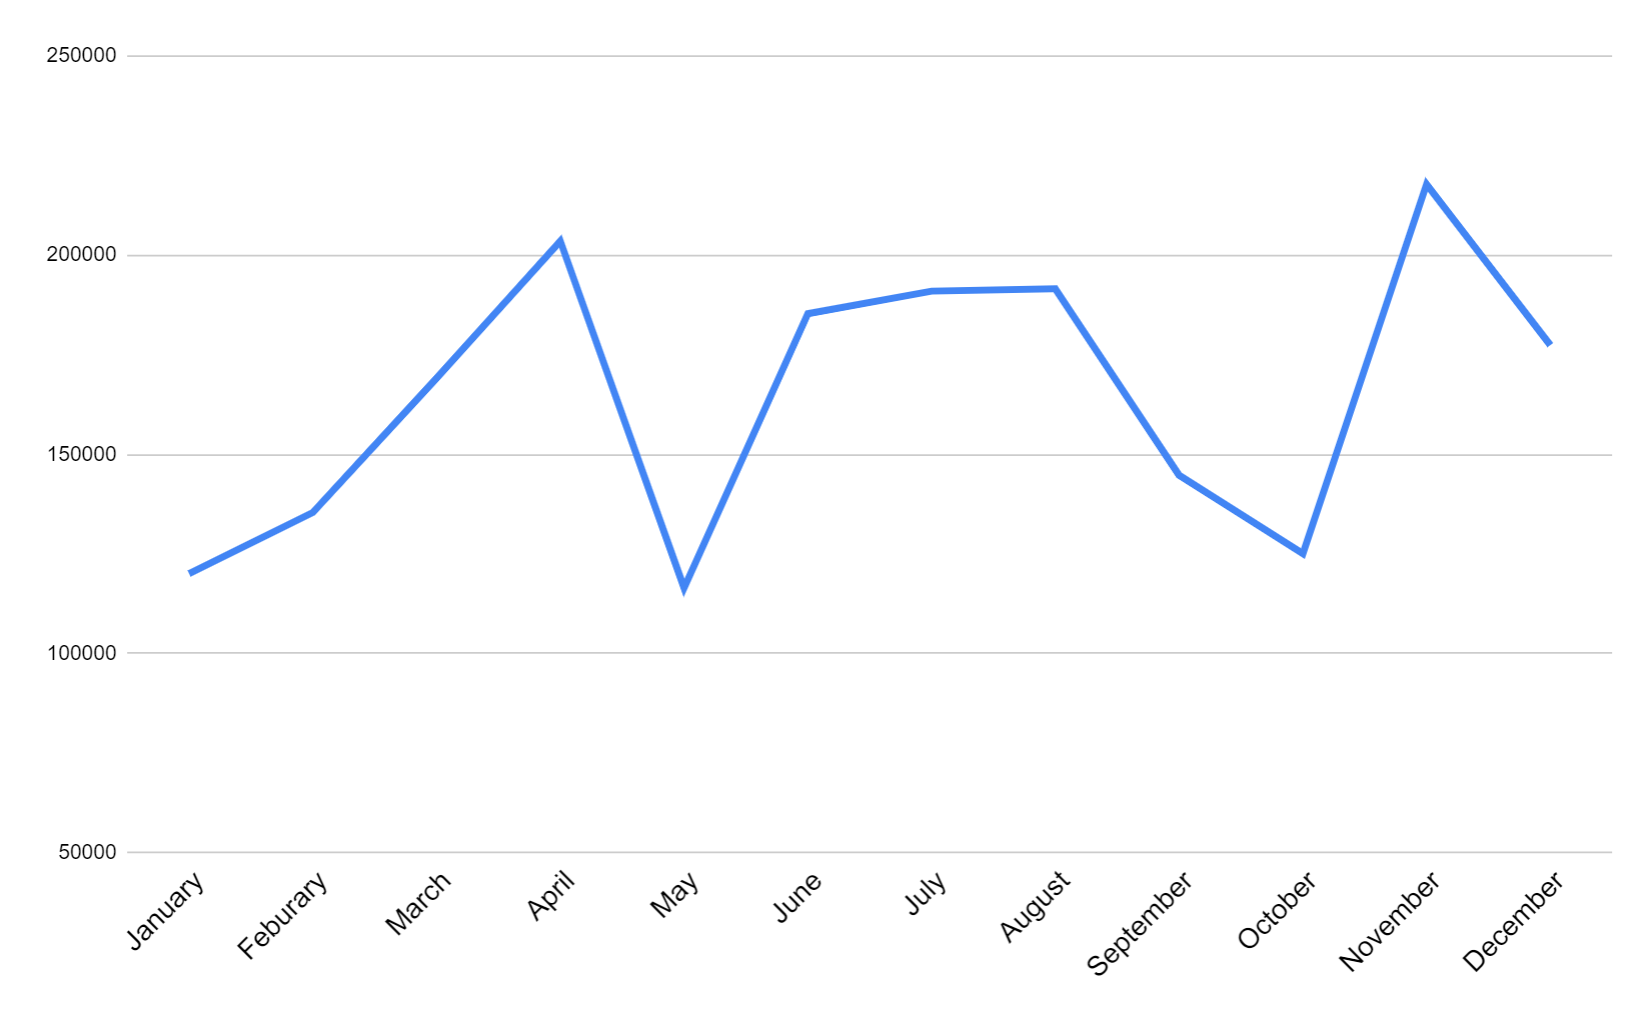
If, for example, my traffic does this next month… 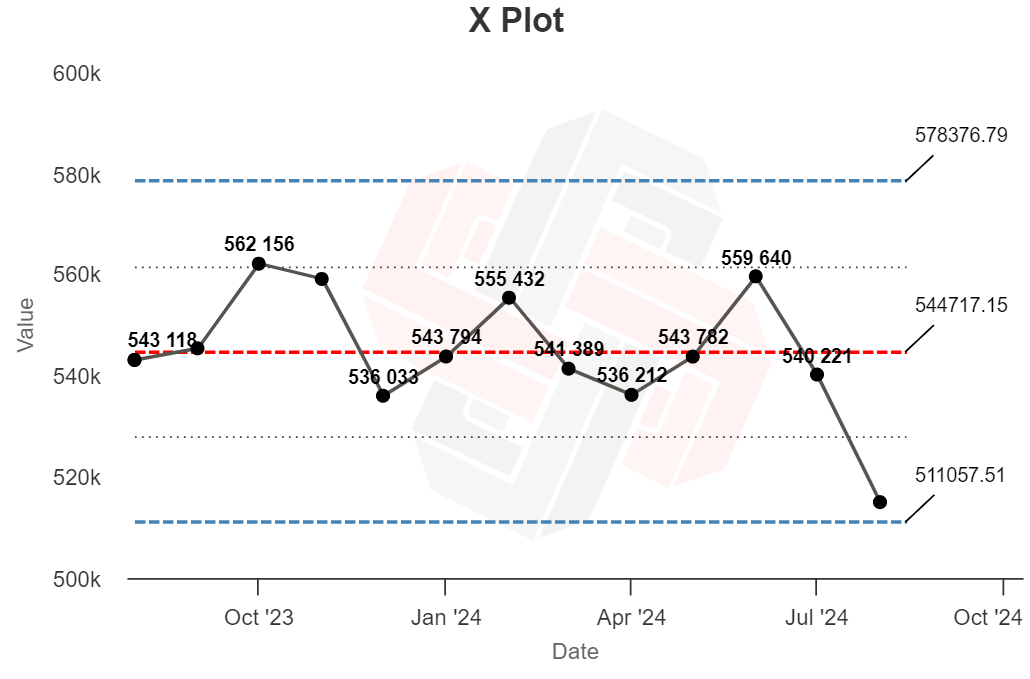
…I know that—given this distribution—that traffic drop could well be normal, unexciting variance.
But if it does this…
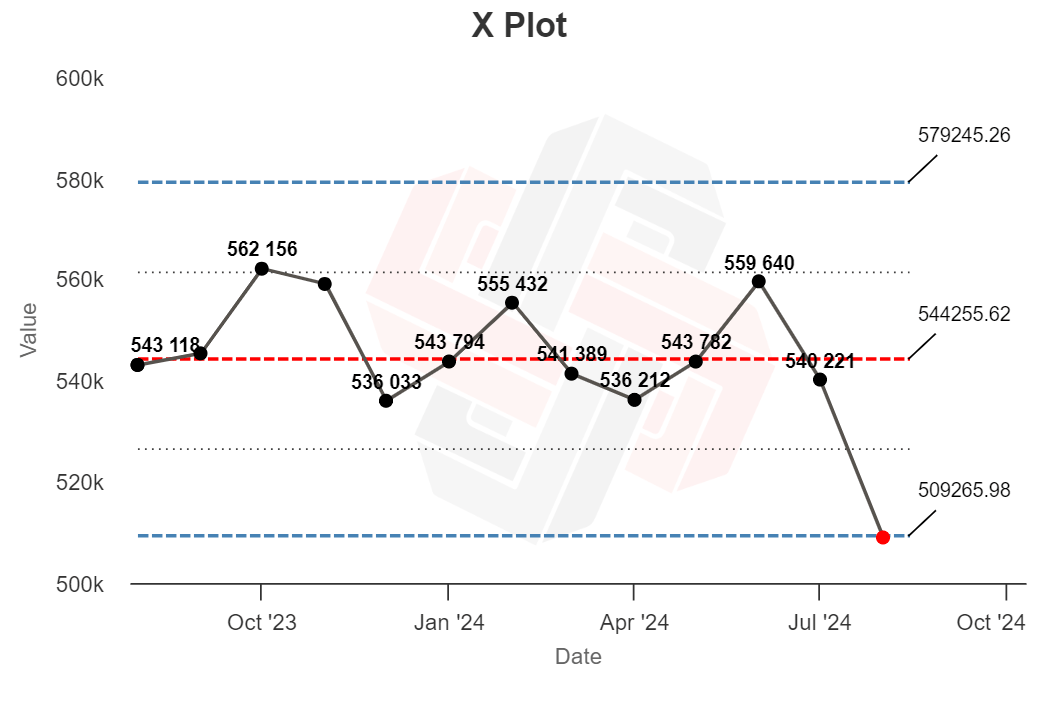
…there’s probably something else at work.
With extreme traffic changes you can usually “eyeball” traffic charts and guess what happened. But XmR charts are useful for more subtle variations, and there’s a chance I will be able to identify and act on just a single month’s worth of data. That’s pretty cool.
Final thoughts
Troubleshooting traffic changes is a big challenge for SEOs and content marketers (and we’re working on a few ways to help you identify the signal amongst the noise of your traffic data).
In the meantime, I have found XmR charts an interesting tool in my toolkit, useful for contextualizing my monthly reporting numbers and justifying when I should (or shouldn’t) spend my energy troubleshooting a down month.
(At the very least, XmR charts might just give you the confidence necessary to say “get off my back” when that VP sends you a brusque 3AM email complaining about last month’s 8% traffic dip.)