Let’s get right into it.
Portfolios
Meet Portfolios, our new view that lets you track and monitor a custom list of domains and URLs.
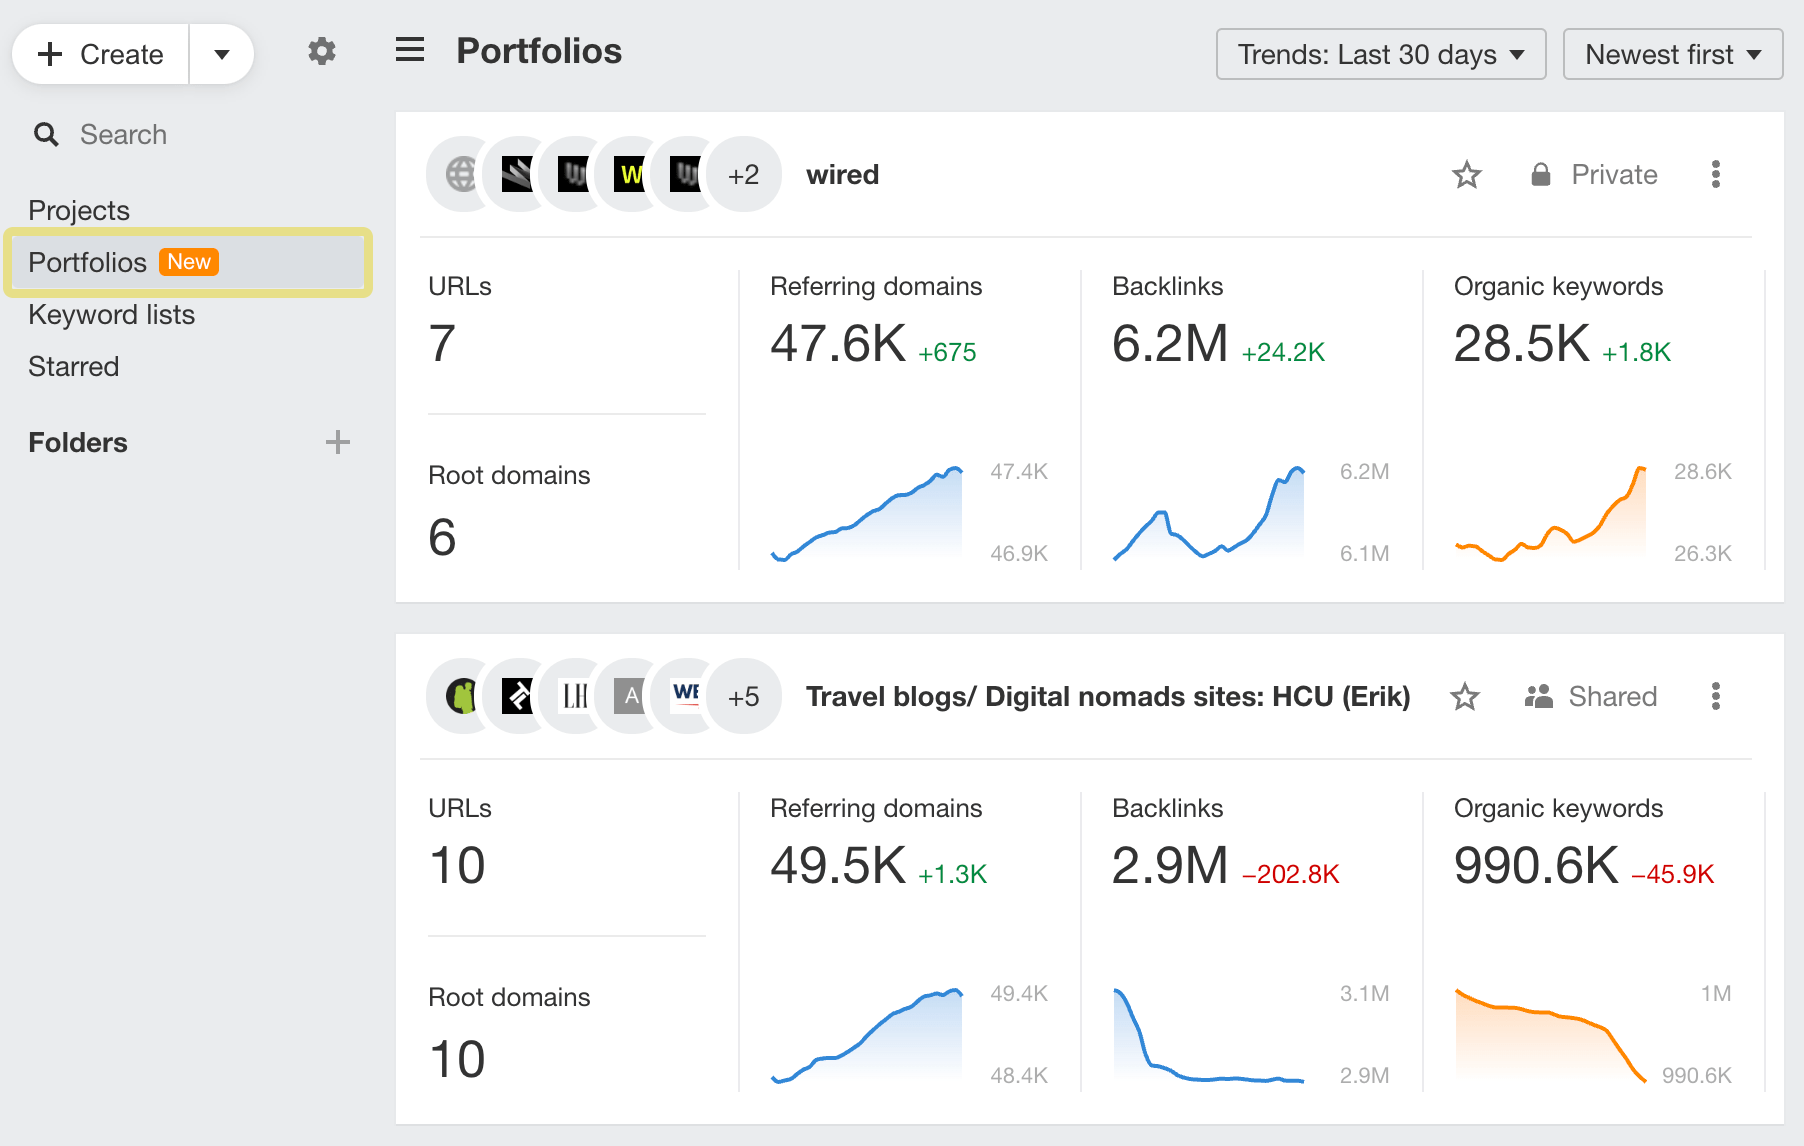
Adding a Portfolio lets you group a list of URLs from up to 10 domains and see their aggregated metrics in most Site Explorer reports. Once saved, the portfolio will show up on your dashboard along with top-level metrics – just like Projects.
Click on any metric to open the corresponding report in Site Explorer.
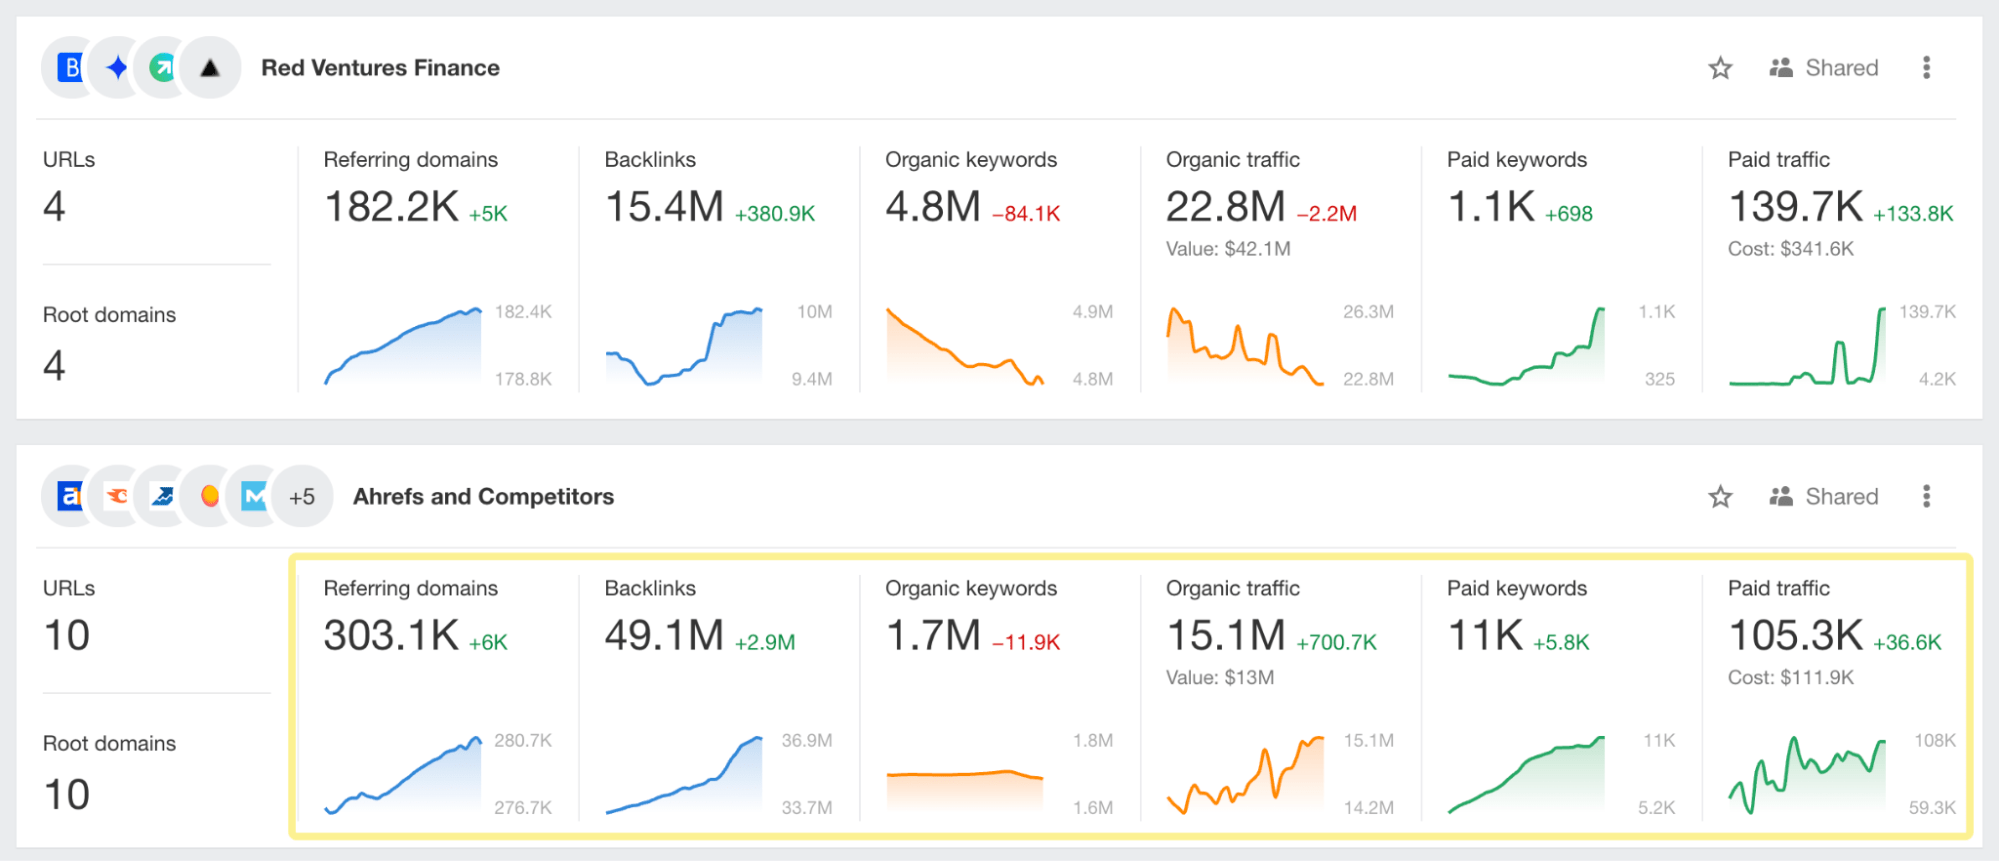
One great way to use Portfolios is to track your own portfolio of sites or URLs. For example, in this portfolio, I’m tracking all of Wired’s domains.
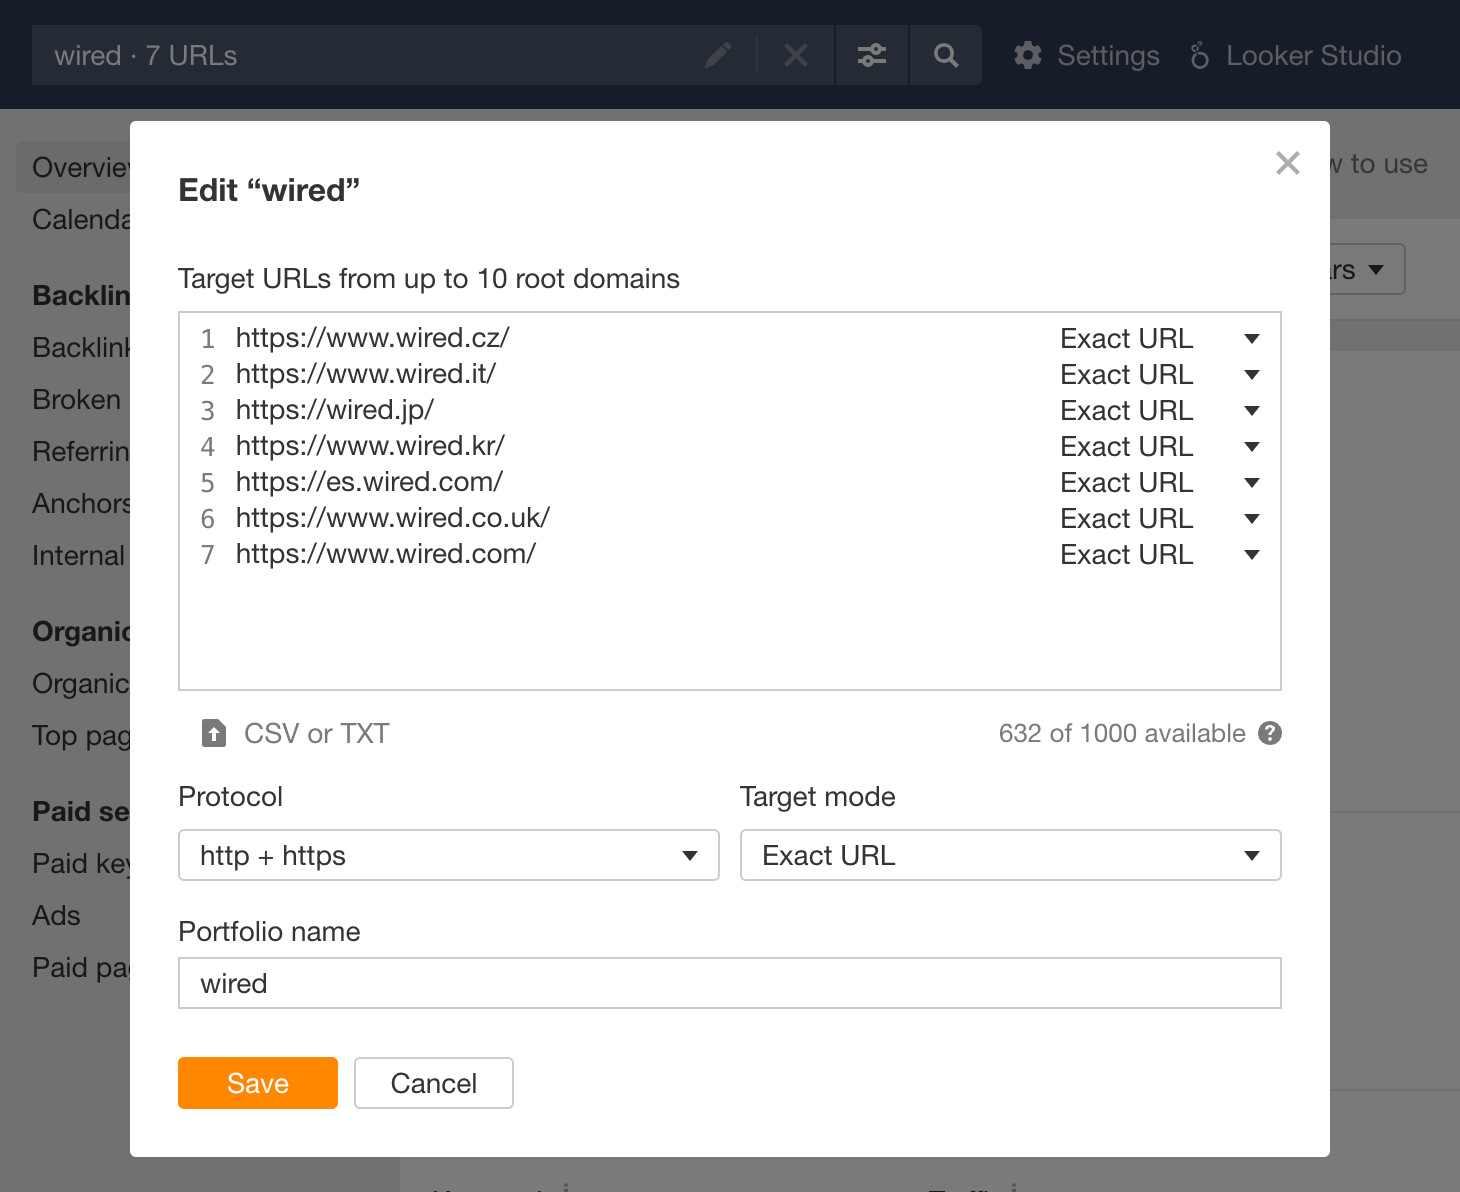
You can also use it for competitive intelligence. For example, to see your competitors’ top pages and keywords, add your competitors’ websites to a portfolio and go to the Top pages report, then add a Traffic: Improved filter.
Competitor metrics
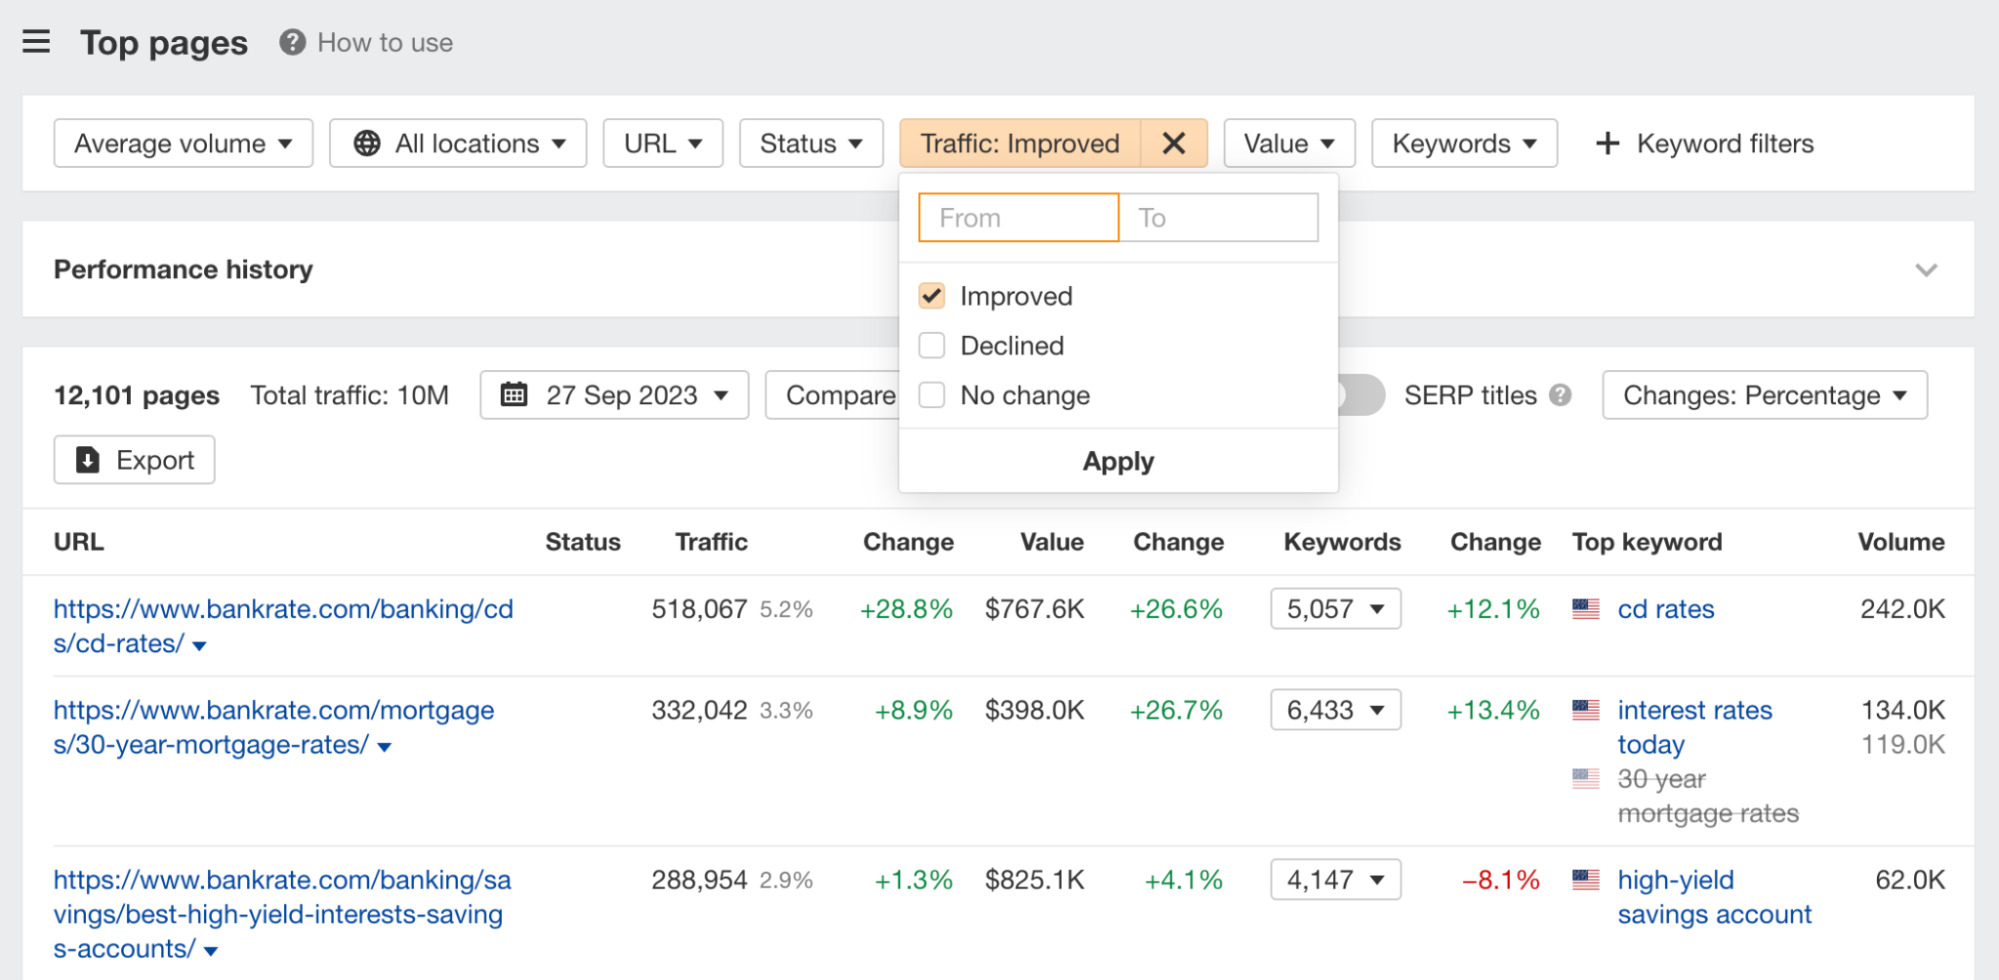
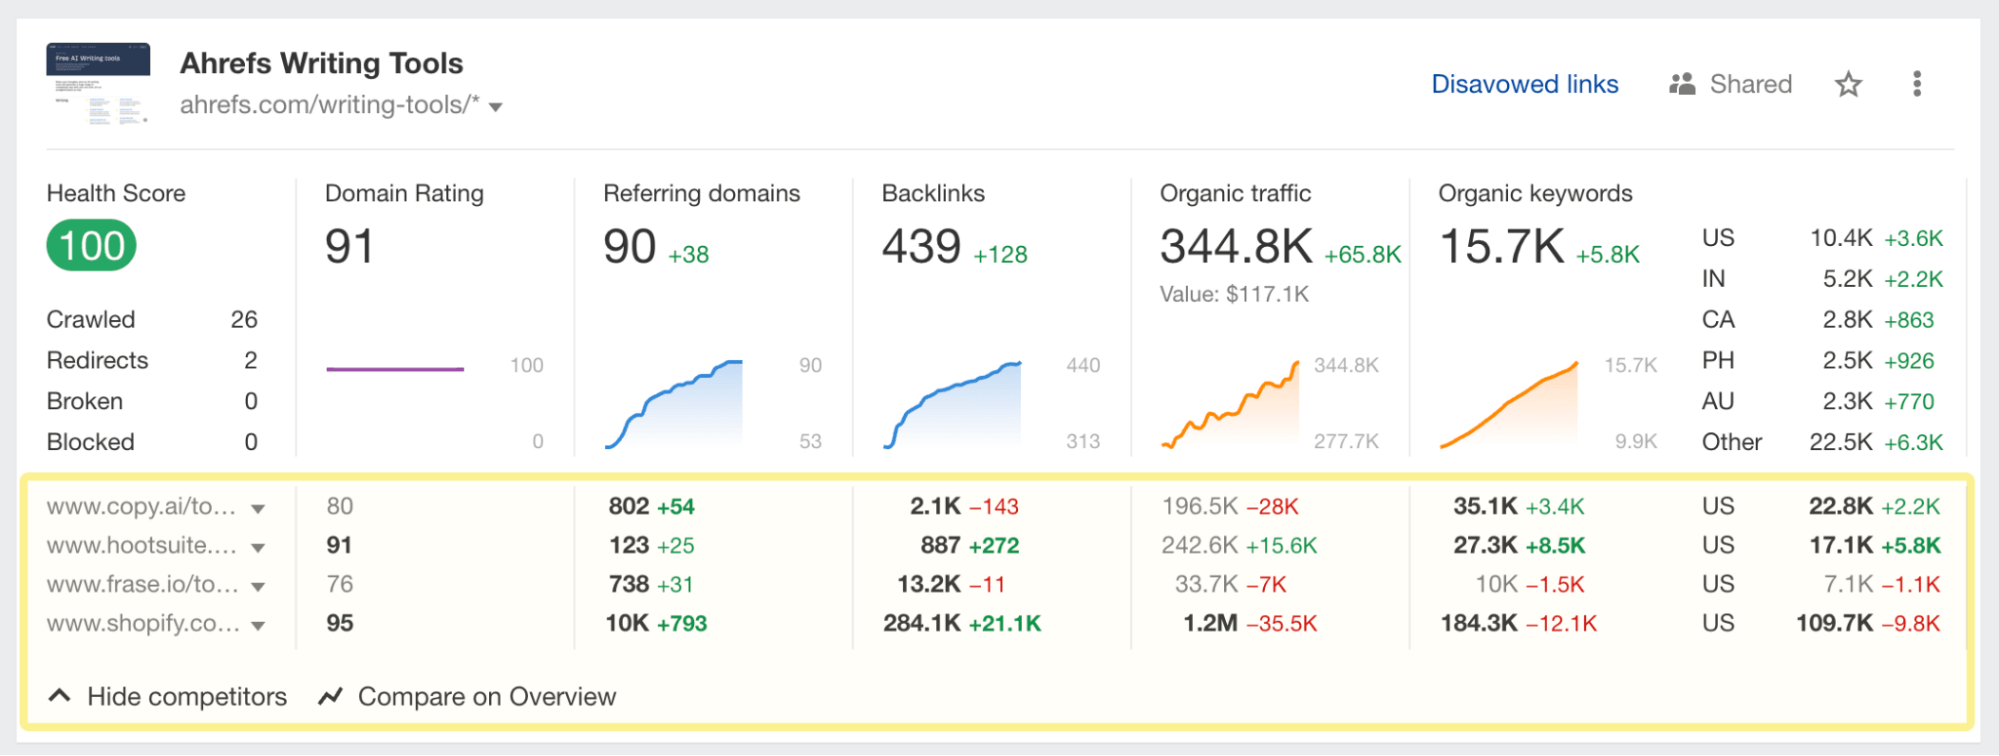
You can now see competitor metrics on your dashboard. Just click on “Show competitors” at the bottom of any project to expand the list of competitors added to the project.
The bolded metrics and deltas exceed the values of the main target.
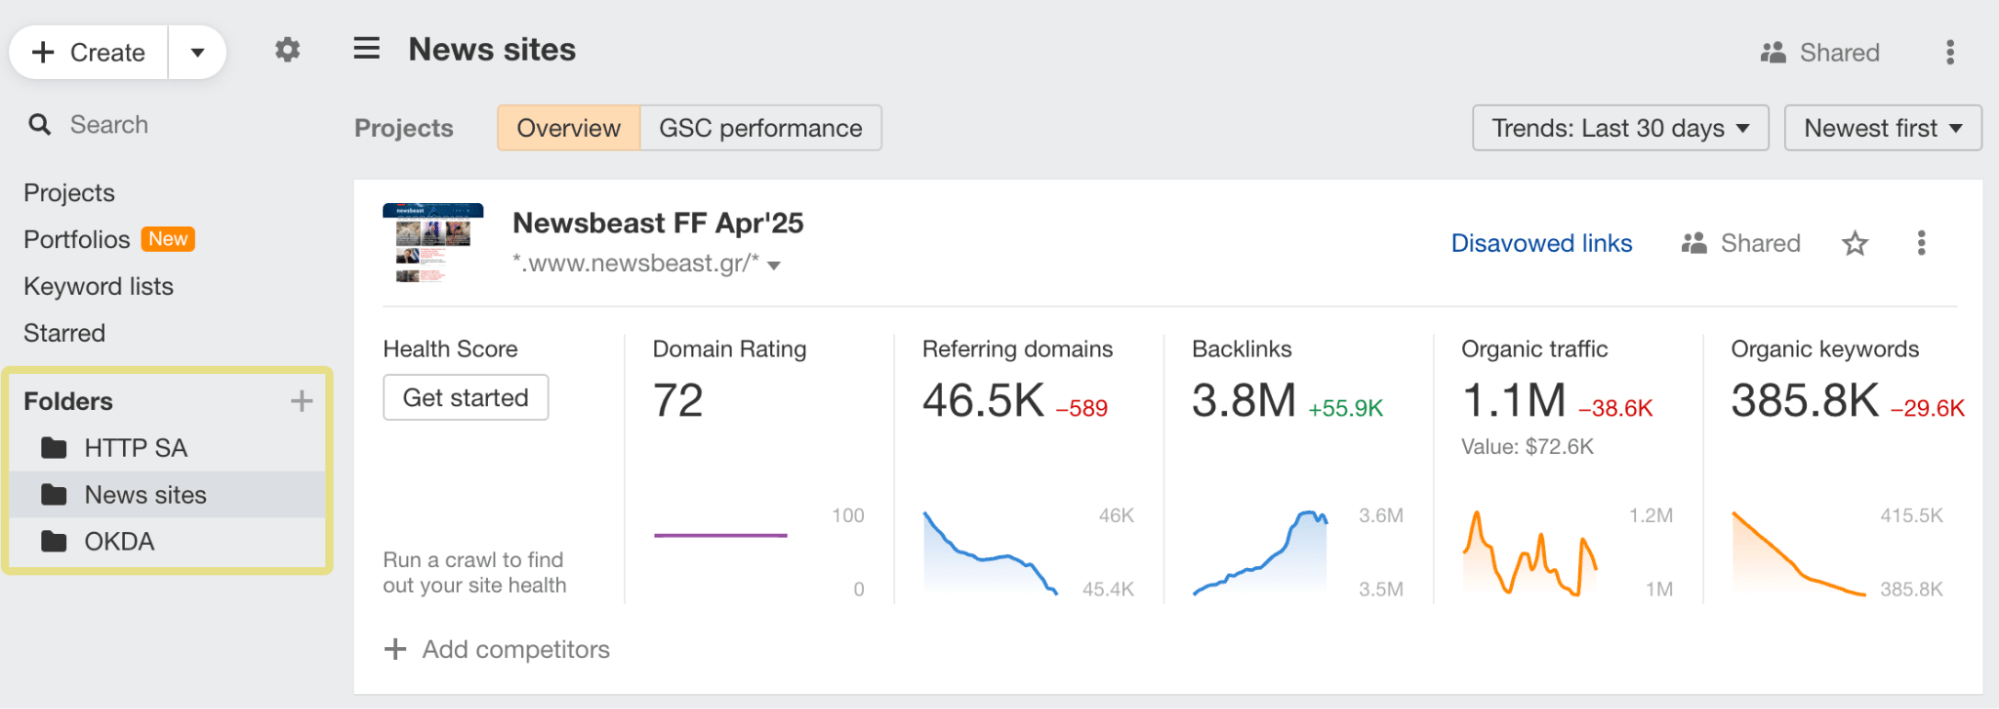
Folders available on all new paid plans
Dashboard folders are available on all new paid plans. You can now create folders and organize your projects, portfolios, and keyword lists.
Page inspect tool
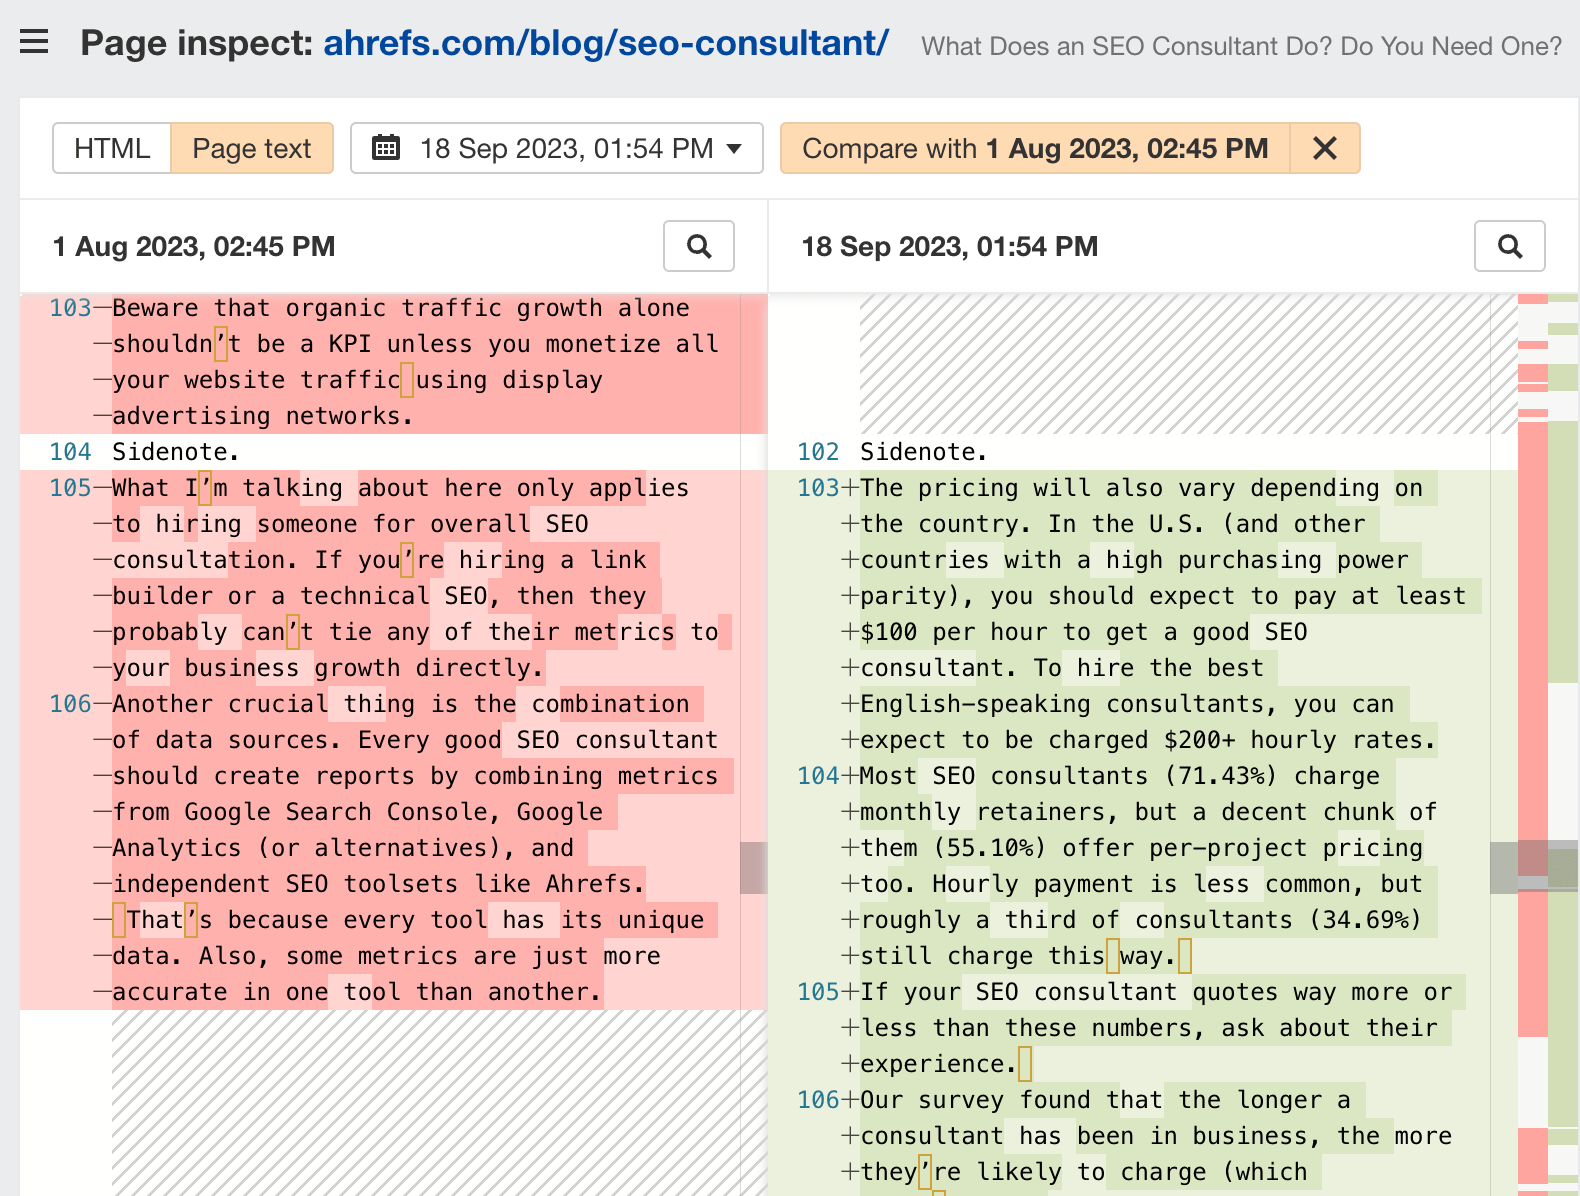
First up, we’ve added a new standalone Page inspect tool that shows you the change history of a page’s HTML code or plain text.
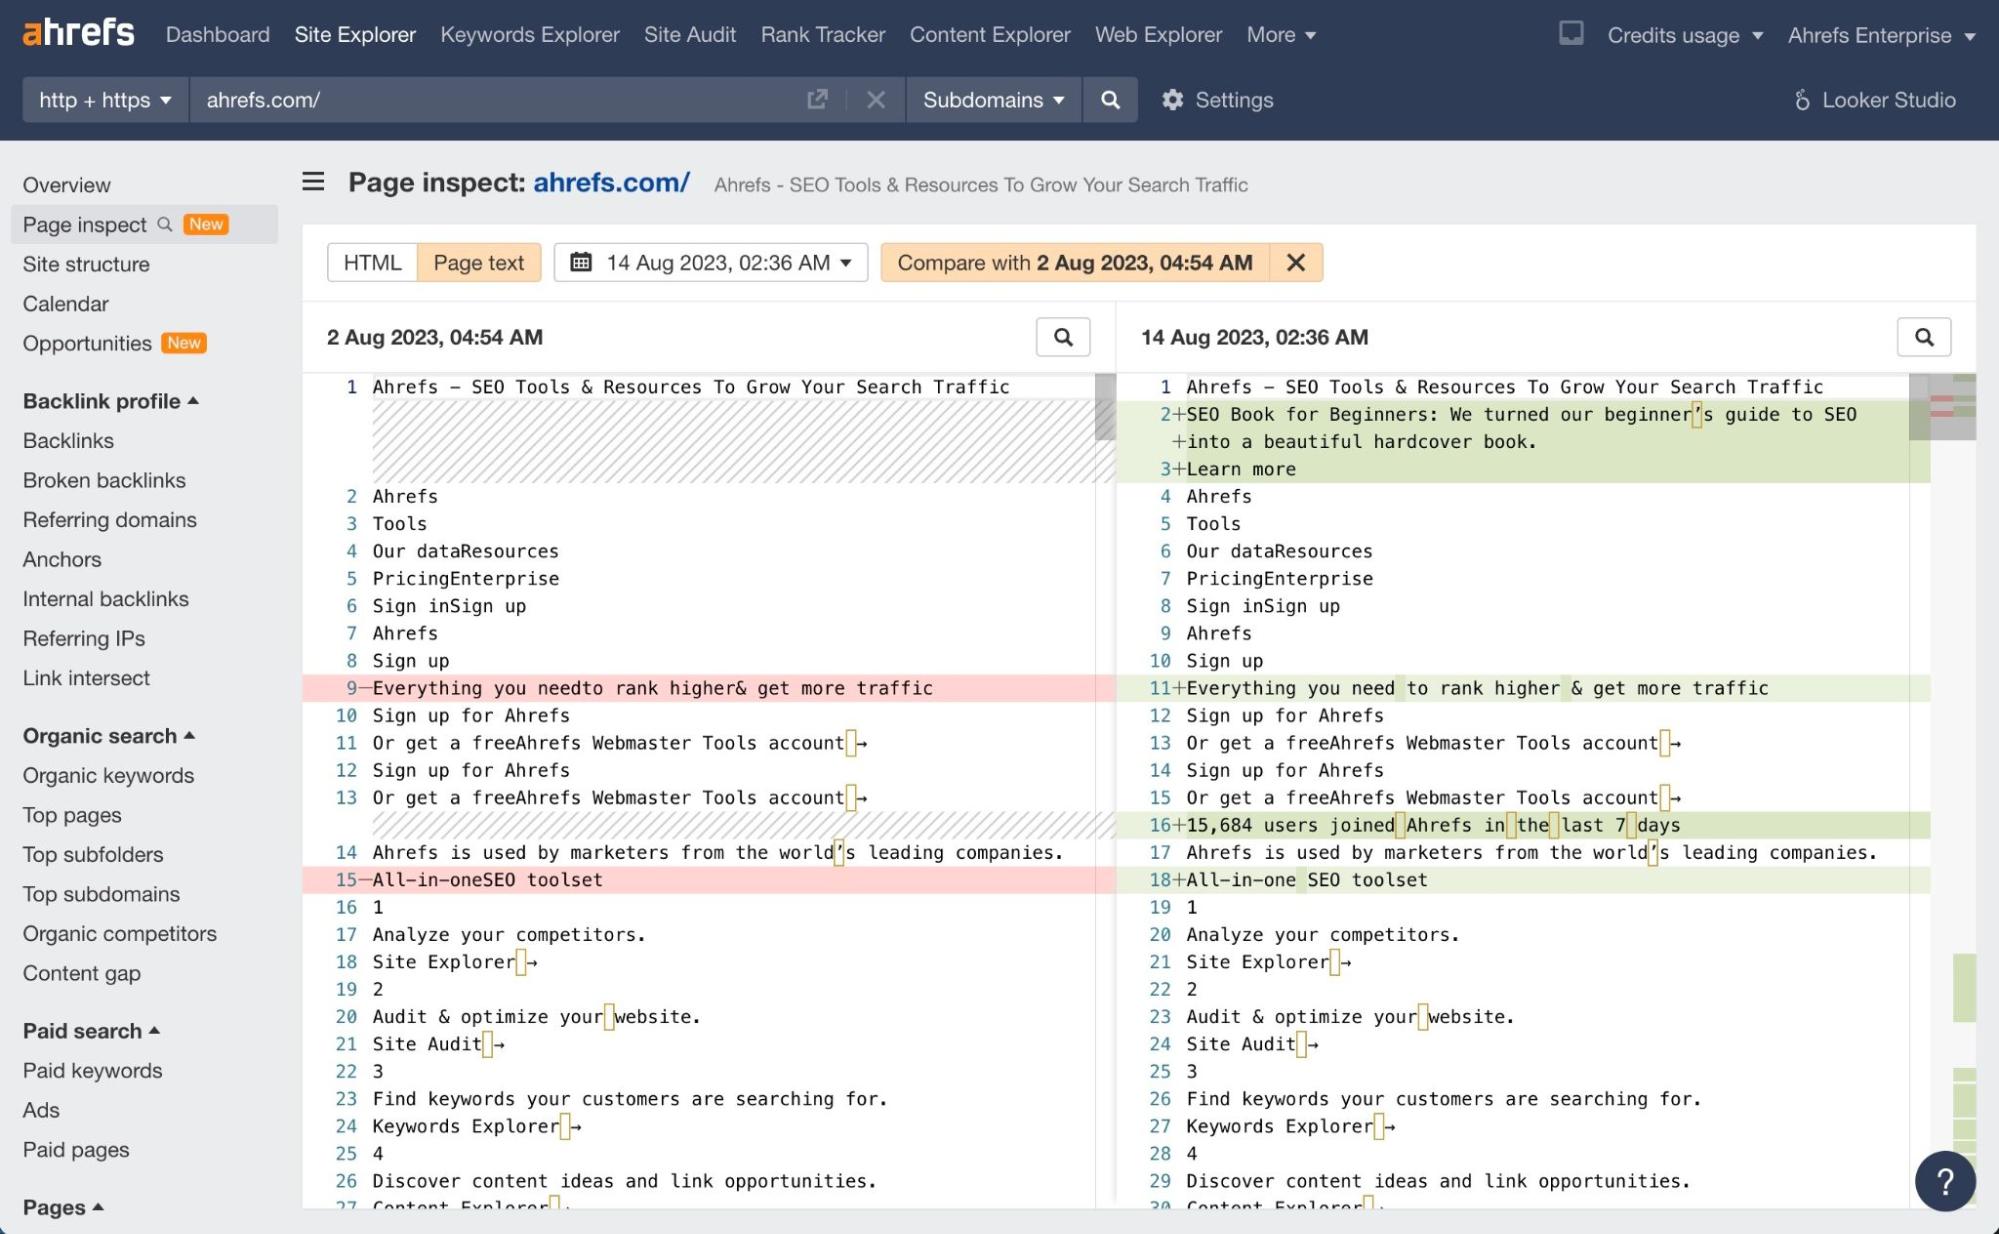
Its main use case is to compare changes made to a page at two points in time.
For example, this page on our blog was published a while ago but barely got any traffic.
Then all of a sudden, organic traffic saw a big spike around mid-August.
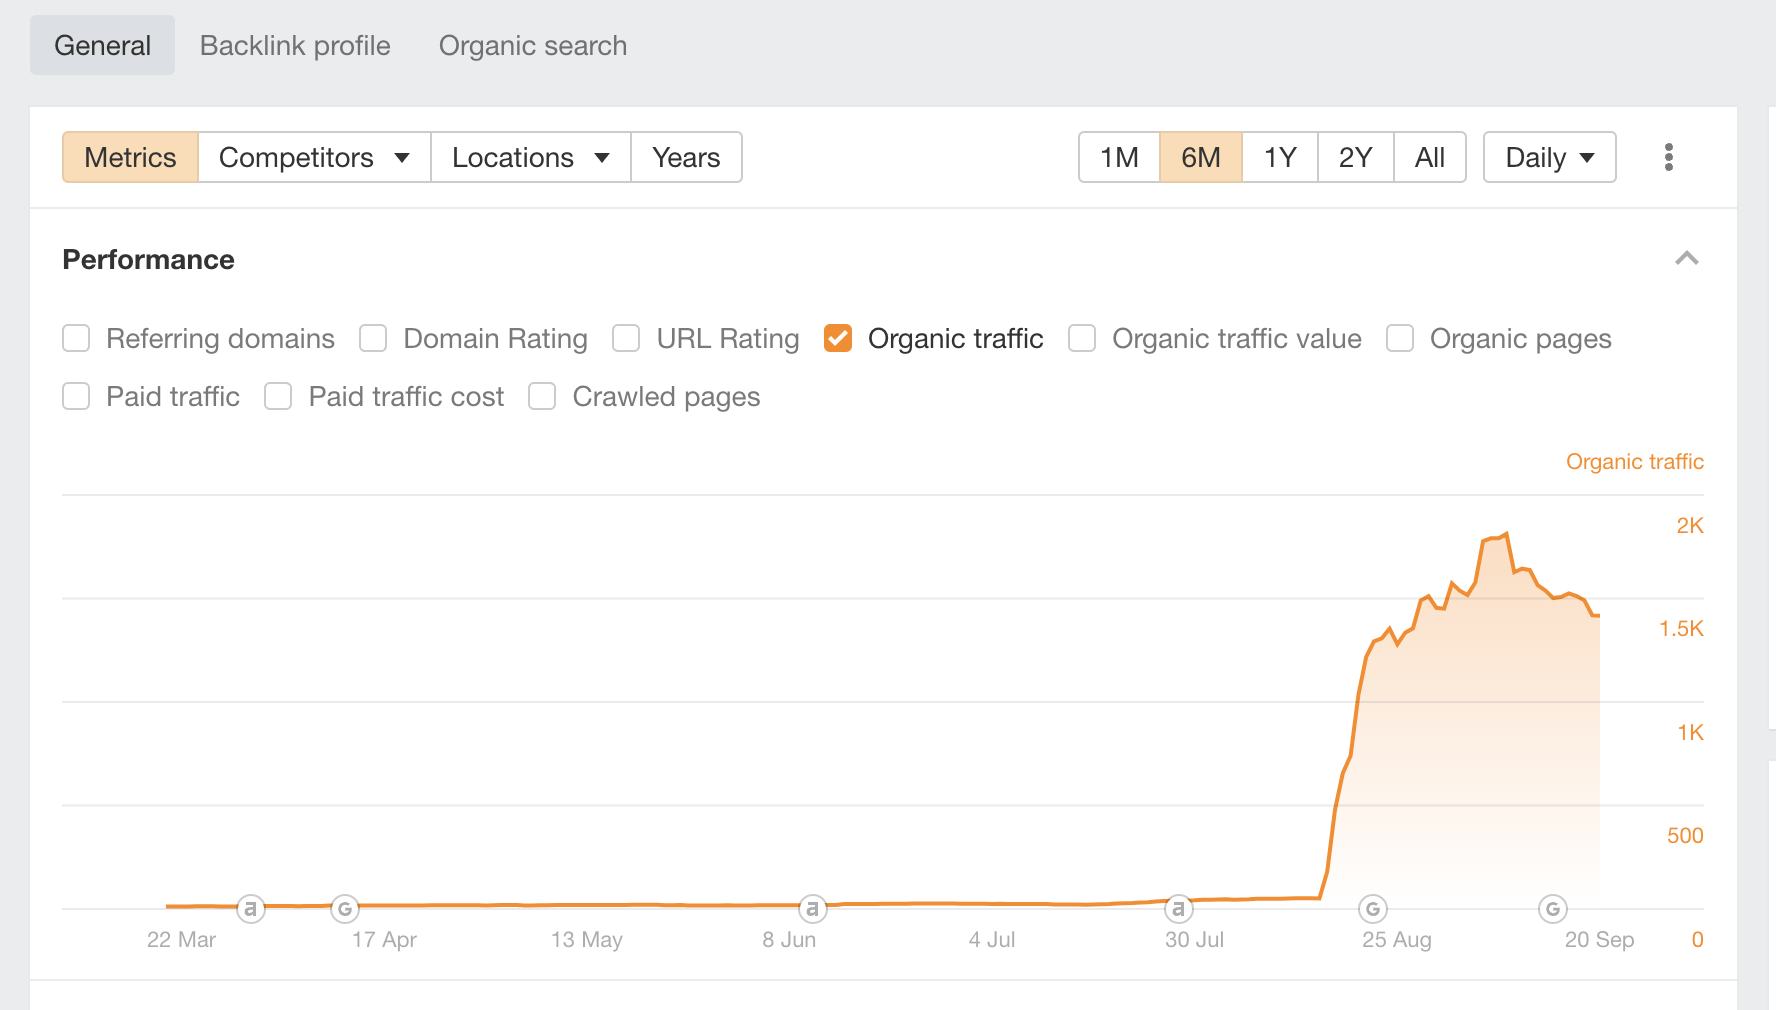
If we go to the Page Inspect tool and compare the content from around September to near the beginning of August, then hit the Page text button, we’ll see that there was a full content update on this post to better match search intent. And it clearly worked!
Top-level domain widget
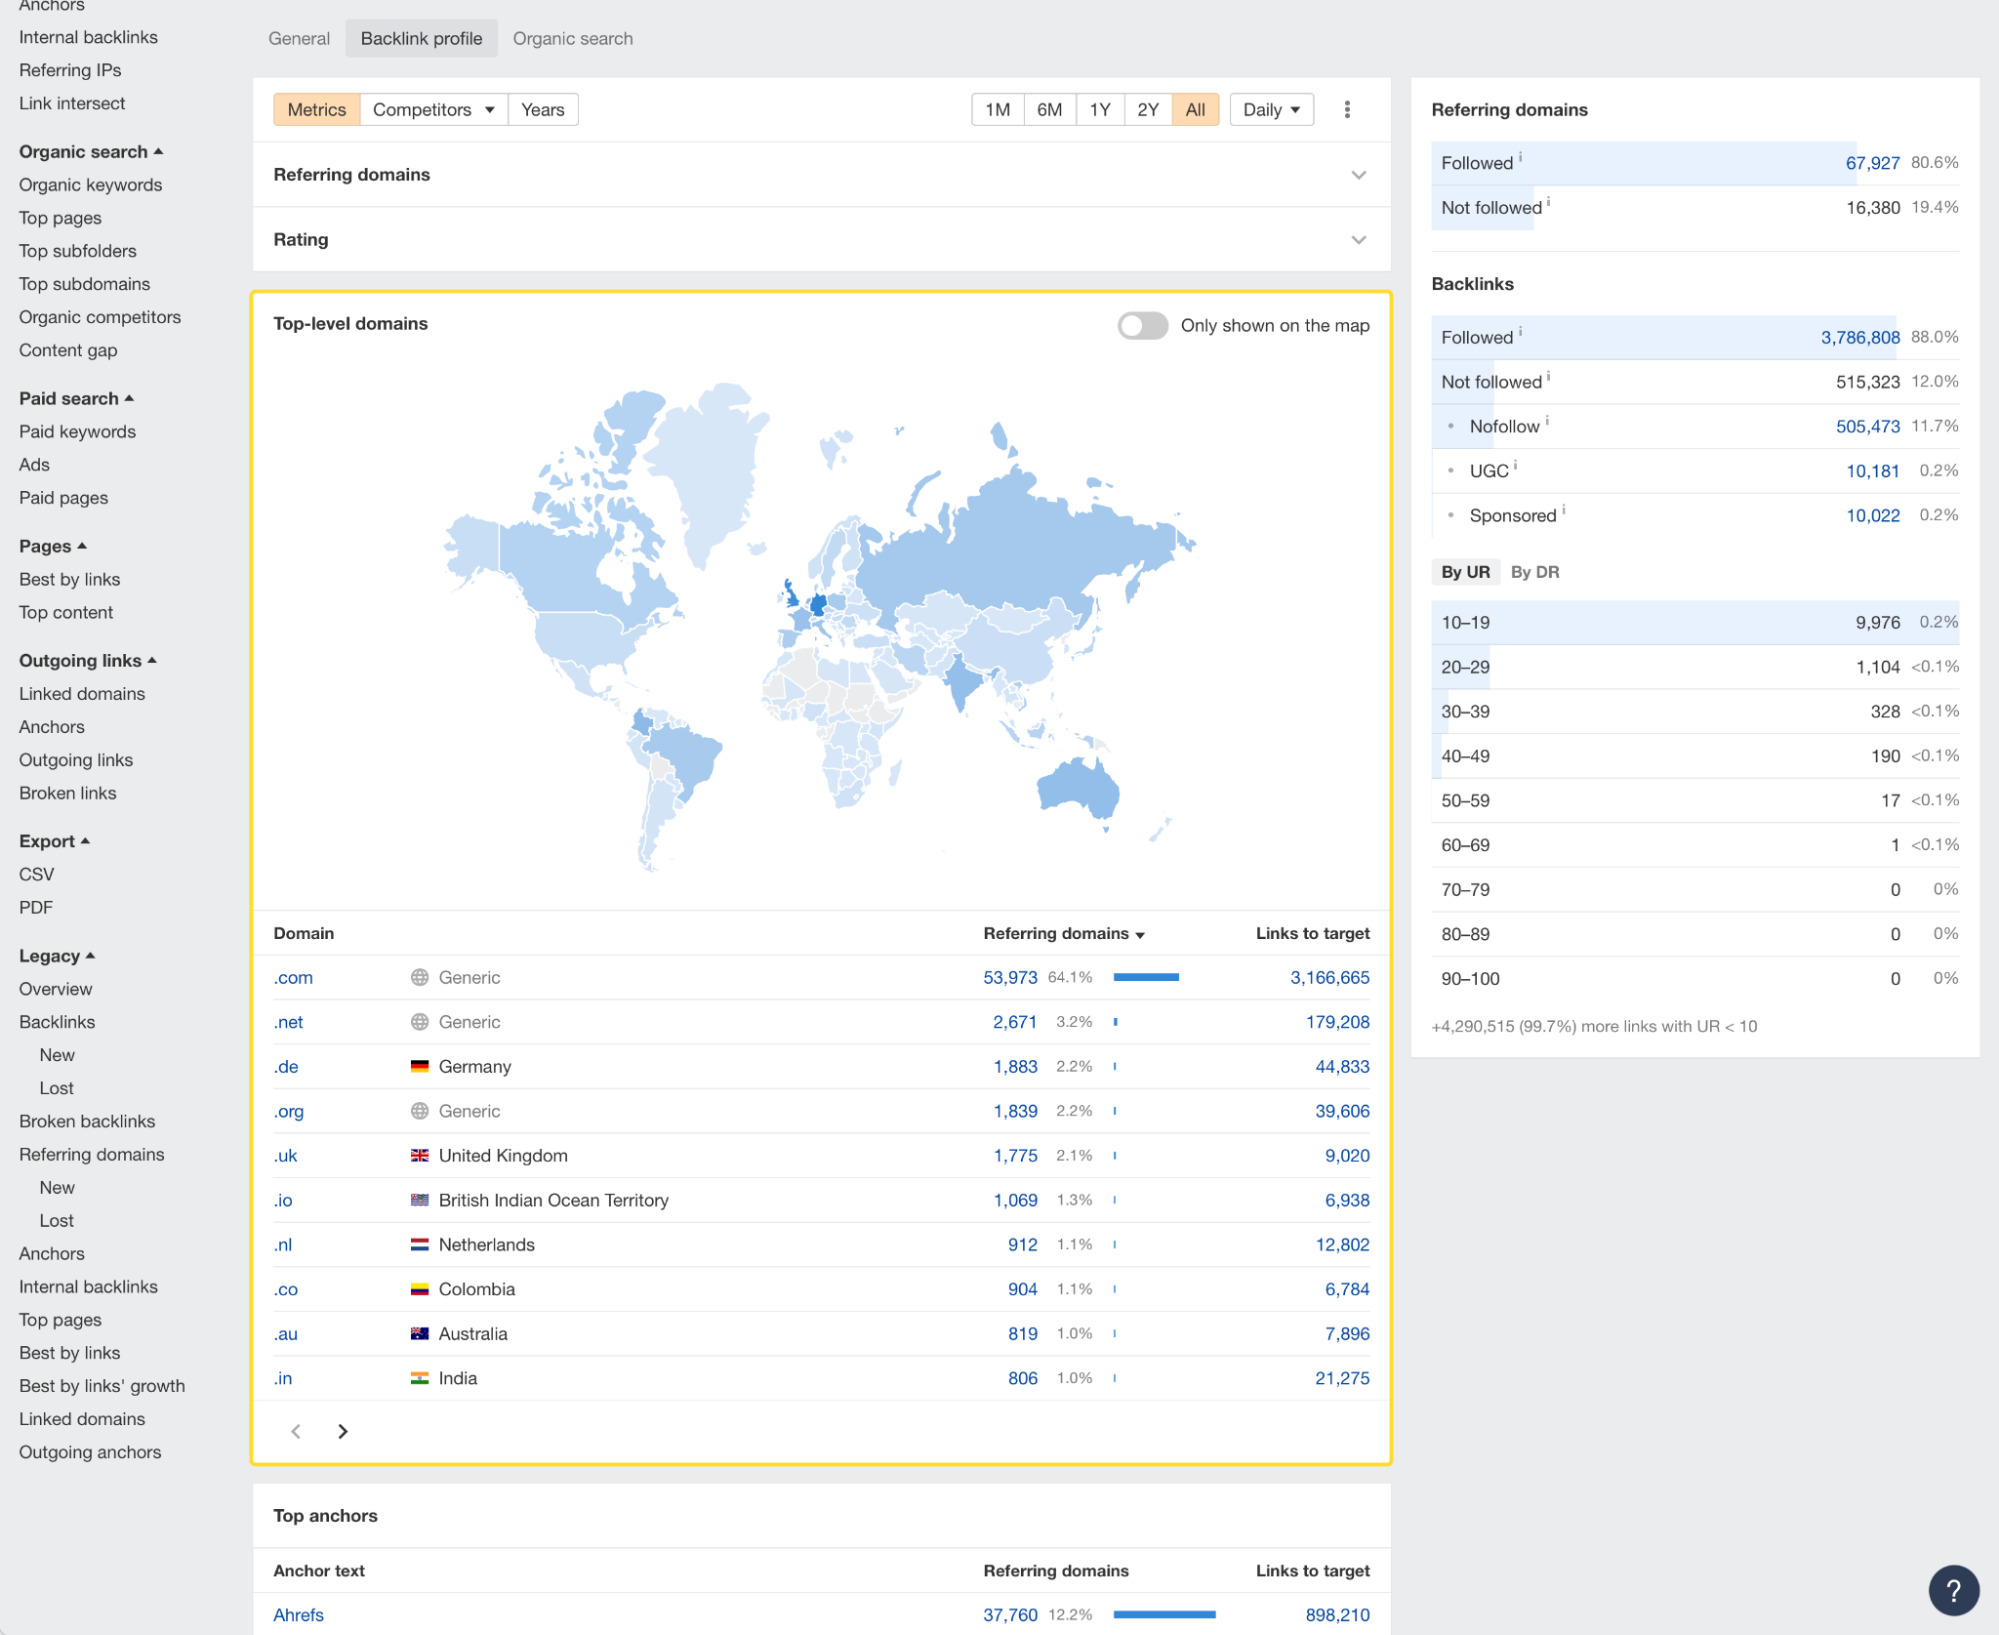
In Overview, we’ve added a new widget that shows you how your target’s referring domains and backlinks are distributed by top-level domains, or TLDs.
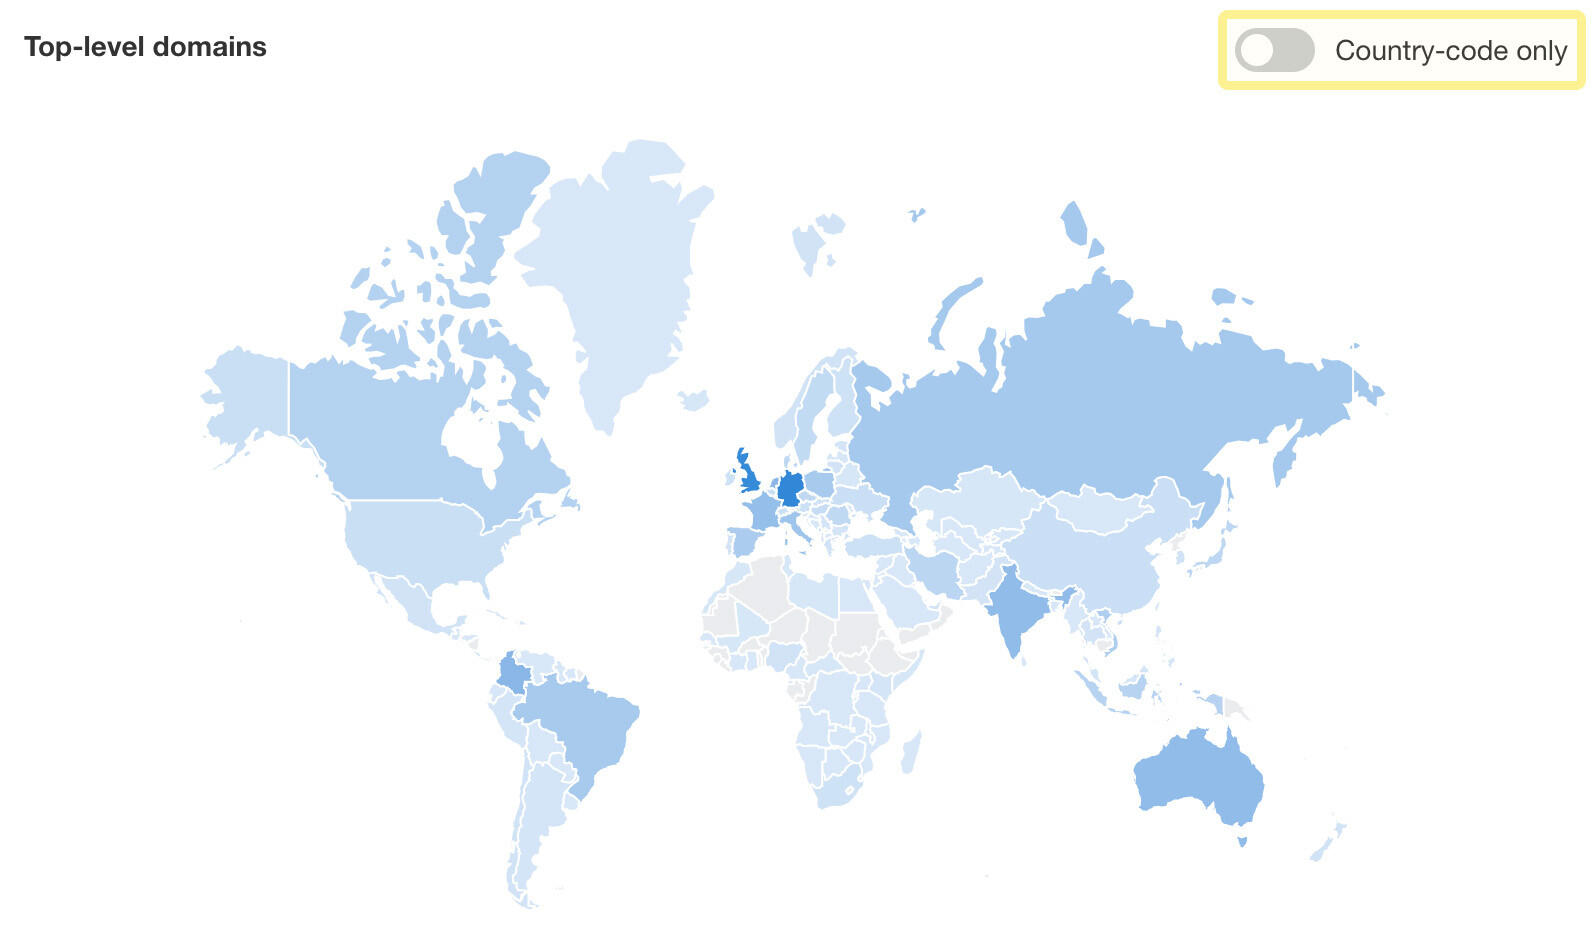
To see just country-code TLDs, toggle this filter on.
Click on the map or the table below to filter referring domains by TLD.

190+ structured data validation issues against Google’s guidelines
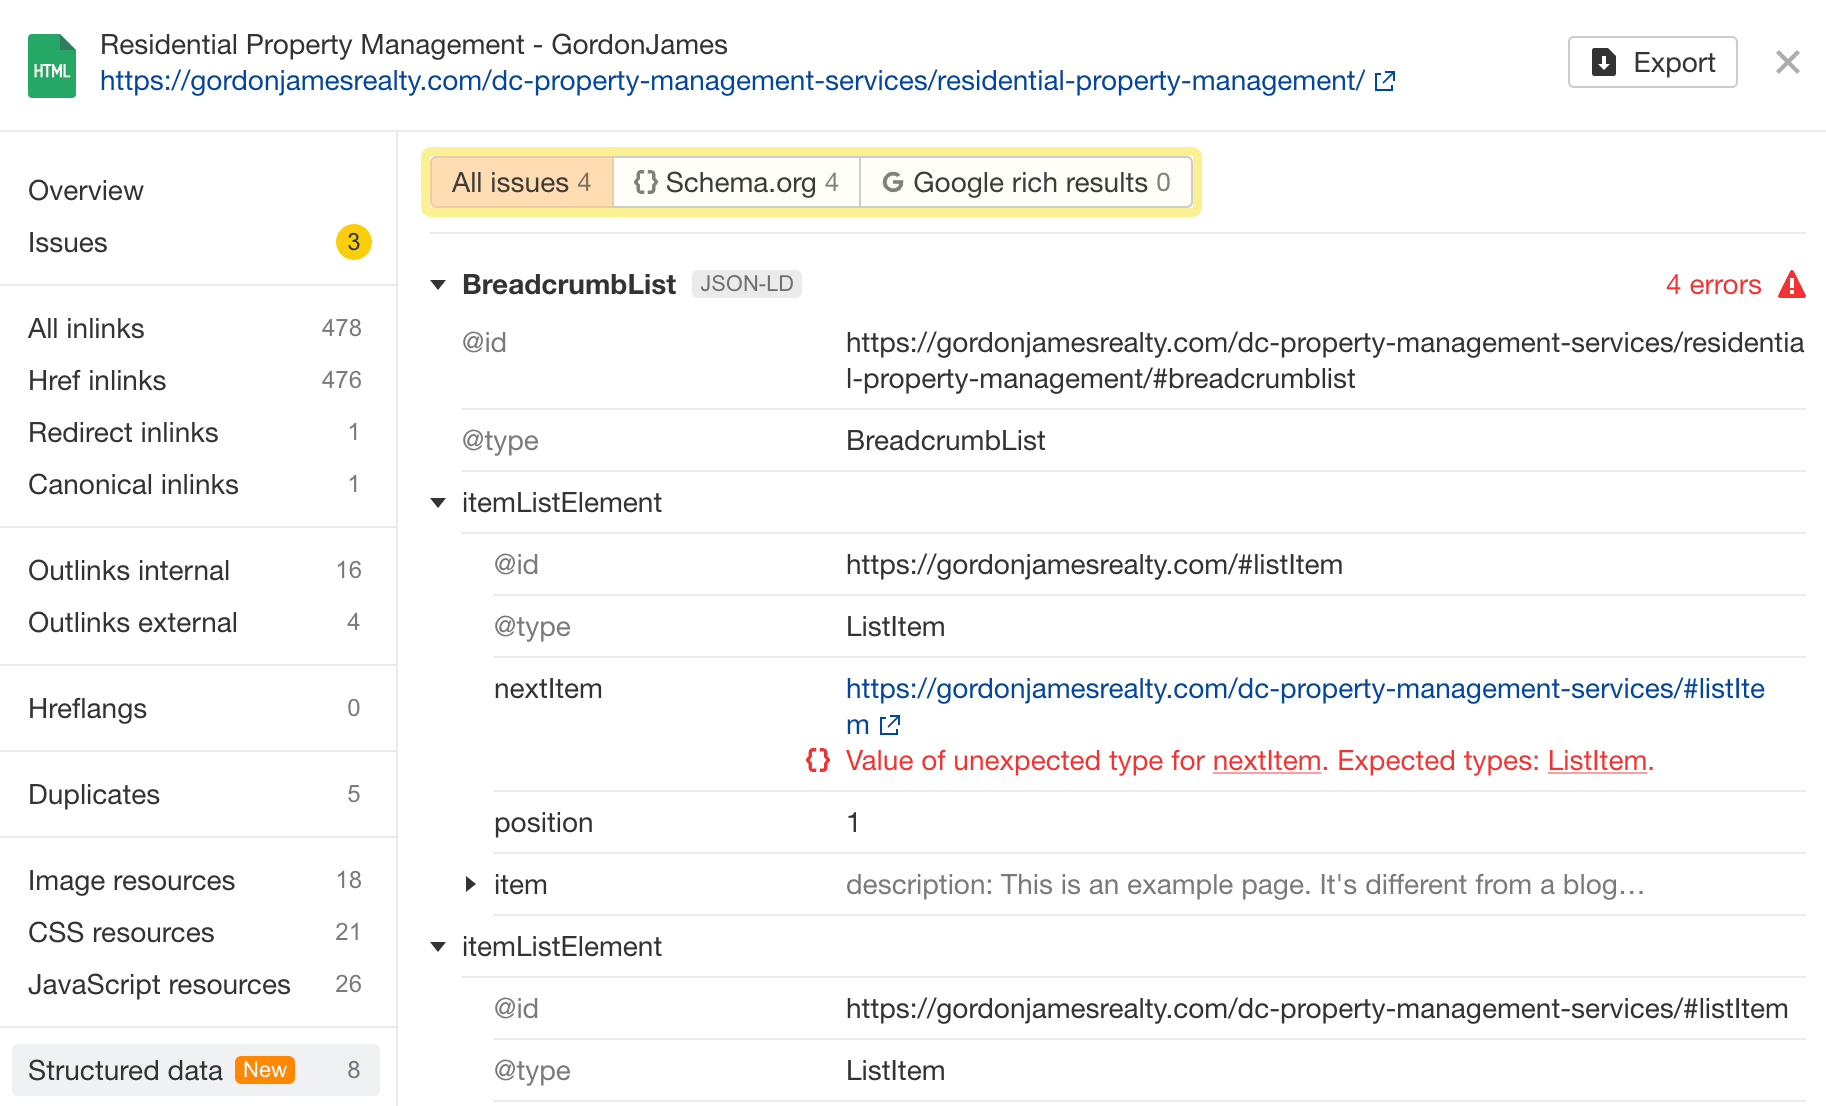
Site Audit now supports structured data validation against 190 mandatory rules listed in Google’s guidelines.
We’ve also added a corresponding Site Audit issue, along with a filter to toggle between Schema and Google issues.
Hreflang link graphs
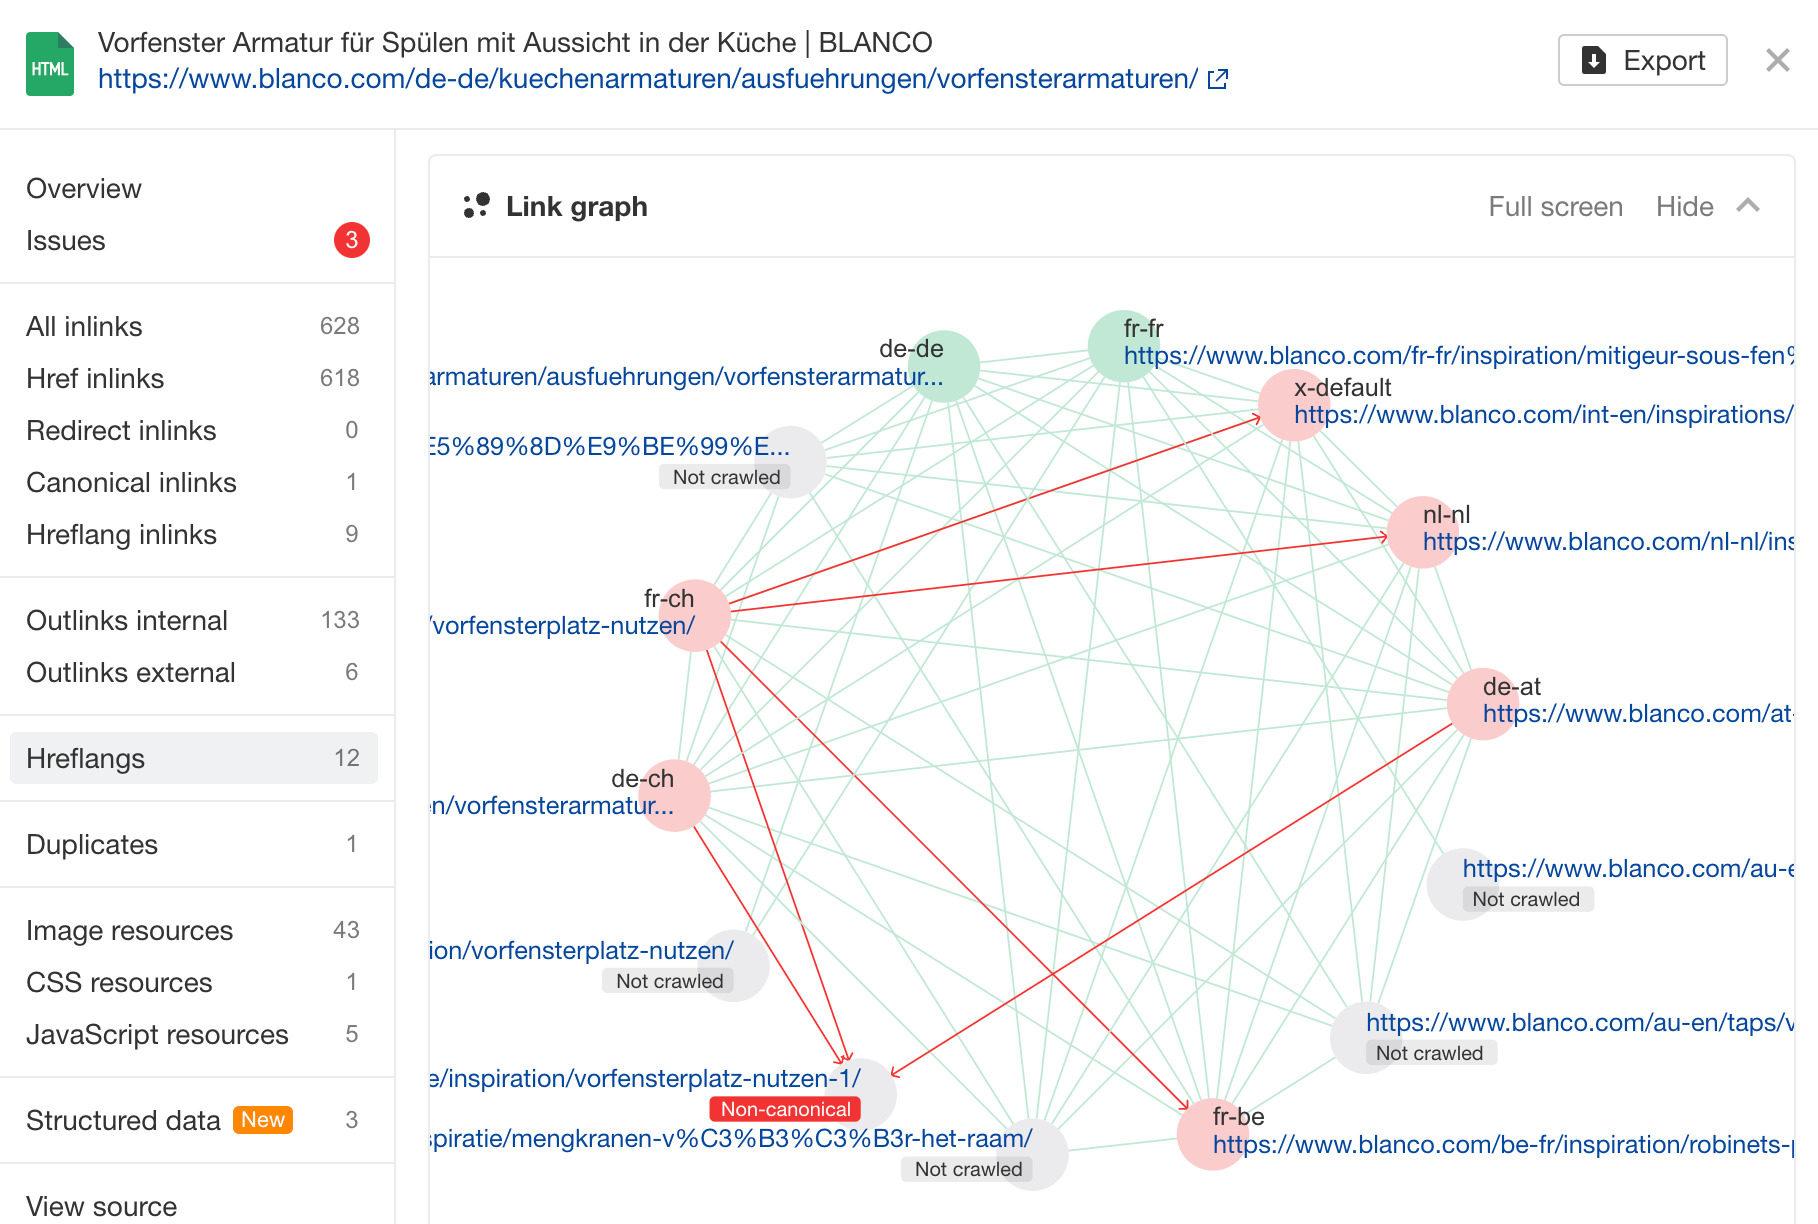
There’s a new hreflang link graph in Site Audit that helps you visualize hreflang issues.
Now, when you open the URL details panel of a page and click on the Hreflangs tab, you’ll see the whole hreflang cluster of a page. Errors with pages and links are highlighted in red, which lets you quickly spot which link is missing – or was added by mistake.
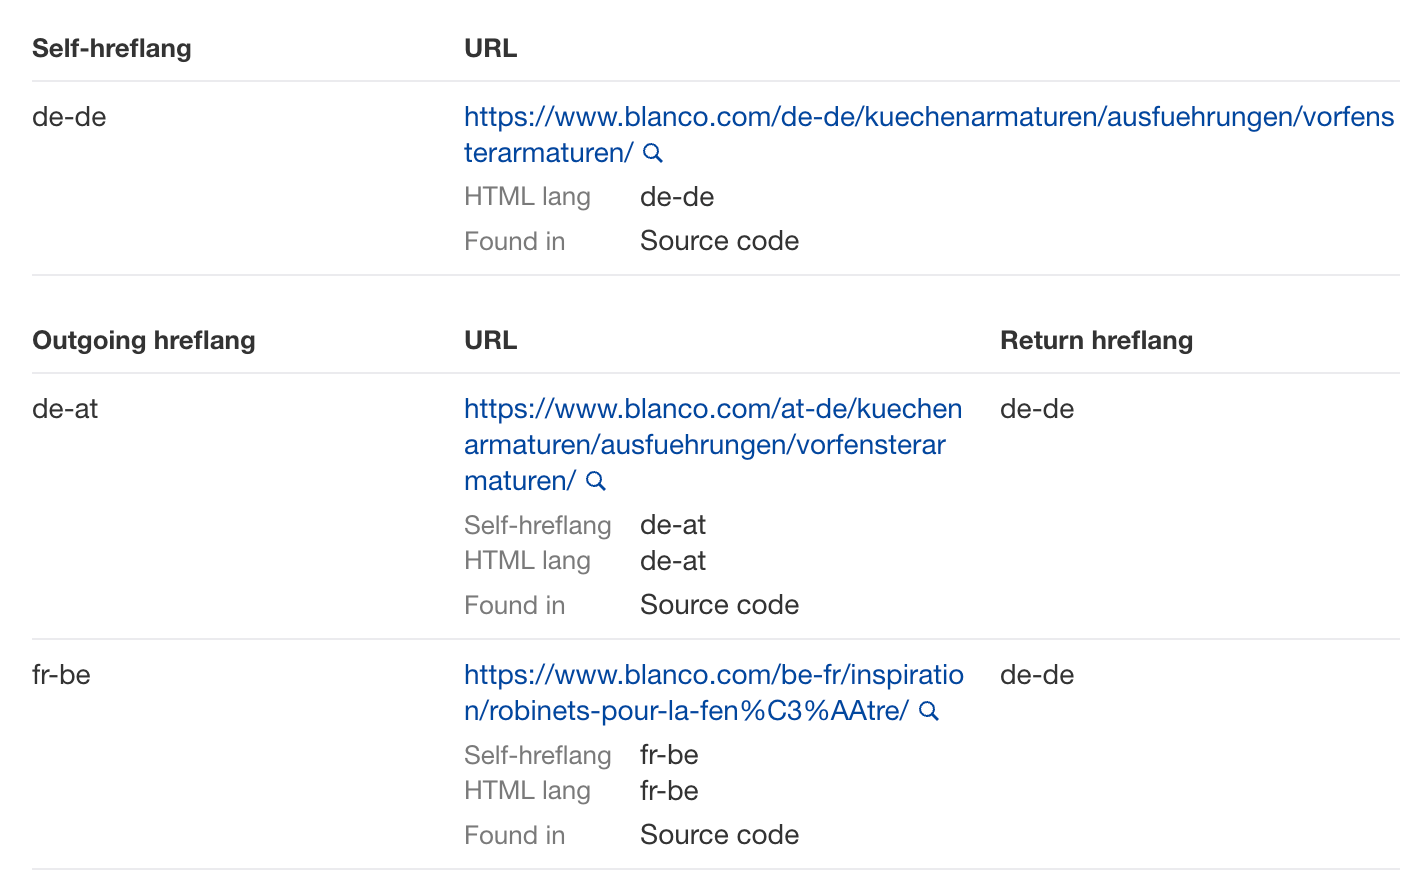
The table below shows more details on the connections.
Filter by changes in fields
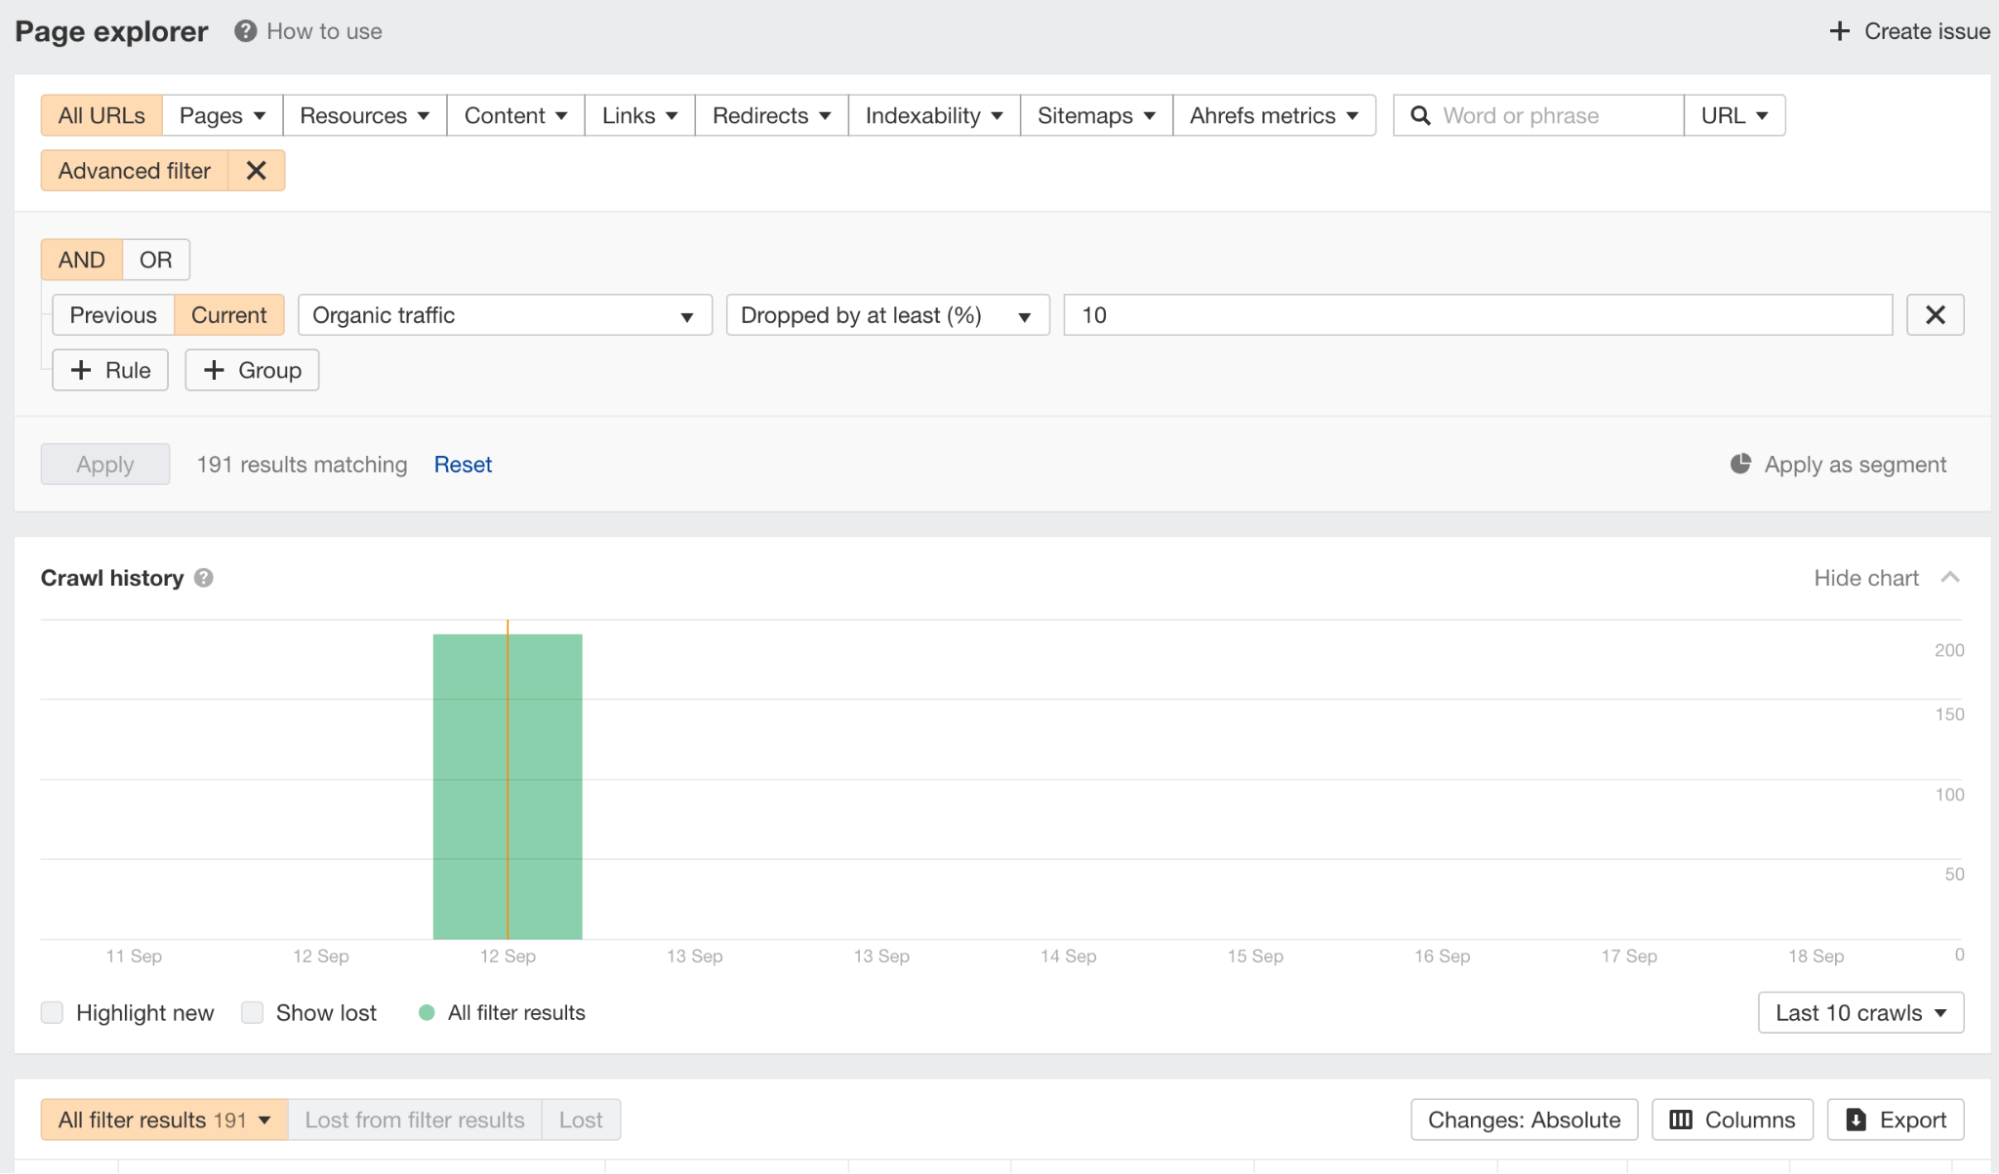
You can now filter crawl results by changes in fields, either by numbers or by percentages.
This opens up a bunch of use cases. For example, we can now look at the Ahrefs blog in Page Explorer and add an advanced filter for pages that saw an organic traffic decrease of at least 10%.
Other things you can filter for include:
- Pages with changes in word count
- Indexable pages that became non-indexable
- Pages whose title or meta description changed
- Redirects with modified target URLs
—
That’s all for this month. If you have any feature requests, you can leave them on our Canny or in our subscribers-only Ahrefs Insider community. Enjoy!


