The basic formula for calculating TAM is:
TAM = (Total Number of Potential Customers) × (Average Annual Revenue per Customer)Understanding TAM helps you figure out the size of your market and the amount of money you could make if you captured all of it.
TAM is also a key metric for startup investors. It shows whether a business idea has a big enough opportunity. Investors often look for a TAM that is “just right” — not too big or too small. A TAM that’s too large might mean the market is crowded with tough competition, while a TAM that’s too small could mean limited room for growth.
In this guide, you’ll learn how to estimate TAM using three methods, where people often make mistakes, and how to refine your estimations to make them plausible to investors or stakeholders and actionable for your business.
There are three approaches to calculating TAM. Depending on the available market data, your business model, and your stakeholders/investors, you should consider using the top-down, bottom-up, or value theory approach.
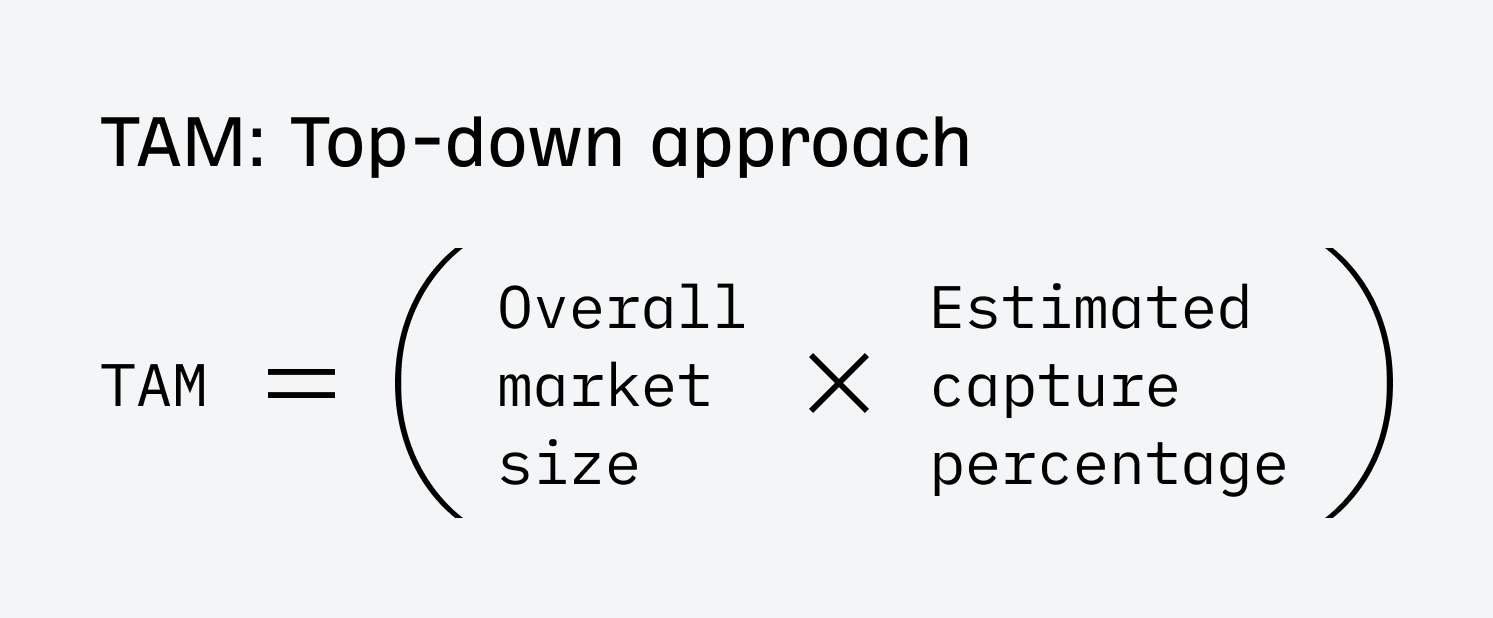
1. Top-down approach
The top-down approach starts with broad market data and narrows it down to estimate the market size for your specific product or service.
This approach is useful when there’s reliable, broad industry data available.
How to use
- Estimate the overall market size in which your product operates, usually obtained from industry reports or research.
- Apply a percentage that represents the portion of the market your product can realistically capture.
Example
If the global smartphone market is valued at $500 billion, and you are launching a new smartphone accessory, you might estimate that your product could target 5% of the market, which gives you a TAM of $25 billion.
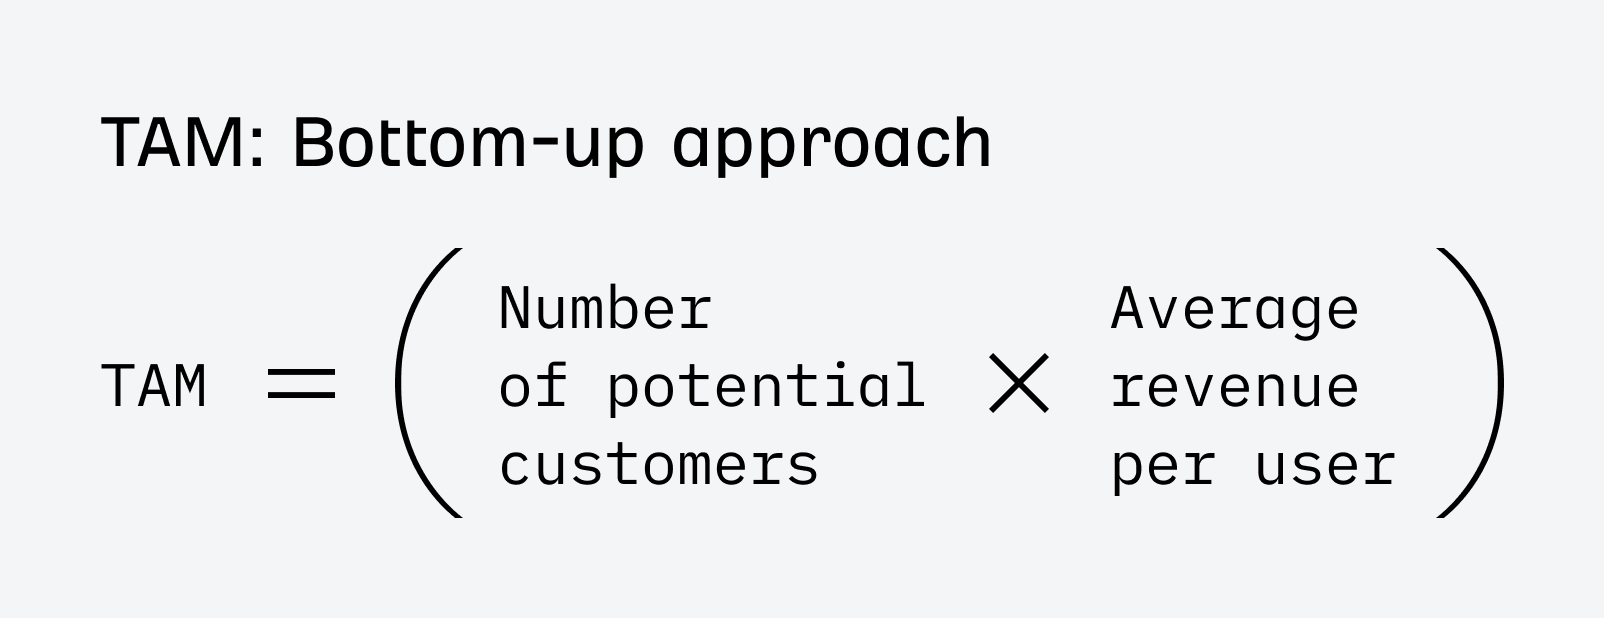
2. Bottom-up approach
The bottom-up approach builds the TAM by starting with specific, individual data related to your business and scaling it up.
This method is great when you have detailed knowledge of your customer base and pricing. As far as I know, investors prefer this method, which offers the most accurate and actionable TAM estimation.
A few birds in the hand is worth billions in the TAM. Early-stage (pre-Series-B) startups shouldn’t worry too much about calculating a precise TAM. As long as it’s in the right ballpark for their thesis, investors care a lot more about the traction you can show with paying customers. That’s why bottom-up is far more convincing than hand-wavy top-down methods that only rely on finding a big enough pie to claim as your market.

How to use
- Estimate how many potential customers there are in your target market. You can do this by using sources like industry reports, census data, or research from trusted organizations (more data sources at the end of the article).
- Multiply this number by the average revenue you expect to earn from each customer (ARPU - Average Revenue Per User).
To calculate ARPU, consider the pricing of your product or service, how frequently customers will purchase, and the churn rate.
For example, if you charge $100 per month for a subscription service, your monthly churn rate is 5%; on average, a customer might stay subscribed for around 6-7 months, meaning your average revenue per customer would be around $600-700.
Example
Let’s say you have subscription-based software that helps small businesses manage their finances. You identify that 2 million small businesses could benefit from your software. If your ARPU is $600, your TAM would be 2 million customers × $600 = $1.2 billion.
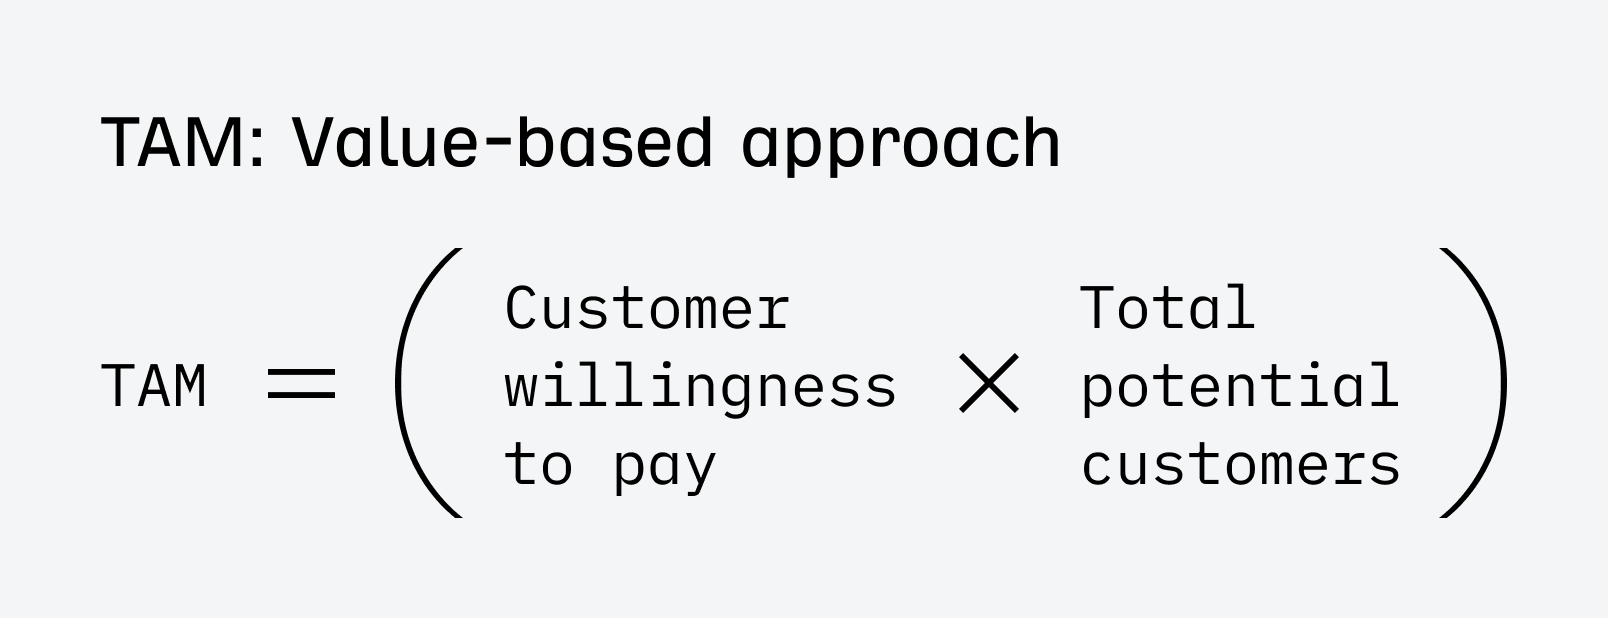
3. Value theory approach
The value theory approach estimates TAM based on the value your product provides to customers and how much they might be willing to pay for it.
This approach is especially useful if you’re introducing a product or service that disrupts existing markets; traditional market size calculations may not accurately reflect the potential.
How to use
- Assess the value or cost savings that your product delivers to the customer.
- Estimate how much customers would be willing to pay for that value and scale it across the entire market.
Example
Suppose you have developed a new energy-efficient lighting system that saves companies $10,000 per year in energy costs.
If 100,000 companies could use your lighting system, and each is willing to pay $5,000 for it (because they’ll save $10,000), your TAM would be 100,000 companies × $5,000 = $500 million.
There’s also a fourth option — a middle ground mentioned by quite a few people who offered their insights for this article.
I’d say the best method to estimate TAM is usually a combination of top-down and bottom-up approaches. The top-down method gives you a big picture view using industry reports and market research, while bottom-up lets you build from the ground up using your own data and customer insights. This combined approach helps balance out the weaknesses of each method.

You may encounter the TAM, SAM, and SOM terminology and need to apply it if an investor requests it.
People who prefer this approach treat TAM as a “pie in the sky” number and further refine it with SAM and SOM portions of it.
- TAM (Total Addressable Market) is the total market if you could sell to everyone, everywhere. Your biggest possible opportunity.
- SAM (Service Addressable Market) is the portion of the TAM you can actually target based on where you operate and who your product is for. For example, if you’re a local coffee shop in New York City, your SAM might be coffee drinkers in NYC, not every coffee drinker worldwide.
- SOM (Service Obtainable Market) is the realistic piece of the SAM that you can actually win over, considering the competition and your strengths. Continuing with the coffee shop example, your SOM might be the number of customers you can realistically attract in your neighborhood, given factors like nearby competitors, your unique offerings, and marketing efforts.
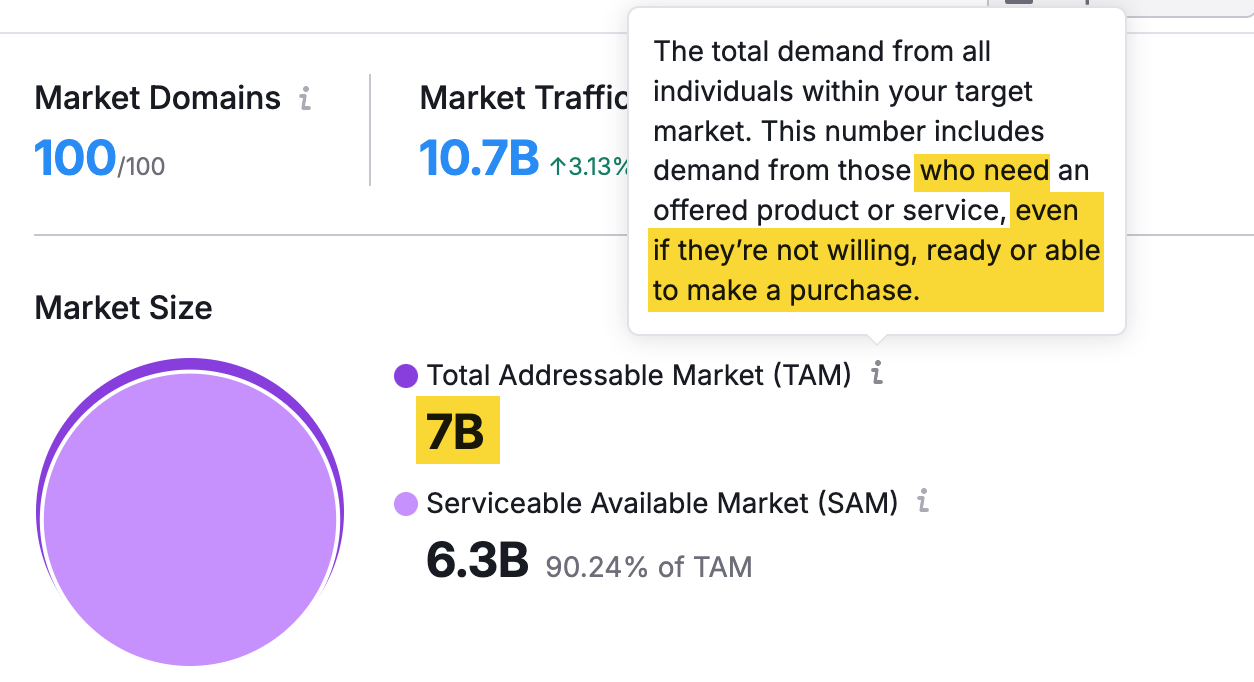
TAM is typically used to make a compelling story about the potential for growth, so it’s easy to be over-optimistic and make mistakes that could make your TAM look better.
Here’s an example. I used a tool that calculates TAM automatically based on a URL to find the market size for netflix.com. The tool told me that there are 7B people who “need it (…) even if they’re not willing or able to make a purchase” and 6.3B ready to make a purchase. Something that I find hard to believe since there are an estimated 5.3B people with internet access worldwide.
Also, the way that the tool defines my potential customers doesn’t sound convincing to me, either, let alone logical.
Other mistakes you should avoid:
- Falling into the “everything trap”. This is when businesses assume that their product or service could appeal to everyone in the market, leading them to calculate TAM based on an overly broad audience.
- Sizing the problem instead of the market. This happens when businesses focus on the total number of people who might benefit from their solution without considering how many are realistically willing to pay for it.
- Overlooking market trends and dynamics. The market can grow or contract, consumer preferences can change, government regulations can influence the market, etc.
The basic data sources for TAM calculations are industry reports you can find on platforms like Statista and census data (like the US census data). However, there are other places where you can look for more detailed data.
Explore the market using search data
Search data is information about what people are looking for online. It can help you understand what customers want, where interest is growing, and what regions are most active.
Google Trends provides some of that data for free. For example, you can check if interest in a plant-based diet is still strong and where in the US you could find the most customers.
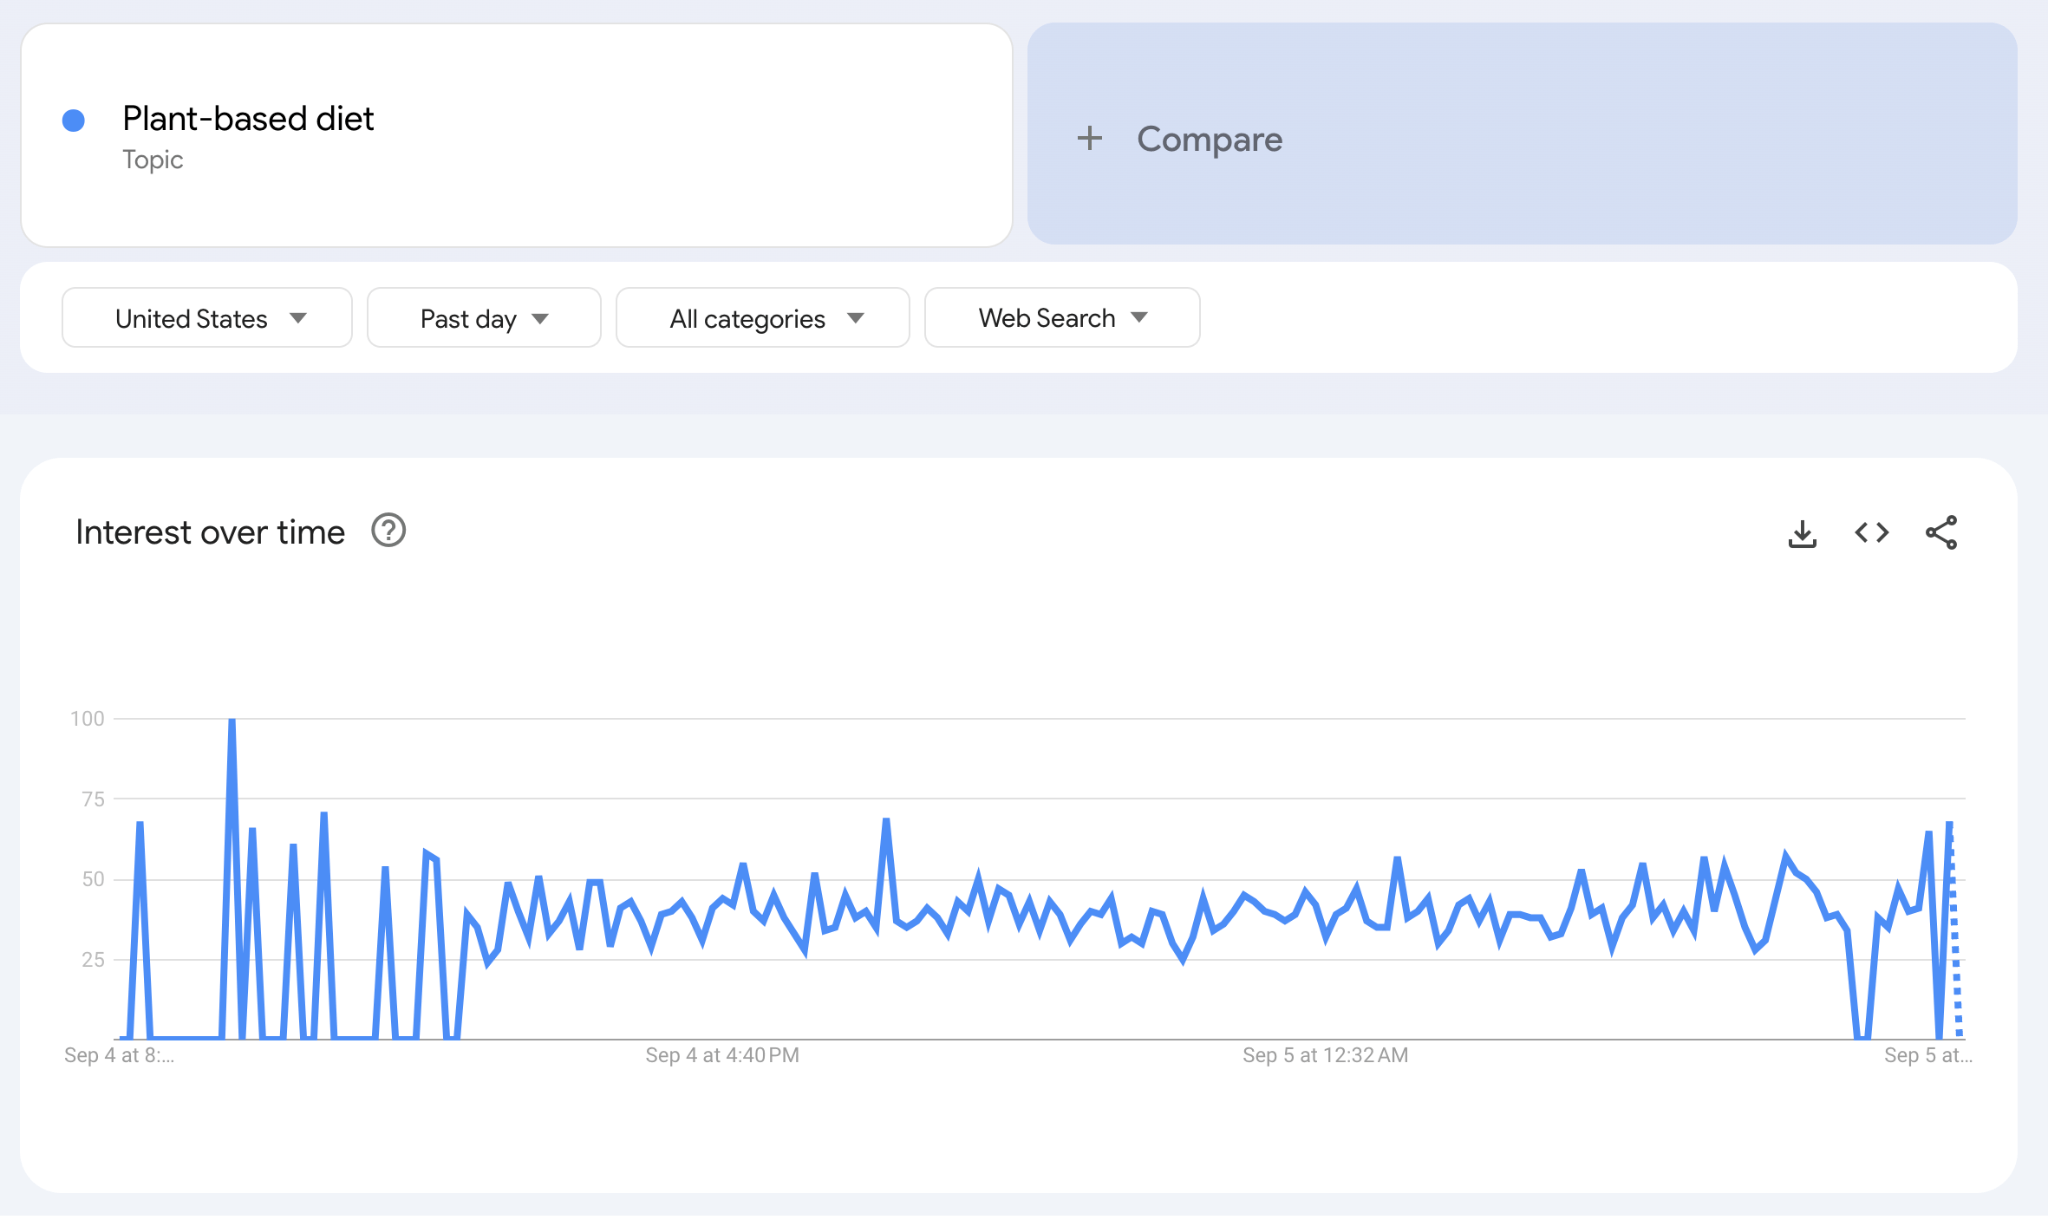
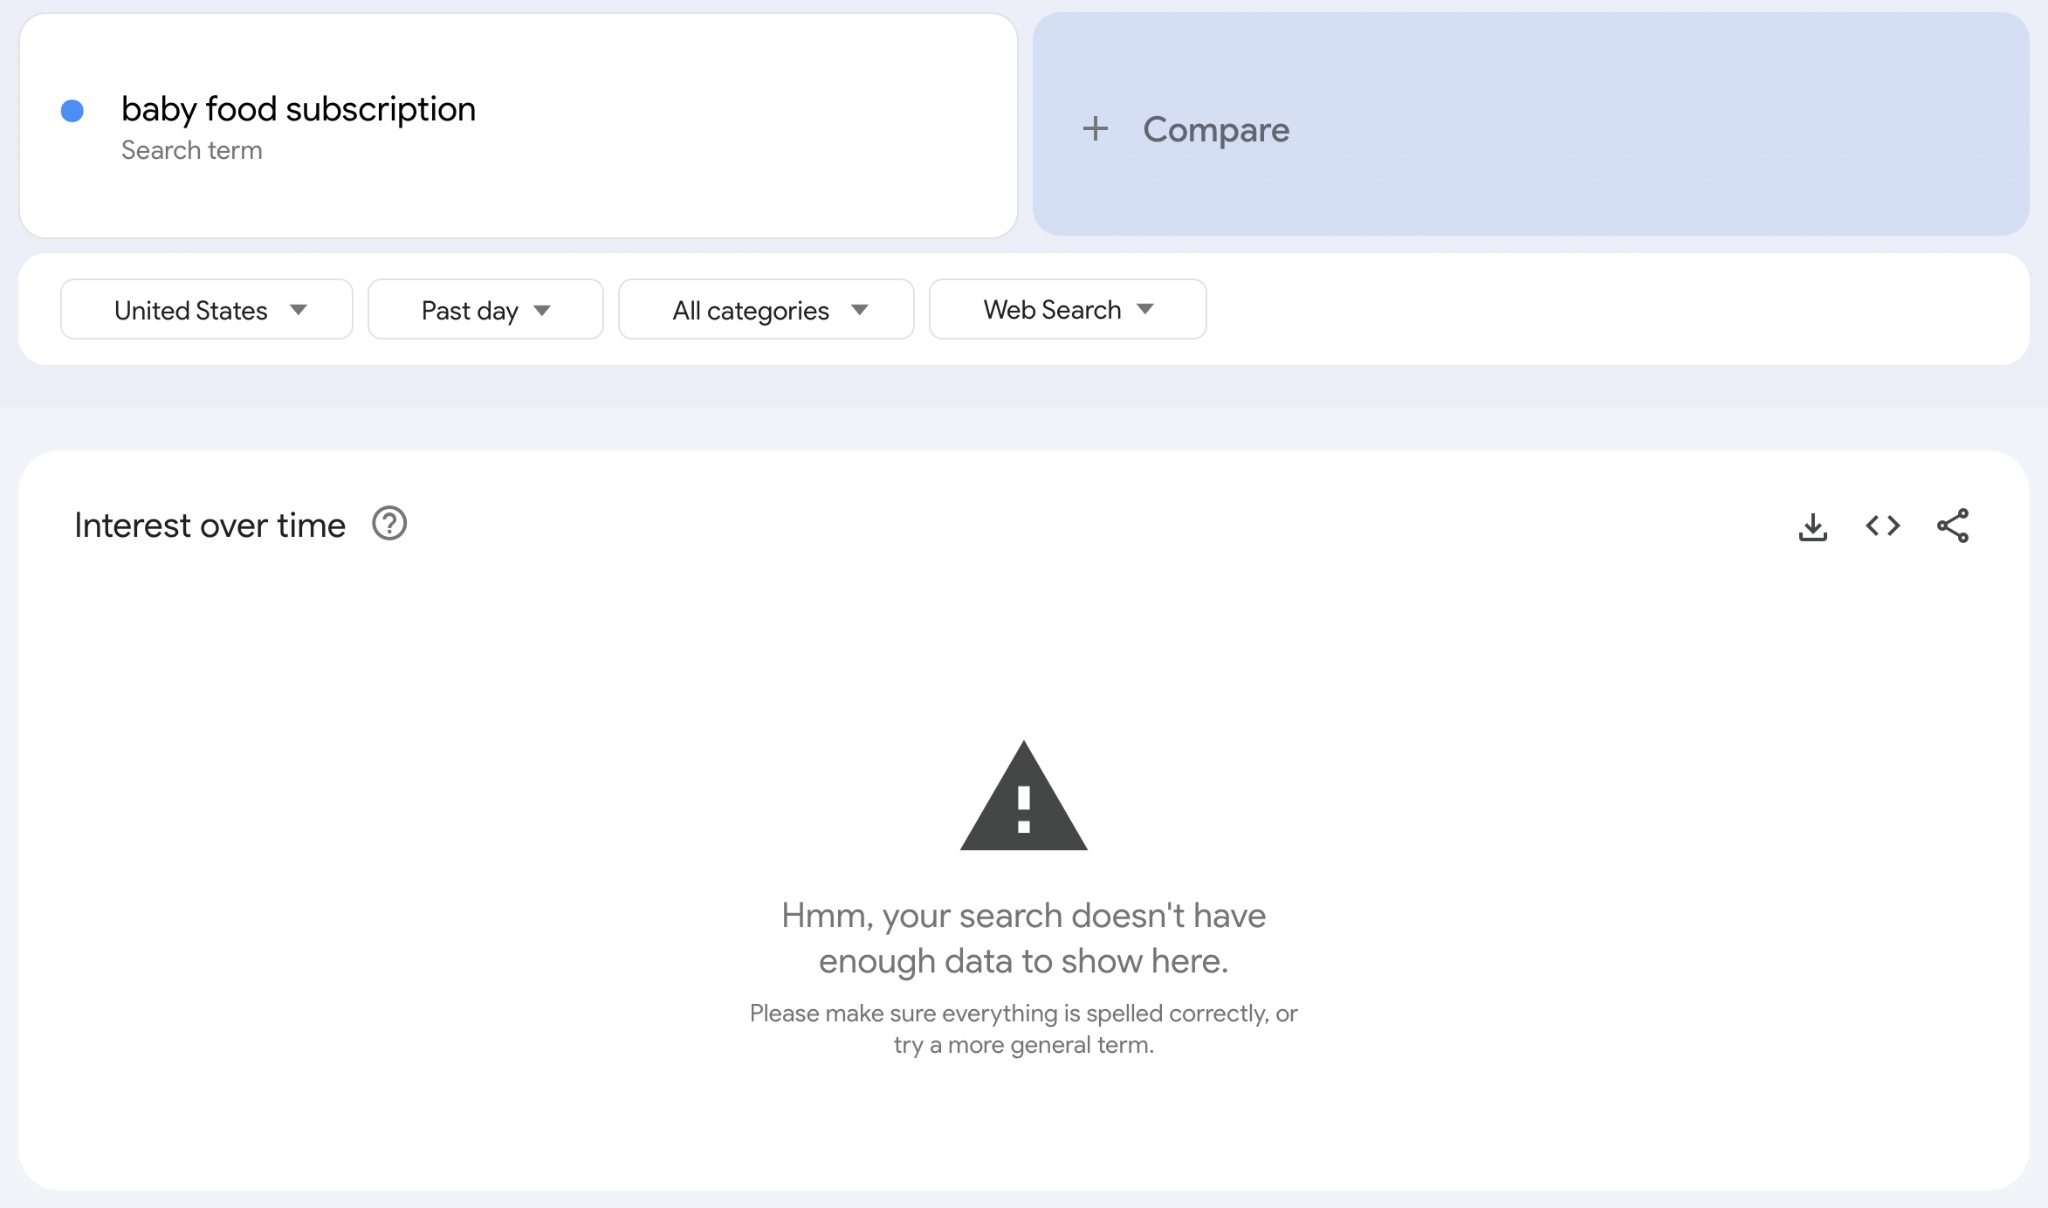
But that’s how far this tool goes. You don’t know what terms are “inside” the topic or how popular a keyword is (the numbers in Google Trends are relative). Also, sometimes Google won’t have the data, just like for the term “baby food subscription”.
Alternatively, you can use Ahrefs. I’m sure you’ll find more search terms there and a lot more data points. Let me take you through three examples.
Gauge demand with search volume
Search volume is an estimation of the average monthly number of searches for a keyword over the latest known 12 months of data.
High search volumes suggest a larger potential market. Low search volumes, suggest a smaller market (or that you will need to be more creative to find customers).
For example, while Google Trends didn’t have any data on “baby food subscription”, Ahrefs’ Keywords Explorer shows that there are an estimated 1.2K searches per month in the US of that term. Plus, it shows you the forecast for that keyword.
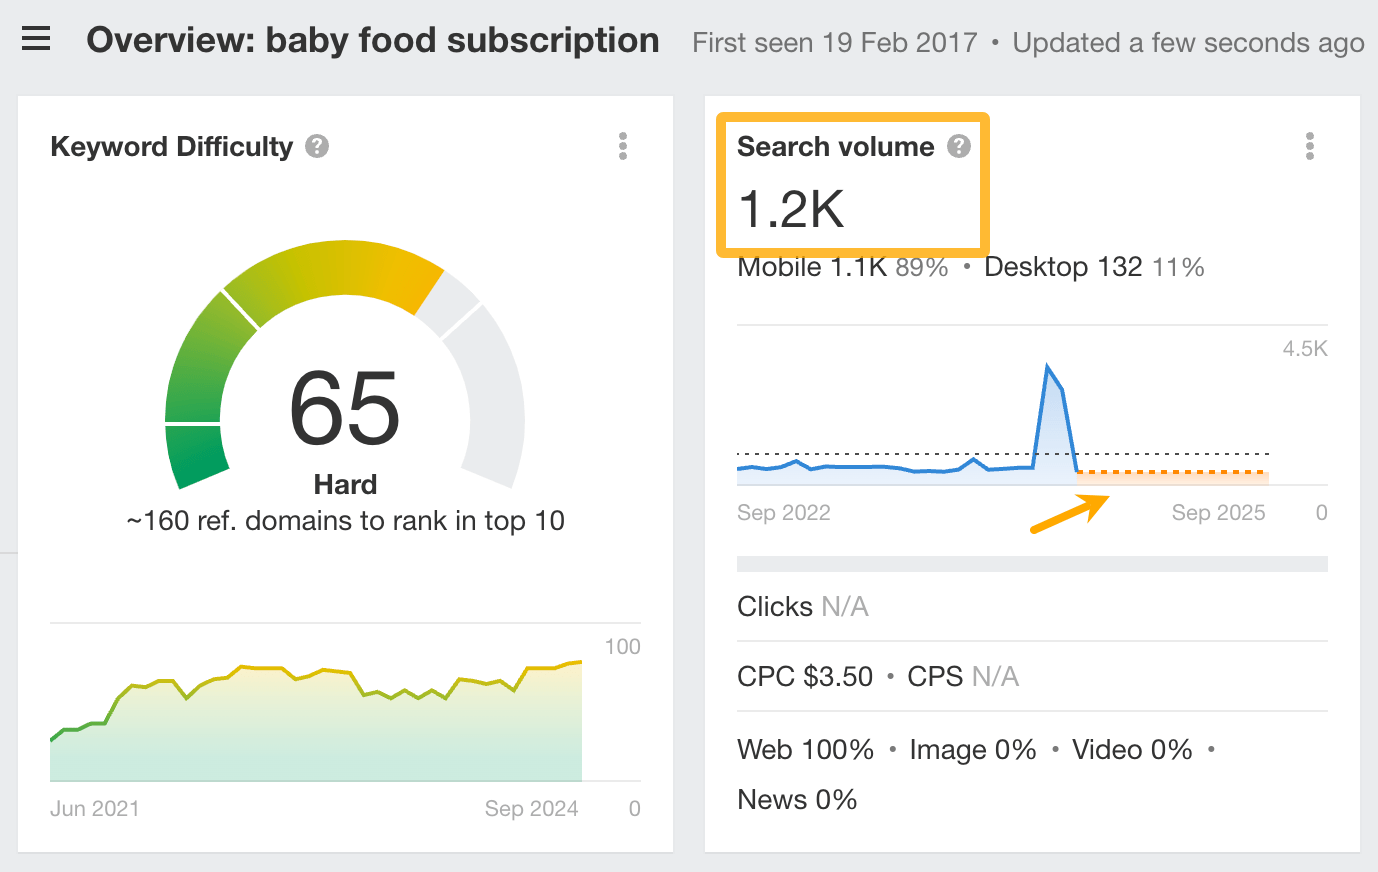
If you’d be planning to start a new business in this niche, you’d need compelling arguments to justify a high TAM estimate, because the current demand for this type of service appears to be relatively low.
Learn what people want and how they look for it
Keyword research can tell you what people want in which countries. All you need to know is a few broad terms related to your product.
For example, for plant-based products, you could just type in “plant-based, vegan” and then go to the Matching terms report to see the popularity of certain types of products. You can also see if the demand for these products has grown or fallen over the last three months.
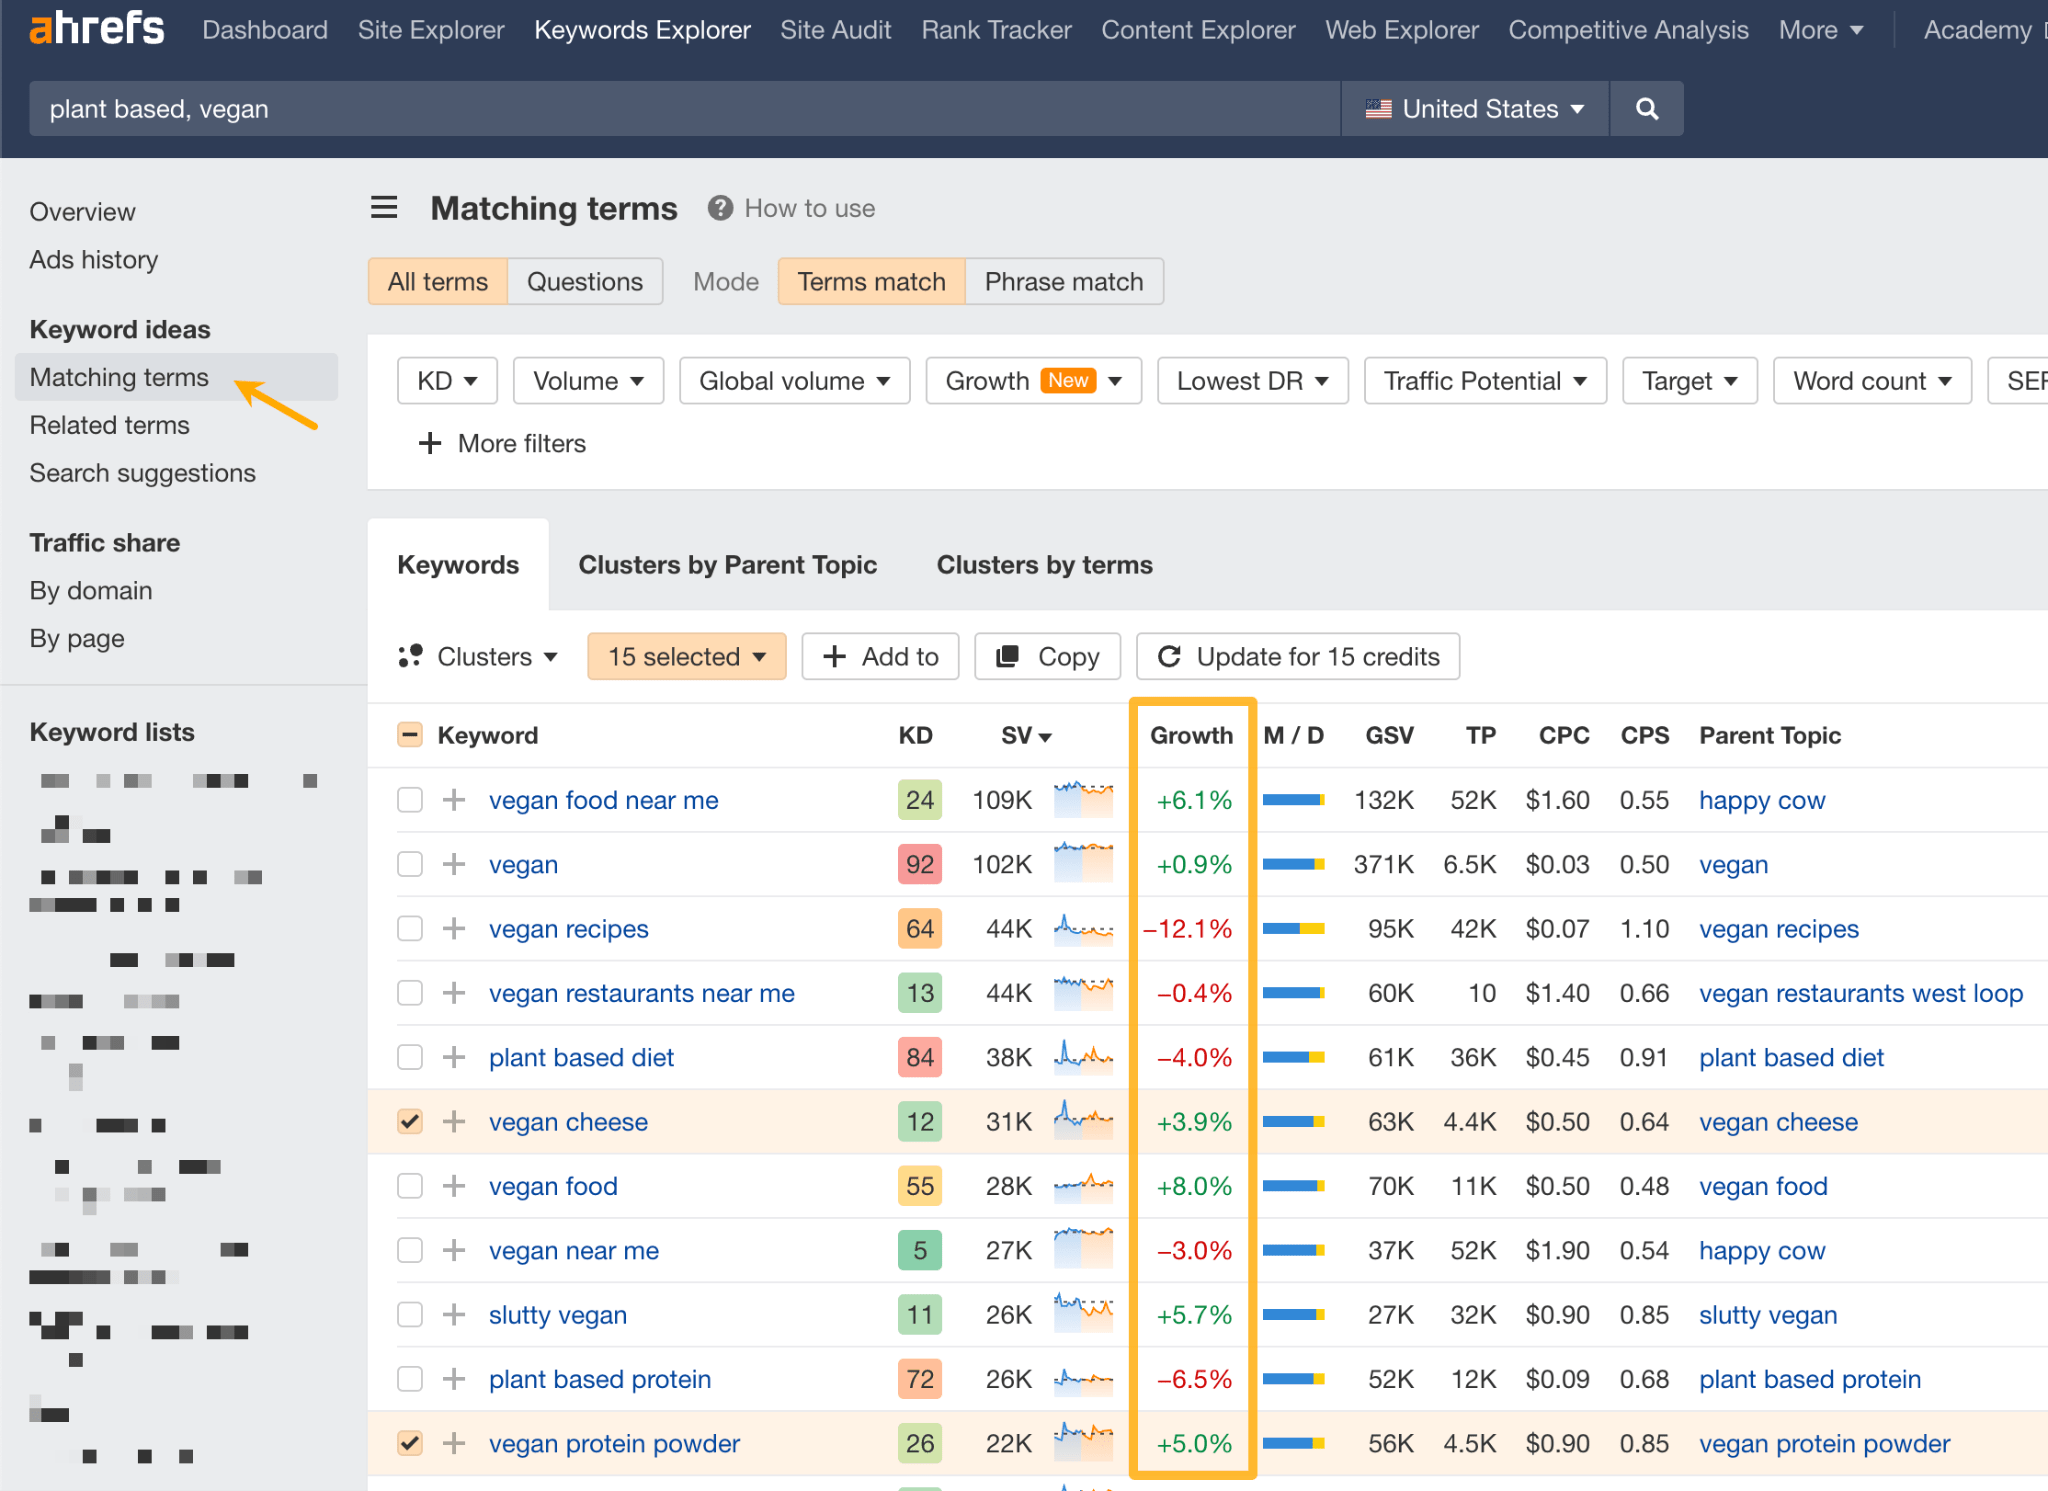
So, if you find that the demand for most vegan products has increased, you could assume that your TAM is going to expand in the near future because more people seem to be interested.
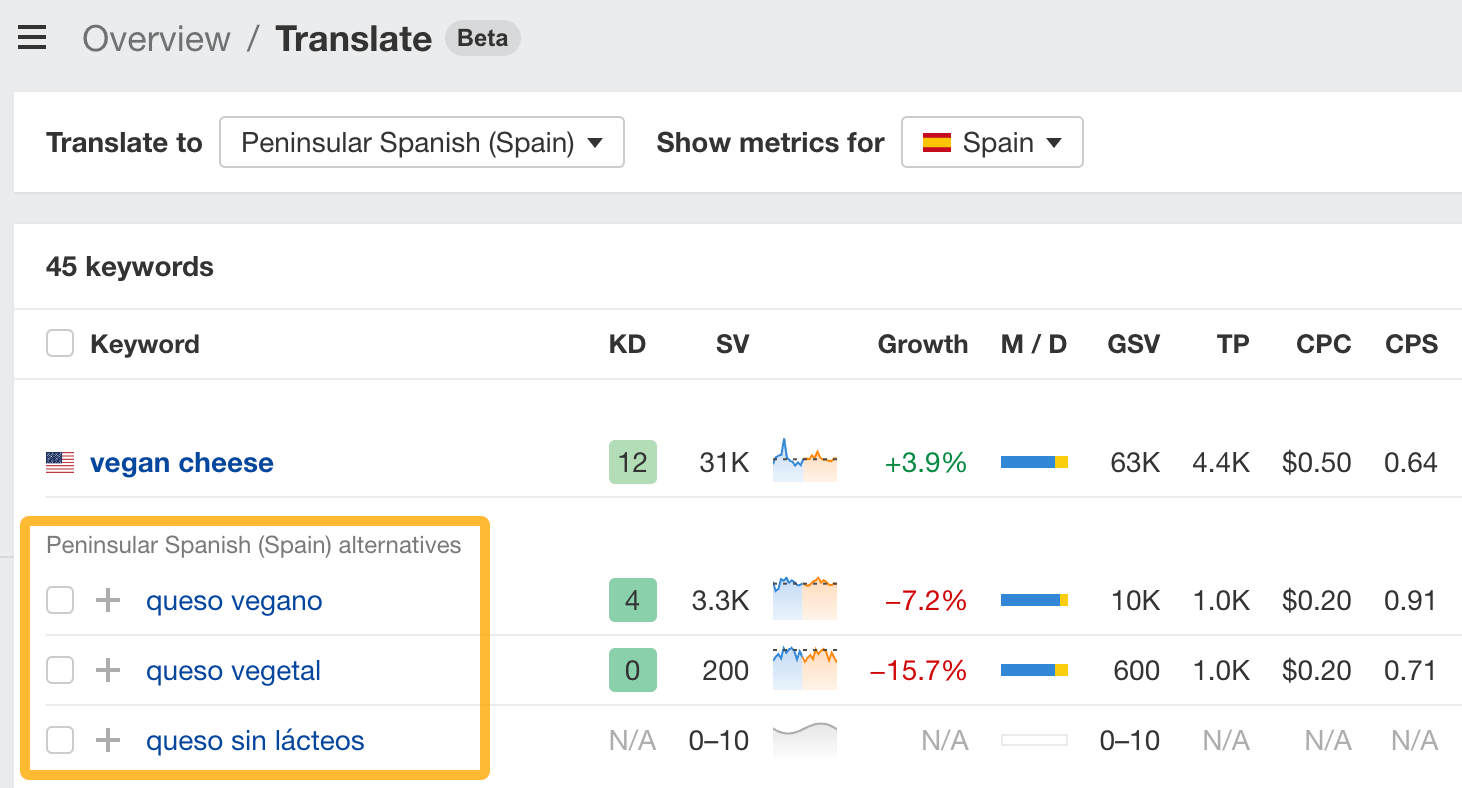
You can also use the tool to automatically translate these keywords and see what search terms people use to find the same products around the world and how popular they are.
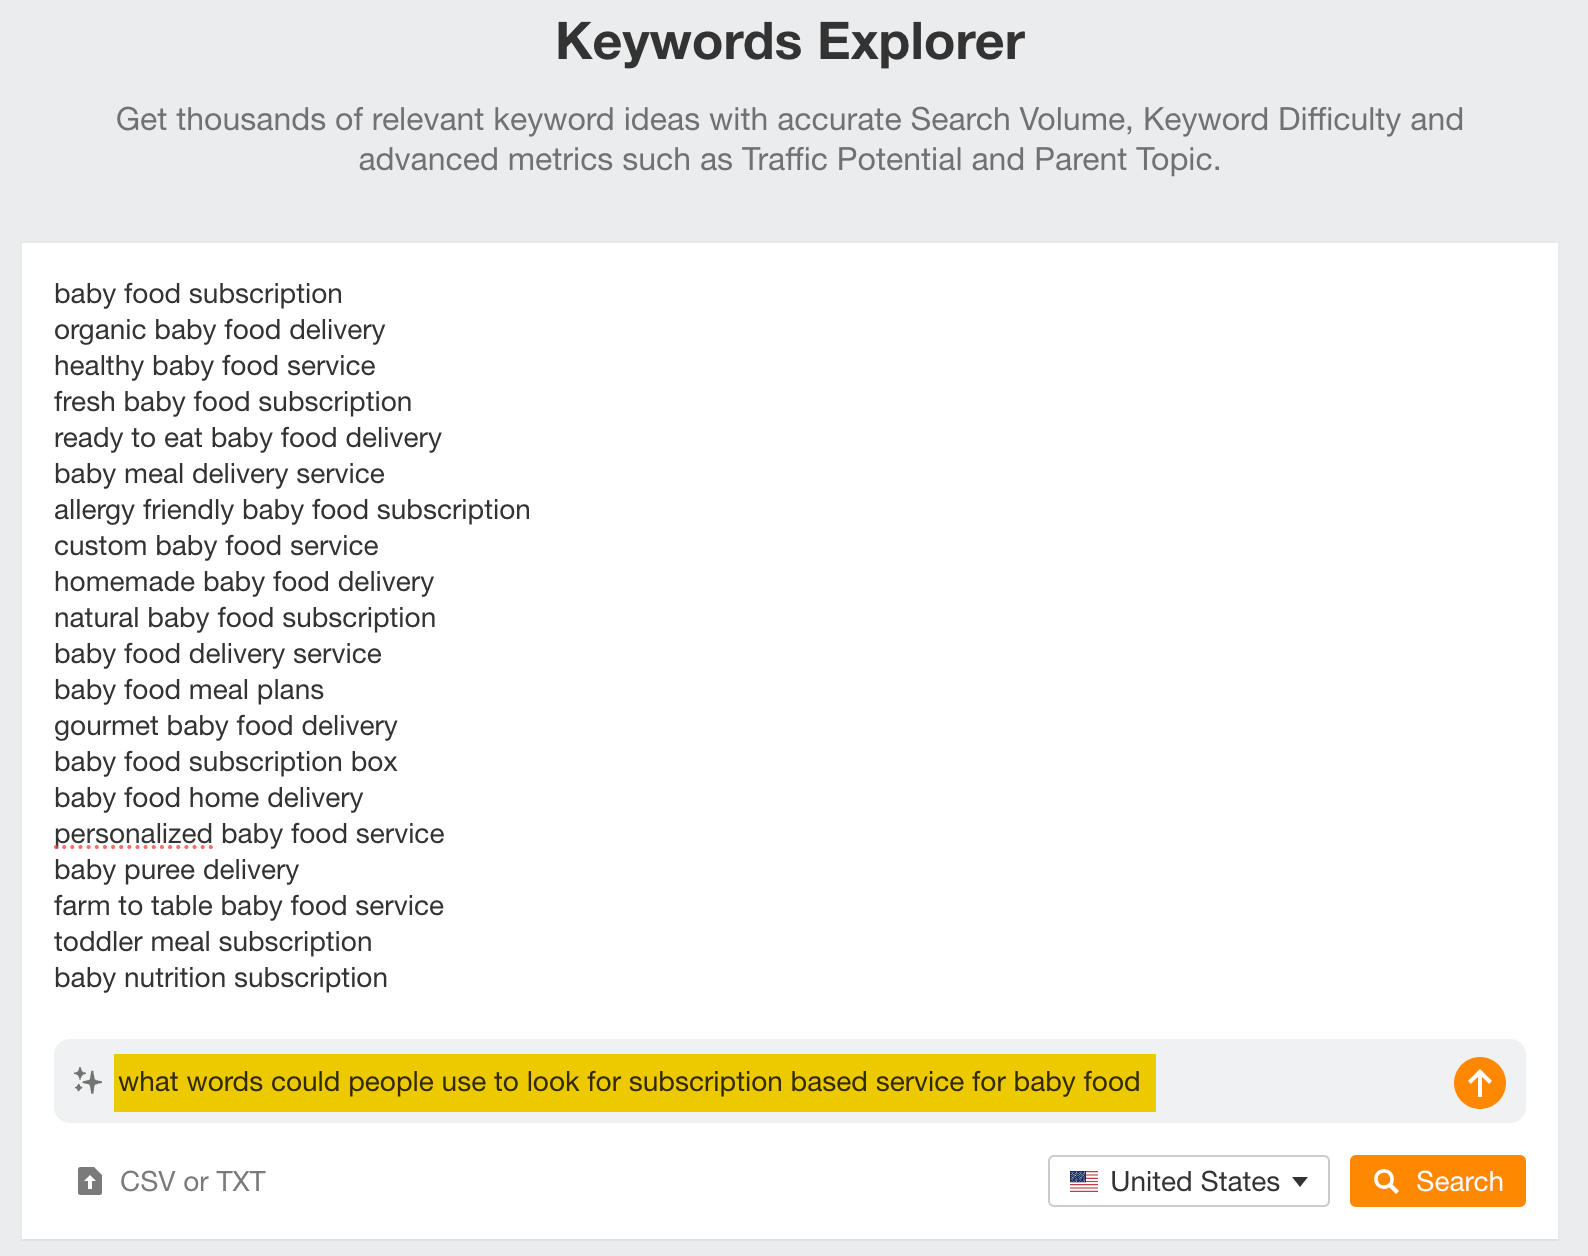
And if you’re unsure what keywords people could use to find a product or service like yours, just use the AI suggestion feature.
Learn from your competitors
By studying the keywords your competitors are targeting, you can uncover untapped niches or areas where demand is high but competition is lower.
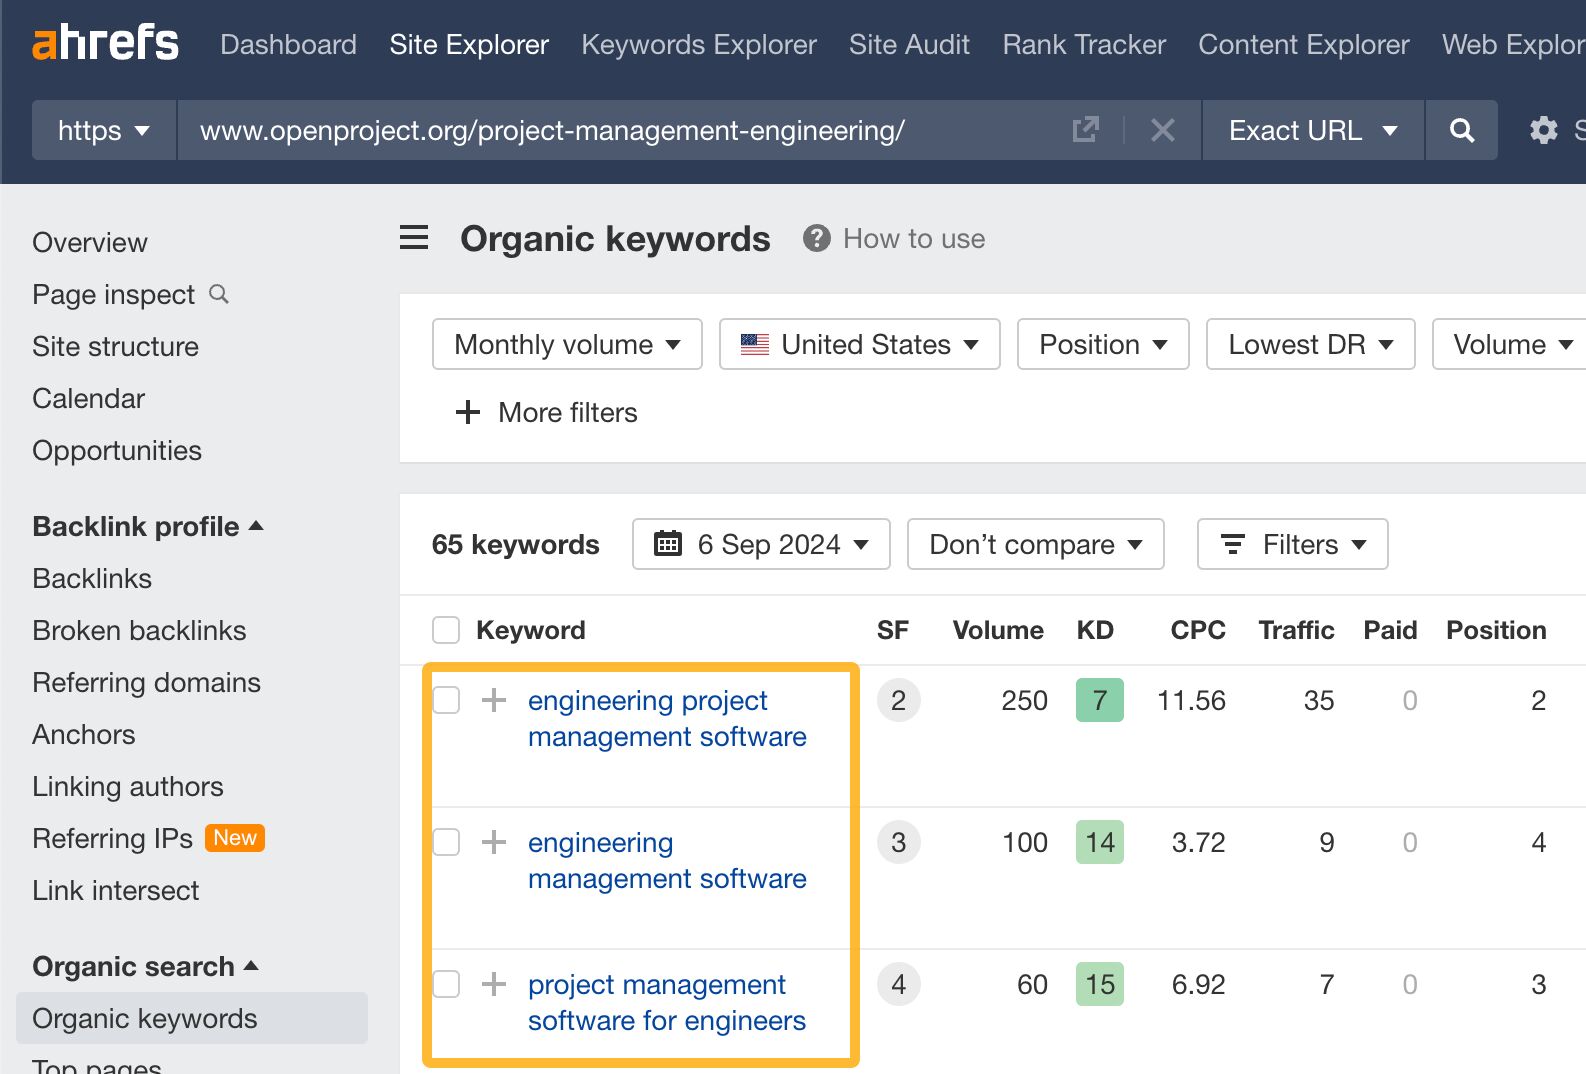
For example, say you’re a SaaS company offering a project management tool. If you used Ahrefs’ Site Explorer, you would find that one of your competitors ranks for terms like “engineering project management software”. This could indicate a niche market with unique needs, where there’s considerable demand but less competition.
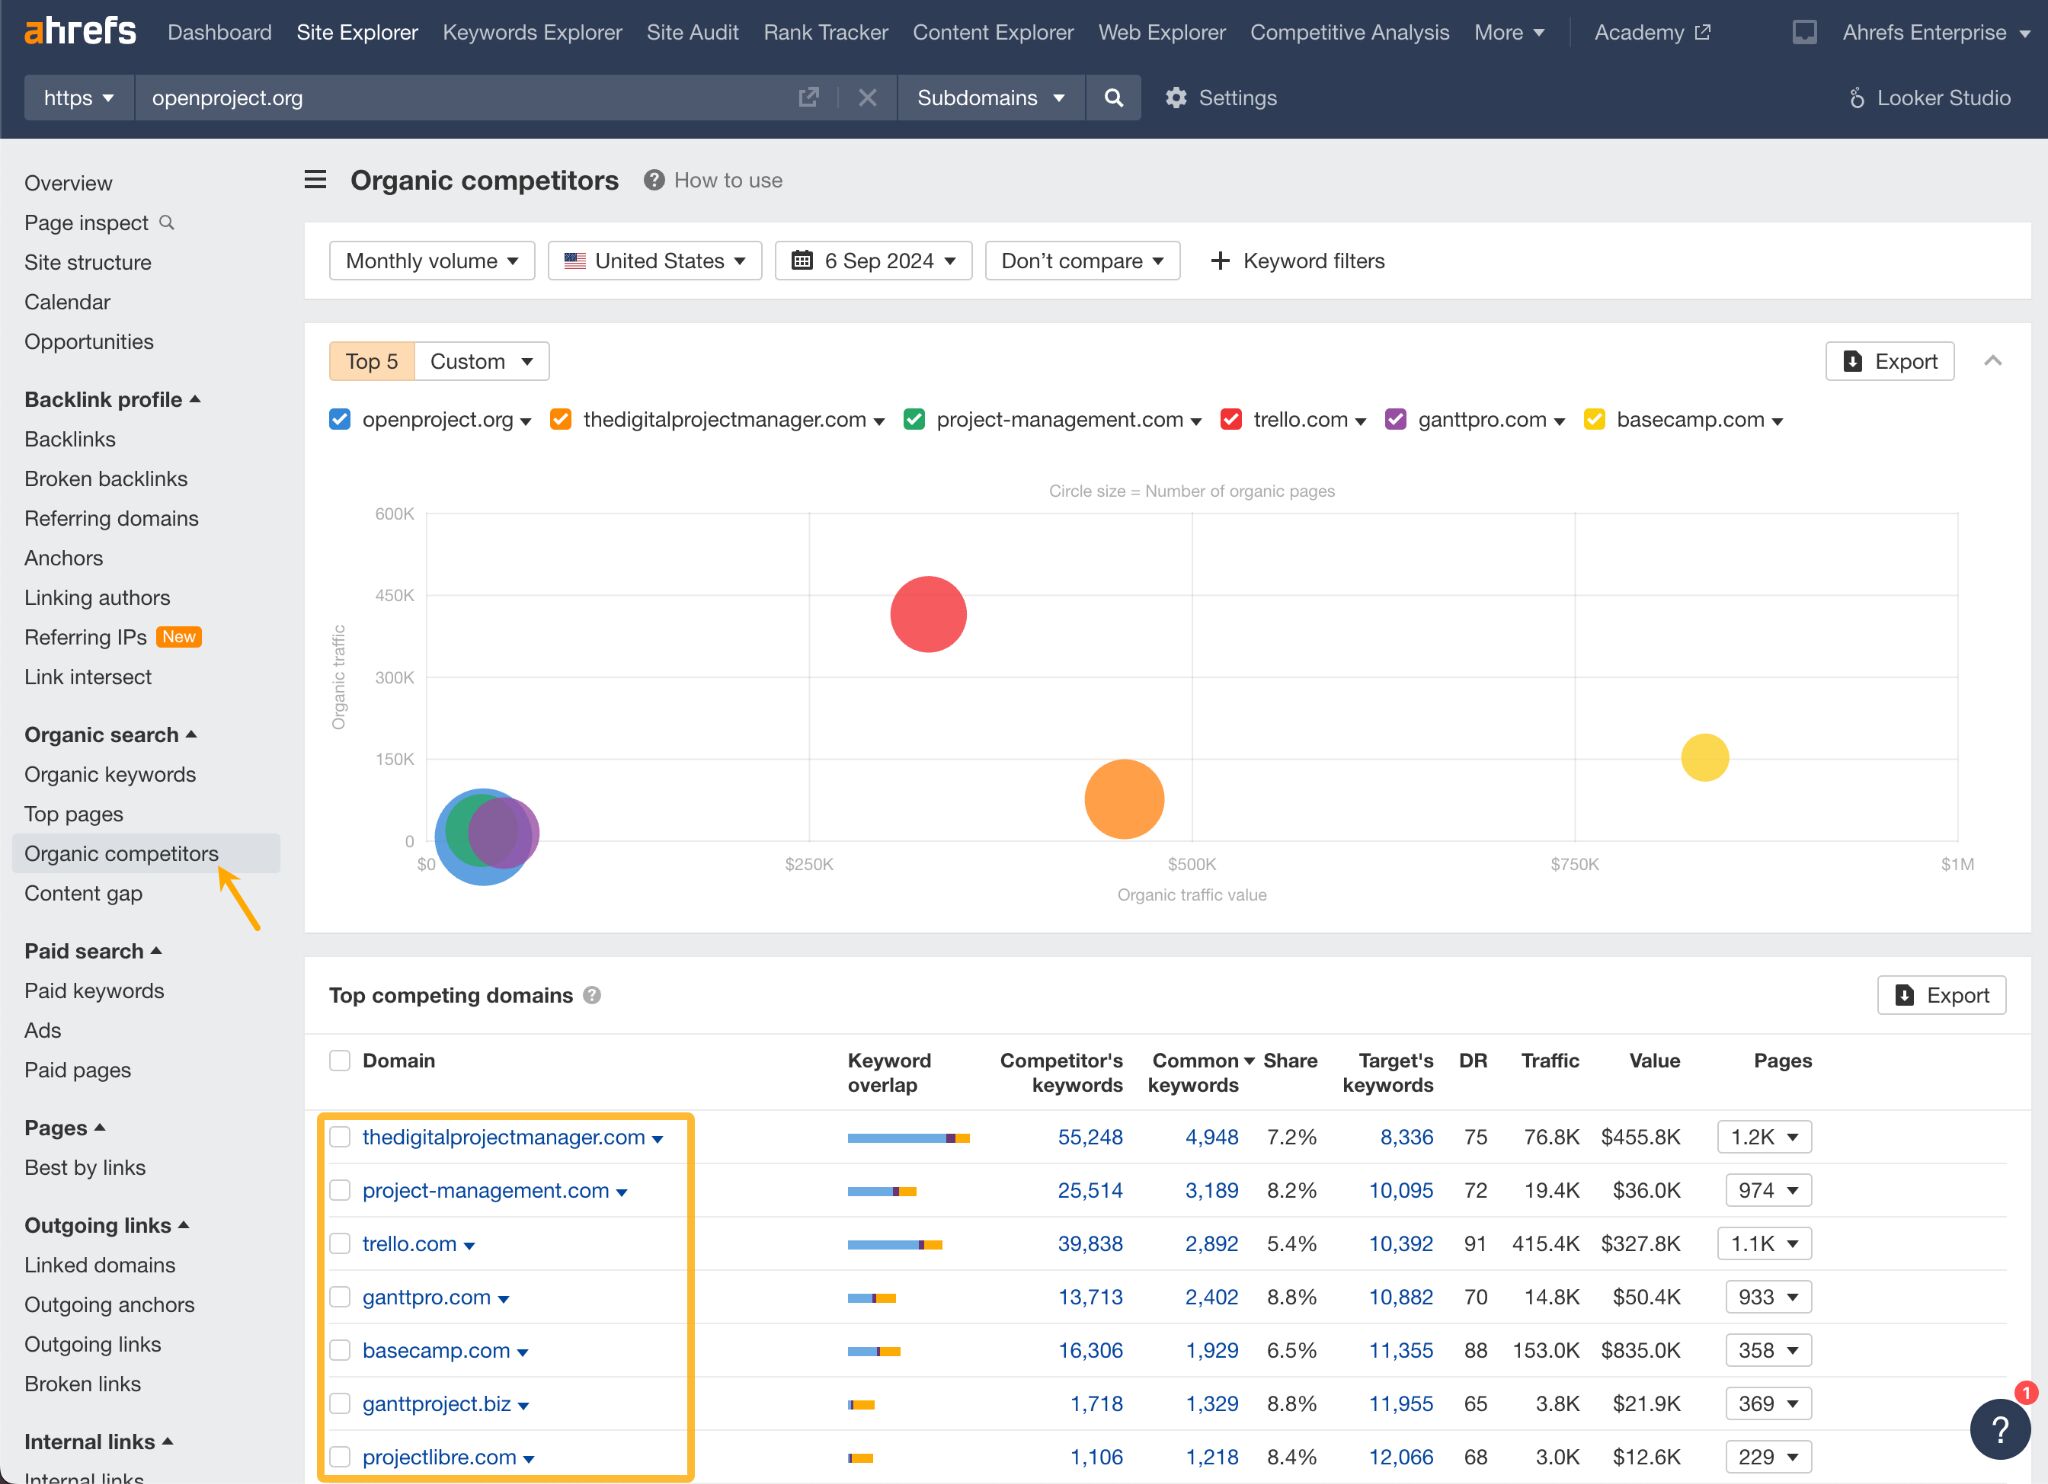
While you’re at it, go to the Organic Competitors tab to see who else competes for the same audience. Chances are, you may find some new potential competitors.
Use S-1 filings and quarterly reports from public companies
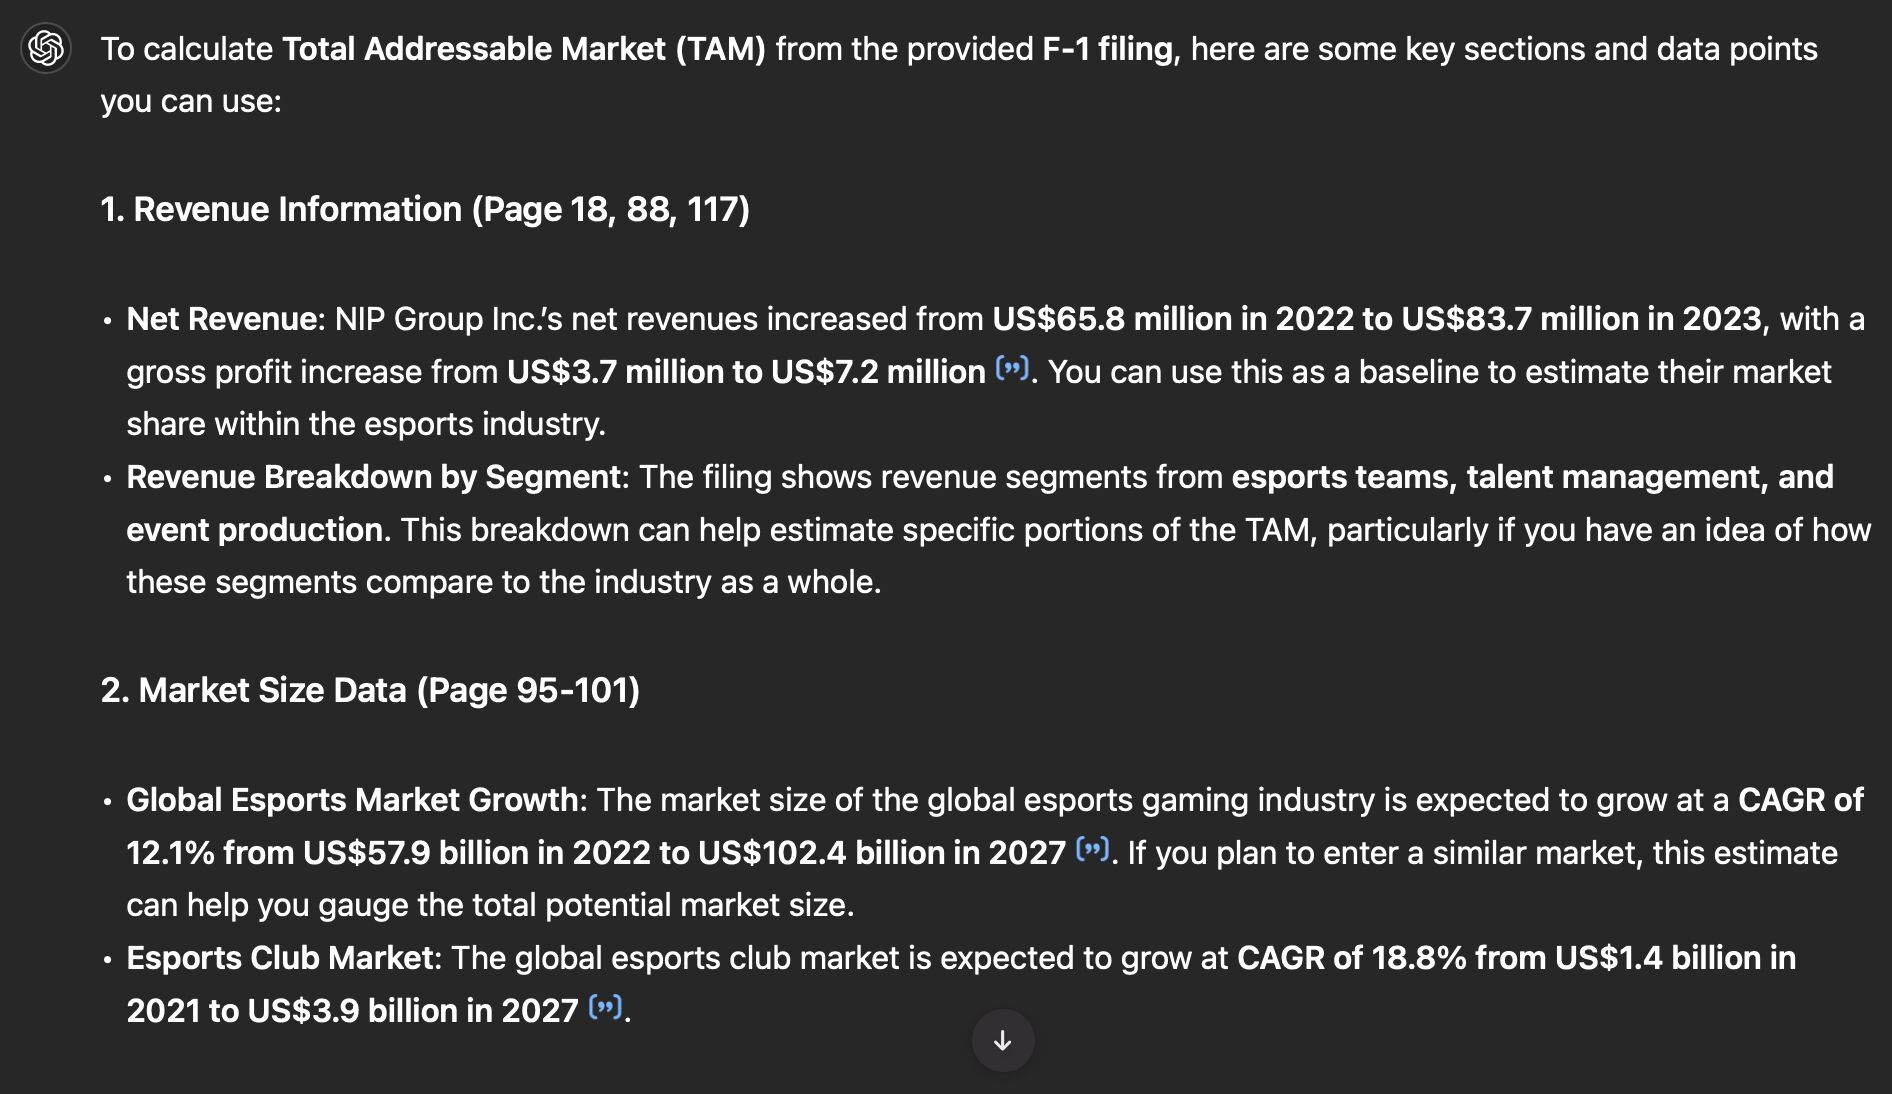
Public companies’ quarterly reports (10-Q) and S-1/F-1 filings offer rich data for estimating TAM. They provide detailed breakdowns of revenue by product line, geographic region, and market segment, along with insights into market share and growth potential.
For example, if a company generates $500 million from a particular service and claims 10% of the market, you can estimate the TAM at $5 billion.
Both reports can also provide guidance on future growth trends, helping forecast your TAM’s evolution.
You can use AI like ChatGPT to analyze the documents for you (they can be quite complex). Here’s a sample analysis of an over 500-page F-1 filing by an Esports company.
Interview potential customers
While reports give you big numbers, talking to real people gives you the practical insights needed to adjust those estimates.
- By speaking directly to customers, you can gauge whether they actually need your product and how likely they are to adopt it.
- Interviews help you narrow down the customer segments most interested in your solution. Maybe not everyone is a fit, but if certain industries or company sizes show more interest, you can focus your TAM on those segments.
- Asking customers what they’d actually pay for your product gives you real data. If you know what your target customers are willing to spend, you can multiply that by the number of similar customers to estimate your revenue potential and refine your TAM.
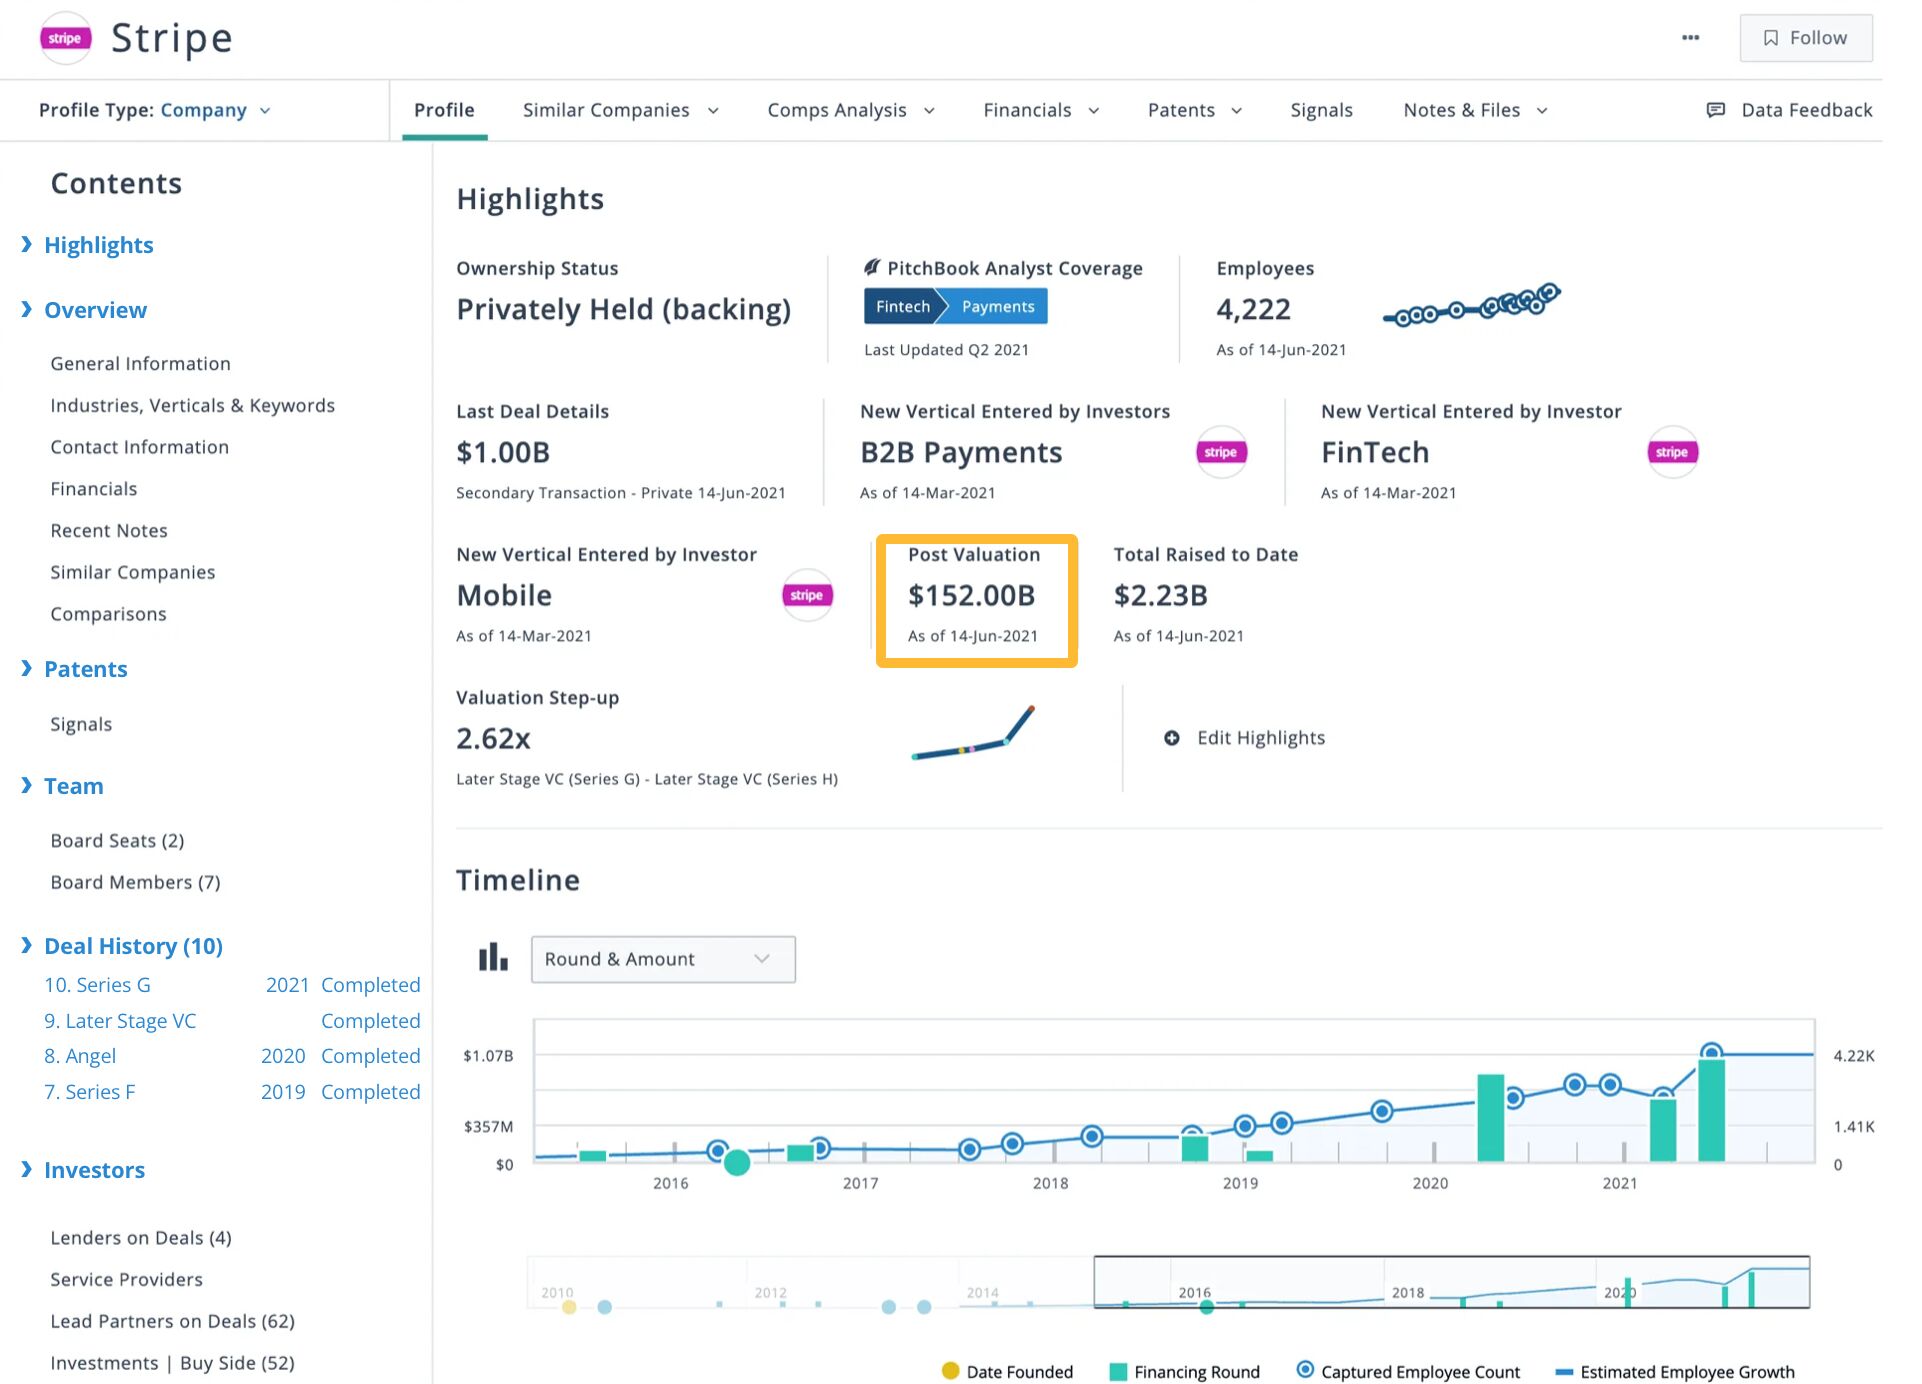
Use PitchBook for investment and market data
PitchBook offers broader market data and investment trends. It provides reliable information on market valuations, funding rounds, and industry growth, which helps you gauge the overall size and growth potential of a market.
PitchBook also helps identify key players, making it easier to estimate how much of the market is currently being captured and what remains untapped.
For example, based on Stripe’s post-valuation of $152 billion and an assumed 30% market share, Stripe’s TAM would be approximately $506.67 billion (TAM = valuation/market share).
Other tools for SaaS companies
If you’re in SaaS, there are a couple more sources of data you may find especially useful: BuiltWith and Latka SaaS Database.
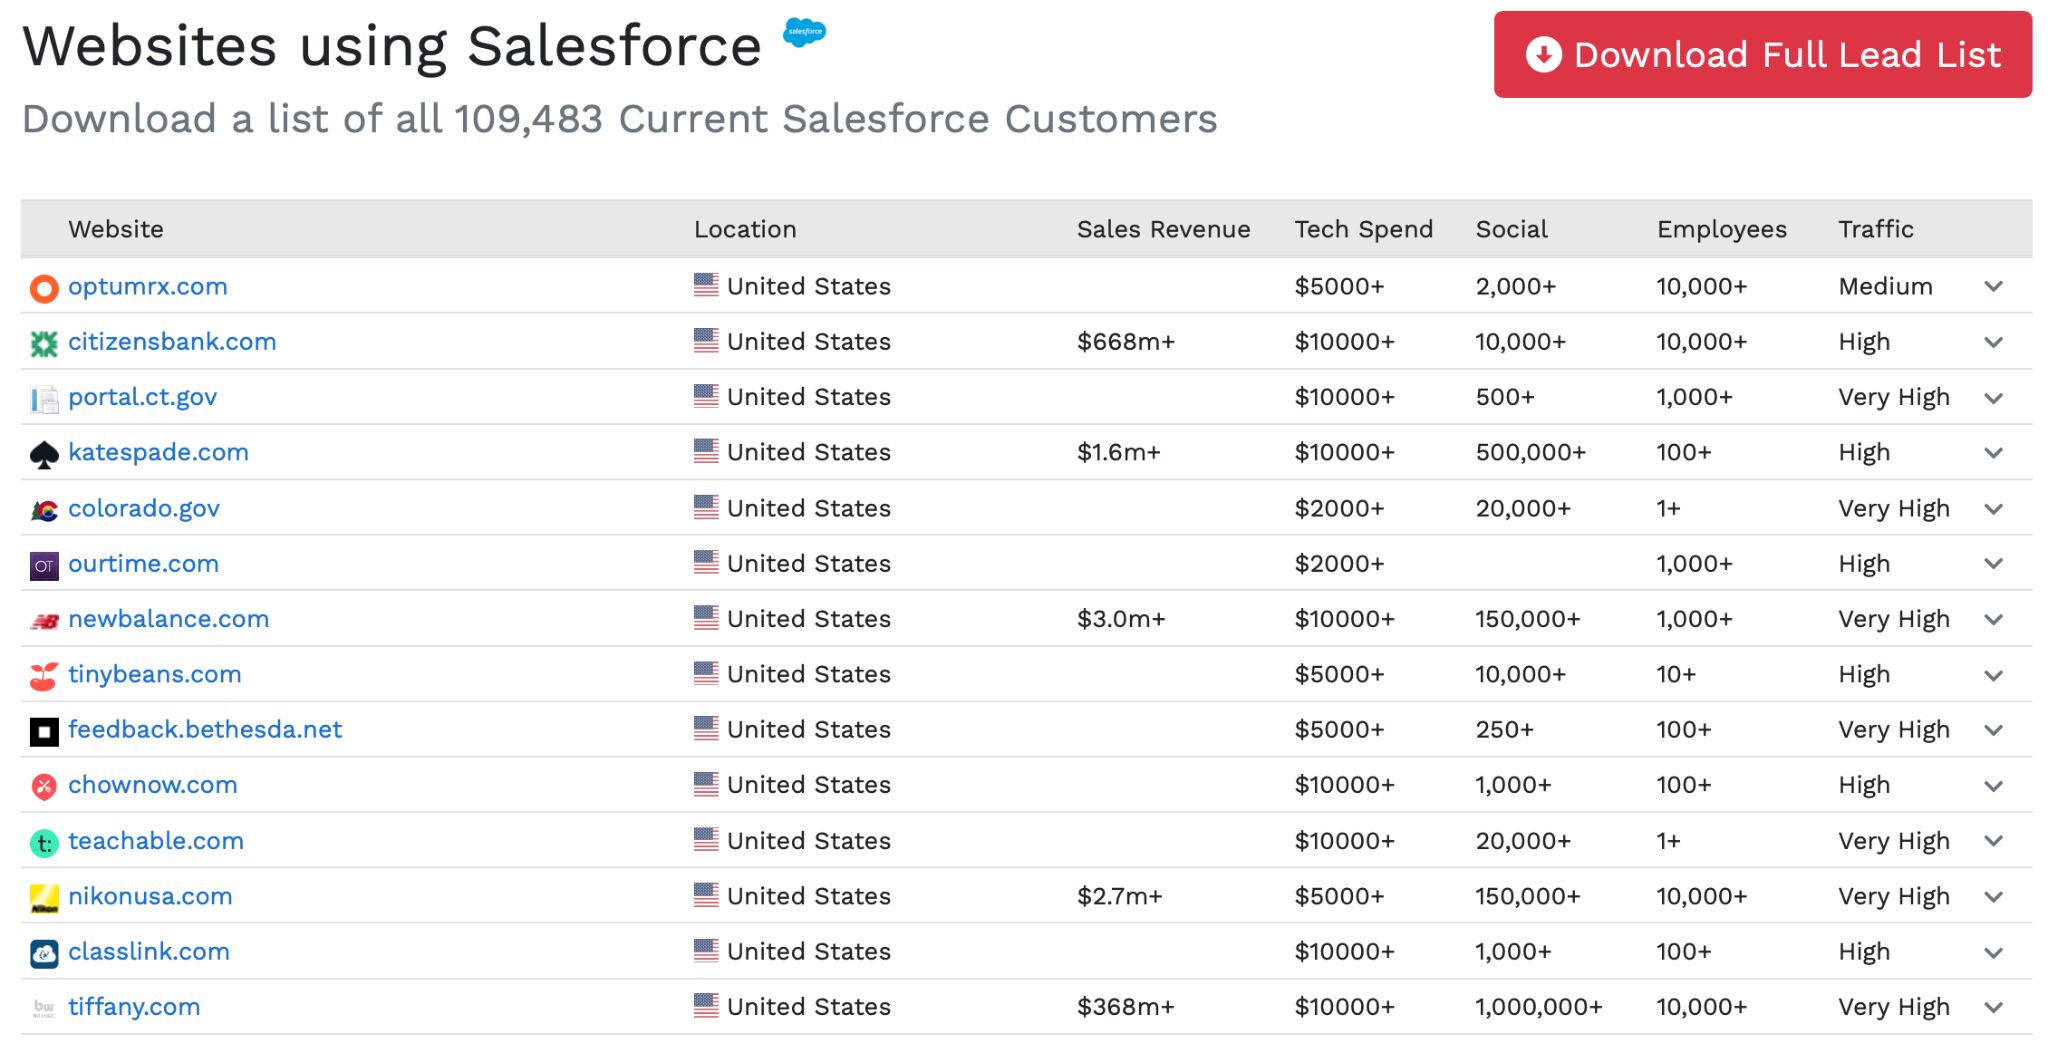
BuiltWith is a tool that shows you what technologies websites are using. This tool is great for identifying your ideal customer because you can see which companies use certain tools or platforms that align with your product.
The Ideal customer profile (ICP) is a detailed description of the type of company or person who would benefit most from your product or service. It’s helpful mostly for a bottom-up approach to calculate market size, as it helps you focus on the specific segments of the market that are most relevant to your business.
Enter a competitor into BuiltWith, and look for the list of their customers. For example, here are some of the sites that use Salesforce. You can sort the list by employees or traffic to find the size of the company you think you could get on board.
The next one is Latka SaaS Database. If you can’t find a SaaS company on PitchBook or BuiltWith, there’s a chance you will find it on Latka. It’s a SaaS-specific database that tracks metrics like revenue, customer growth, churn rates, and funding for thousands of companies.
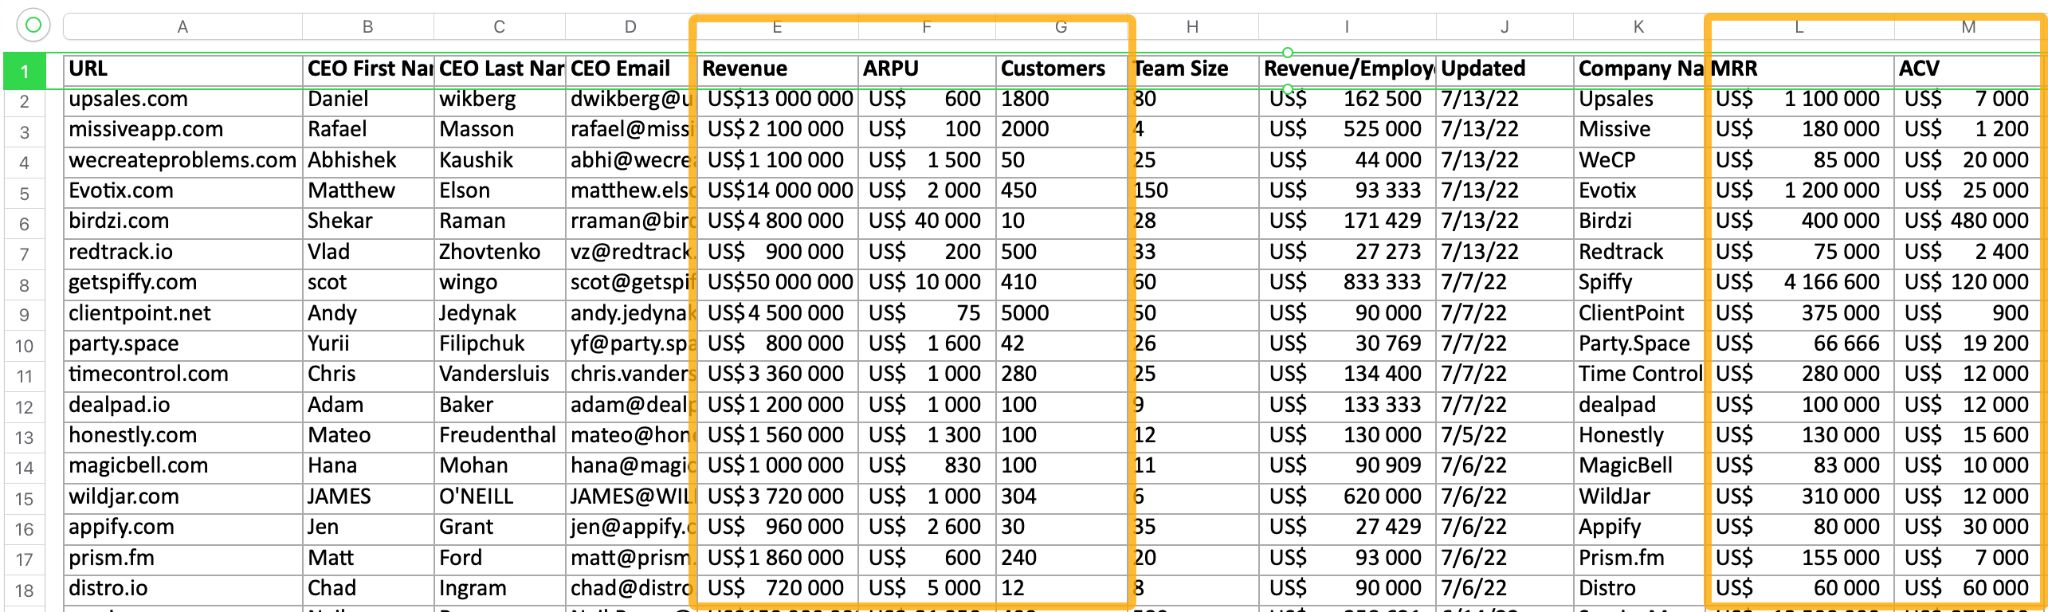
Knowing your competitors’ revenue and the number of customers they serve can help you better estimate the size of your potential market.
- Use competitors’ ARPU or ACV (Annual Contract Value) to estimate your own future metrics.
- Use the competitor’s revenue or valuation and apply a market share estimation to calculate TAM.
Final thoughts
Remember, TAM is ultimately an estimation. It’s natural to be slightly off, and you’ll probably need to reevaluate every year, after significant changes in the market or after introducing new products.
Generally, TAM calculations are not very accurate. At best, you’re relying on partially known variables (number of potential customers and average lifetime customer value). Industries also change so quickly that TAM calculations can become irrelevant within a matter of months.

What’s perhaps more important than the exact number is the methodology behind your TAM calculation. A well-thought-out approach demonstrates how seriously you take the business and the effort you’ve put into understanding the market.
Got questions or comments? Find me on LinkedIn.