Our report builder allows you to create your own reports using widgets from Ahrefs’ Site Explorer and Rank Tracker data.
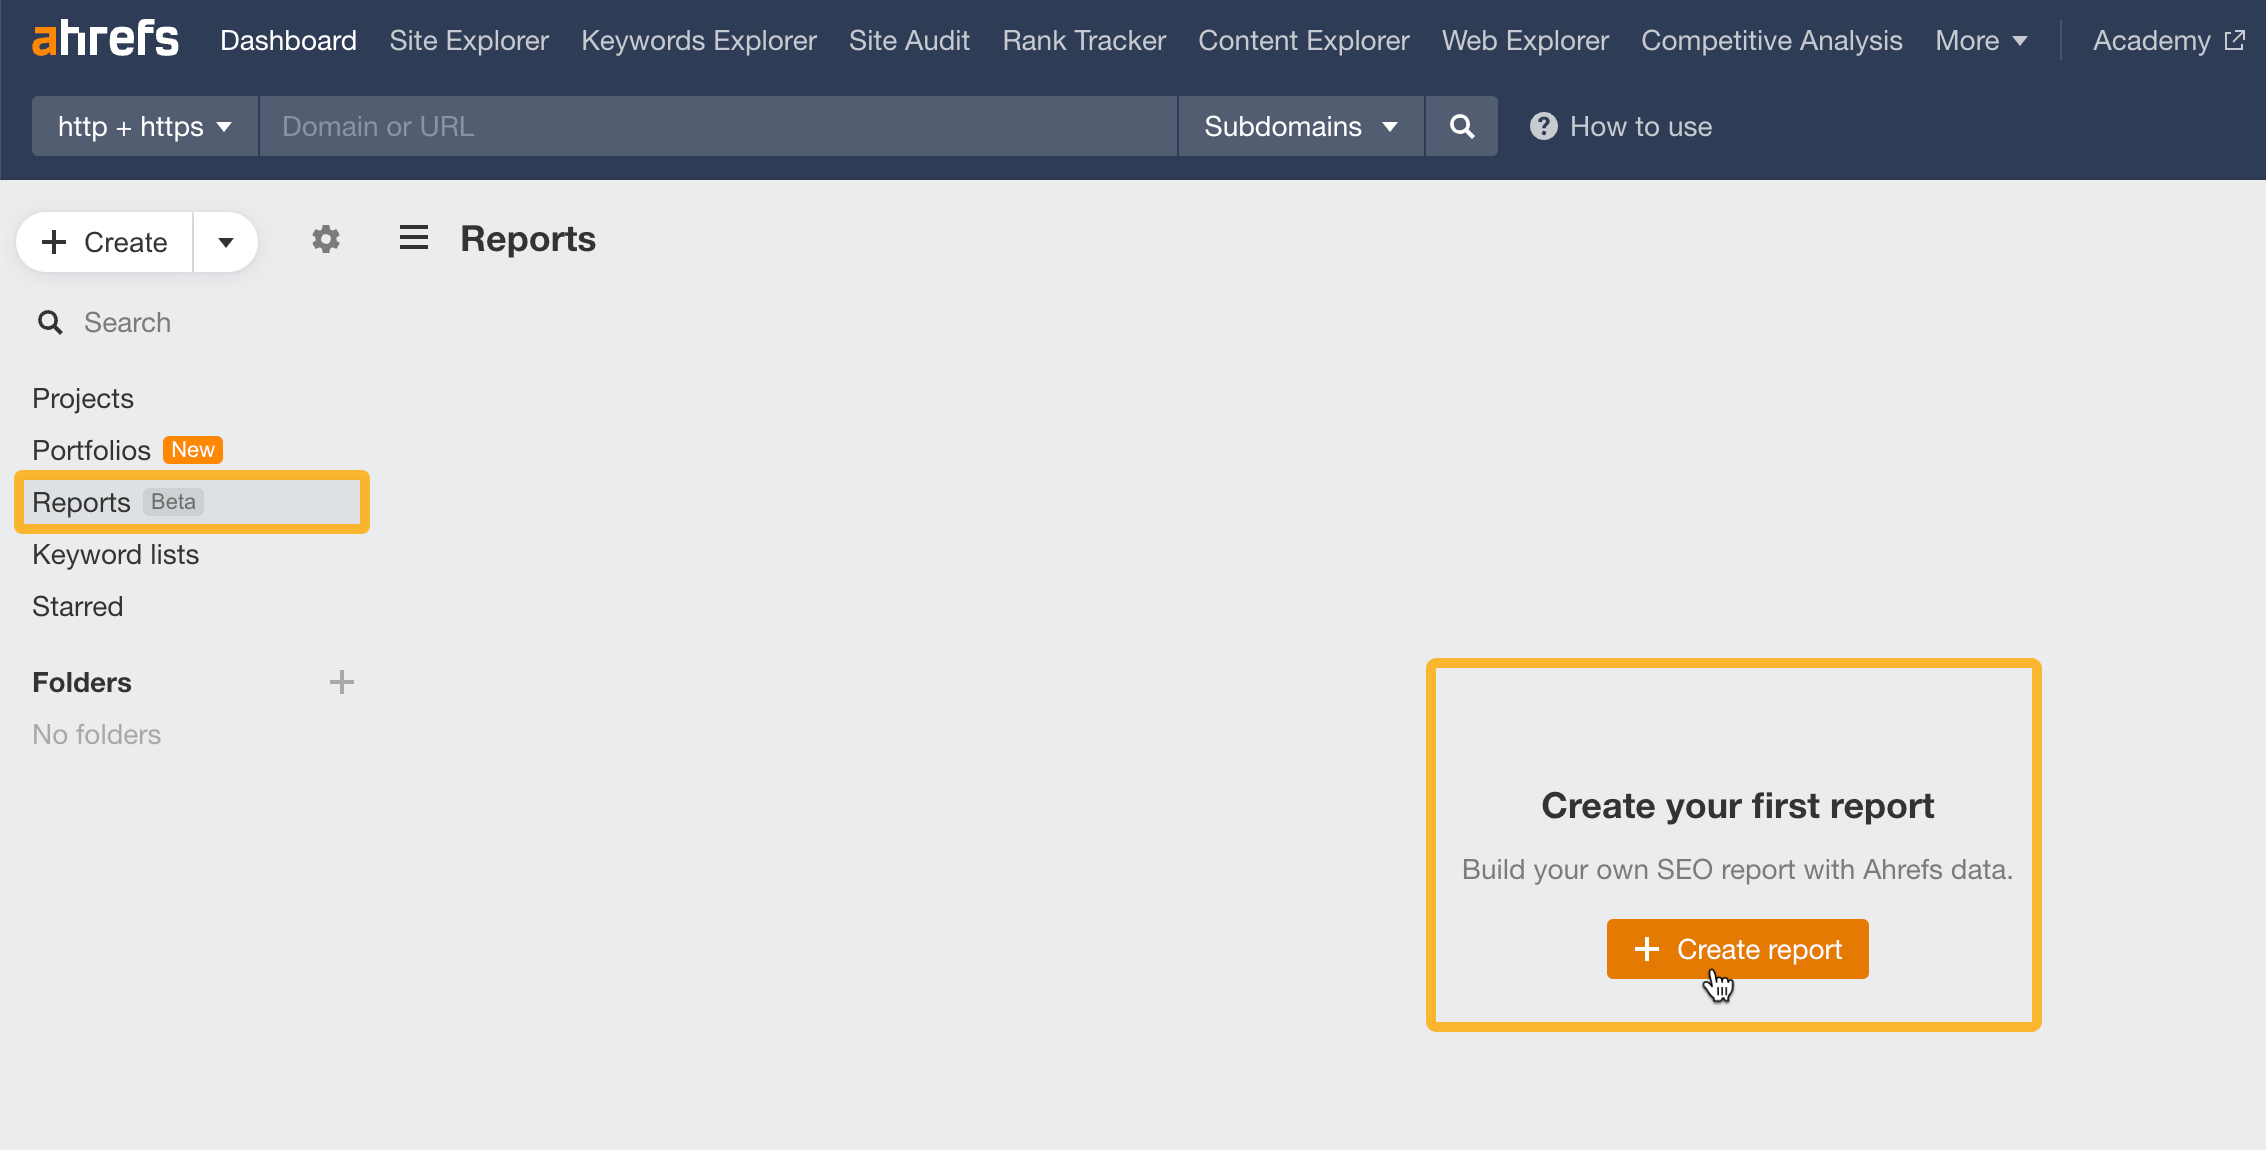
To add your first report, click on Create report. Or the Create dropdown on the left menu.
Once created, you’ll have a blank canvas where you can add widgets from: existing projects, portfolios, and custom targets.
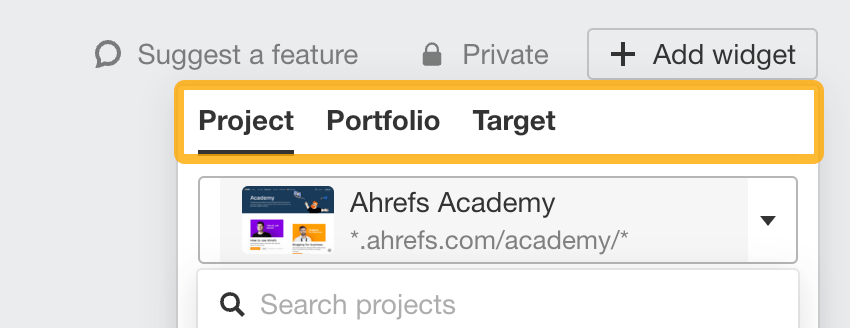
To add a widget, click on the Add widget button.
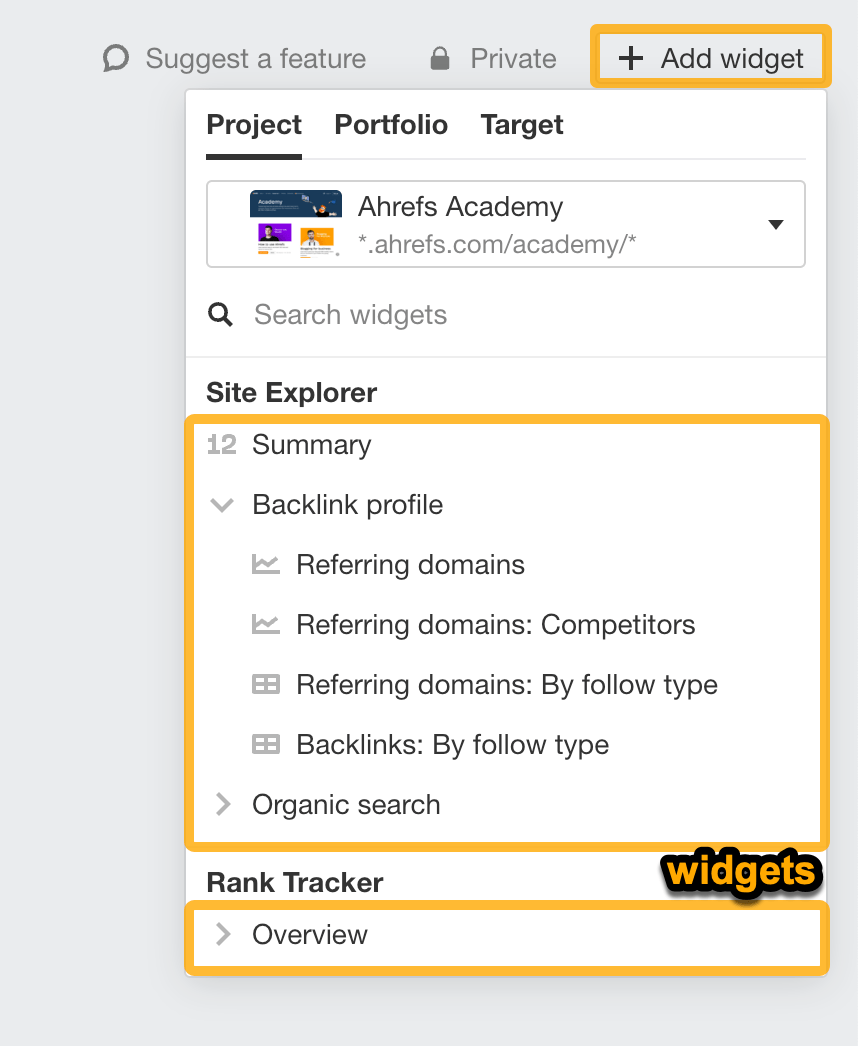
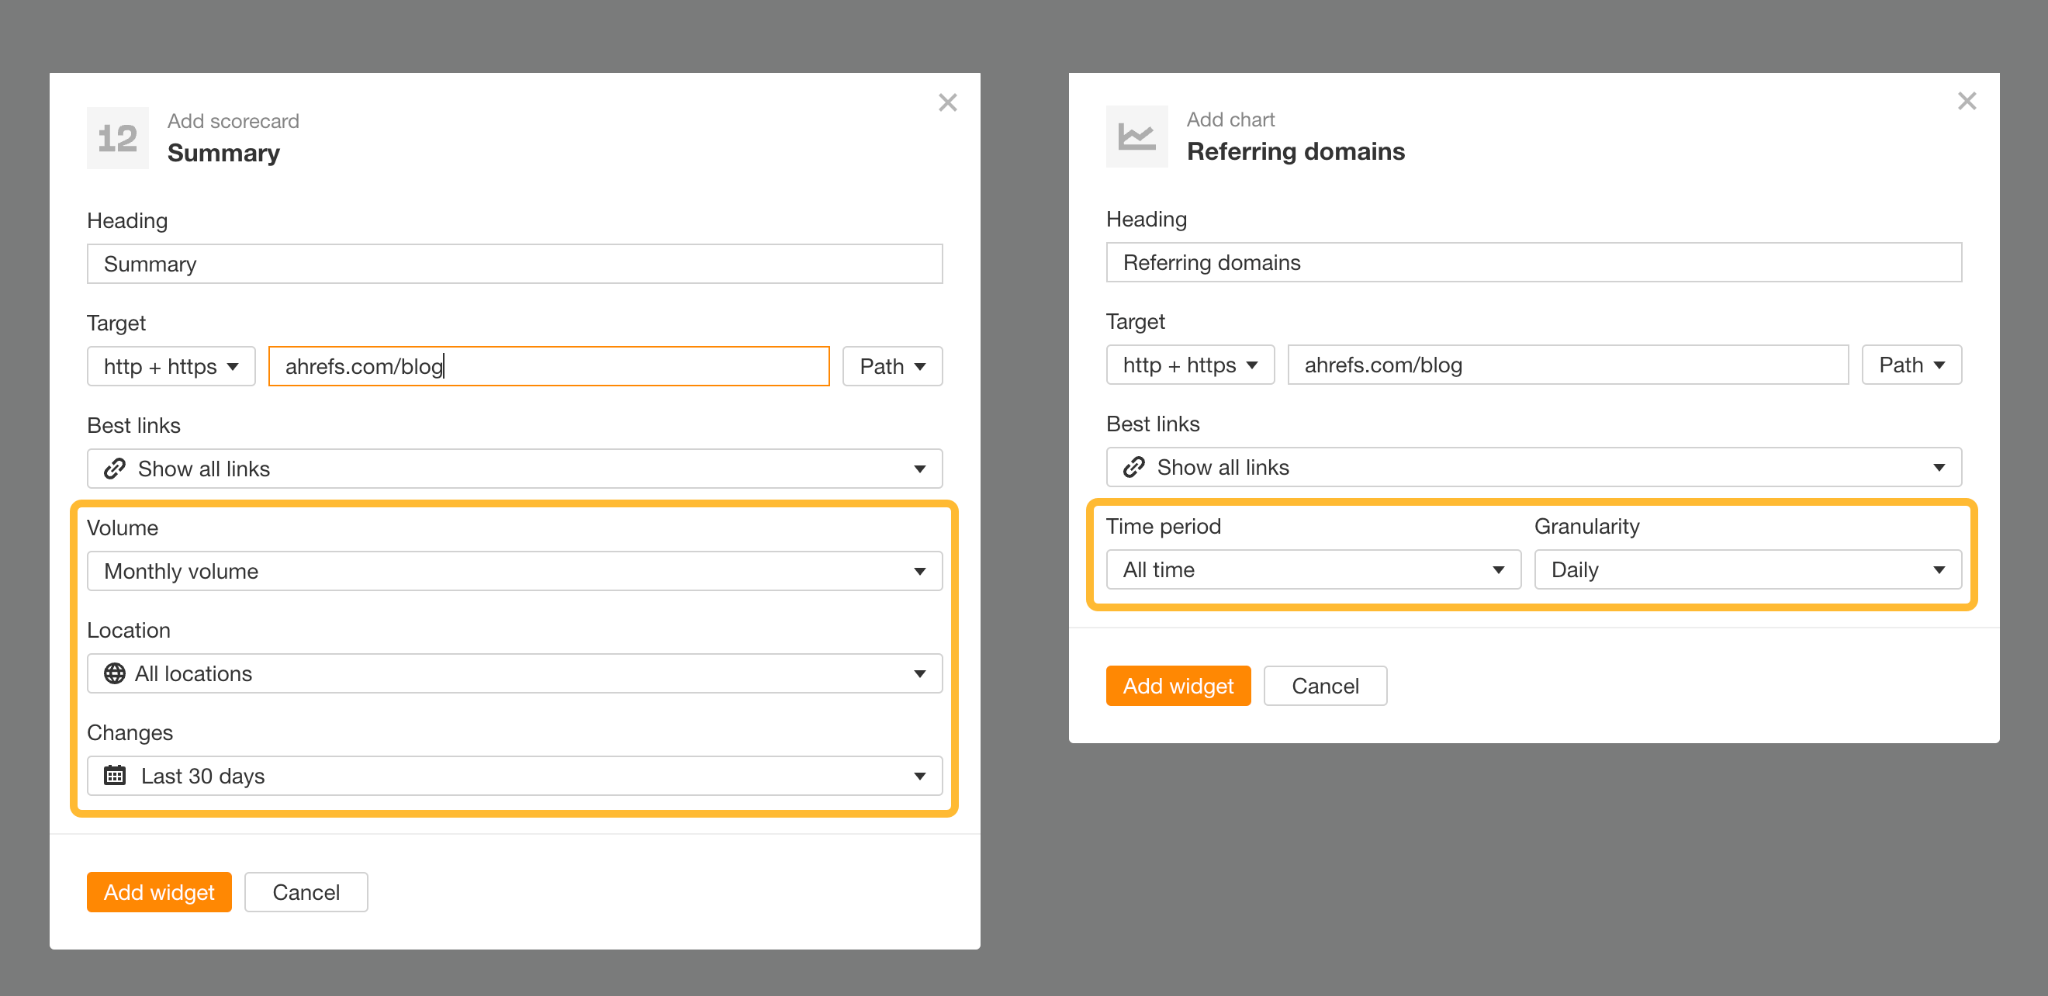
Depending on the type of widget, you can customize its:
- Heading name
- Target URL + path
- Volume
- Location
- Time period
- Data granularity
- Comparison date
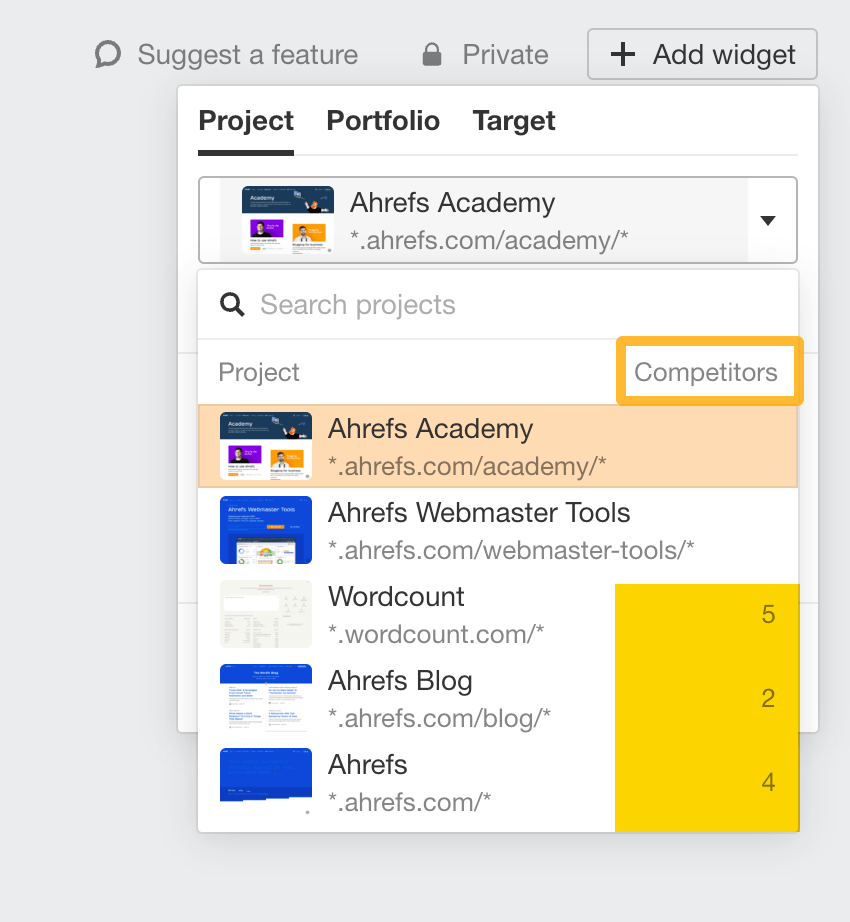
Competitors can be further edited as well. If there are none added, you will need to specify them in the widget settings.
Congrats, you’ve now added your first widget! Once you add more, you can rearrange them with a simple click and drag.
With so many widgets to choose from, here’s a bunch of reports you can start with:
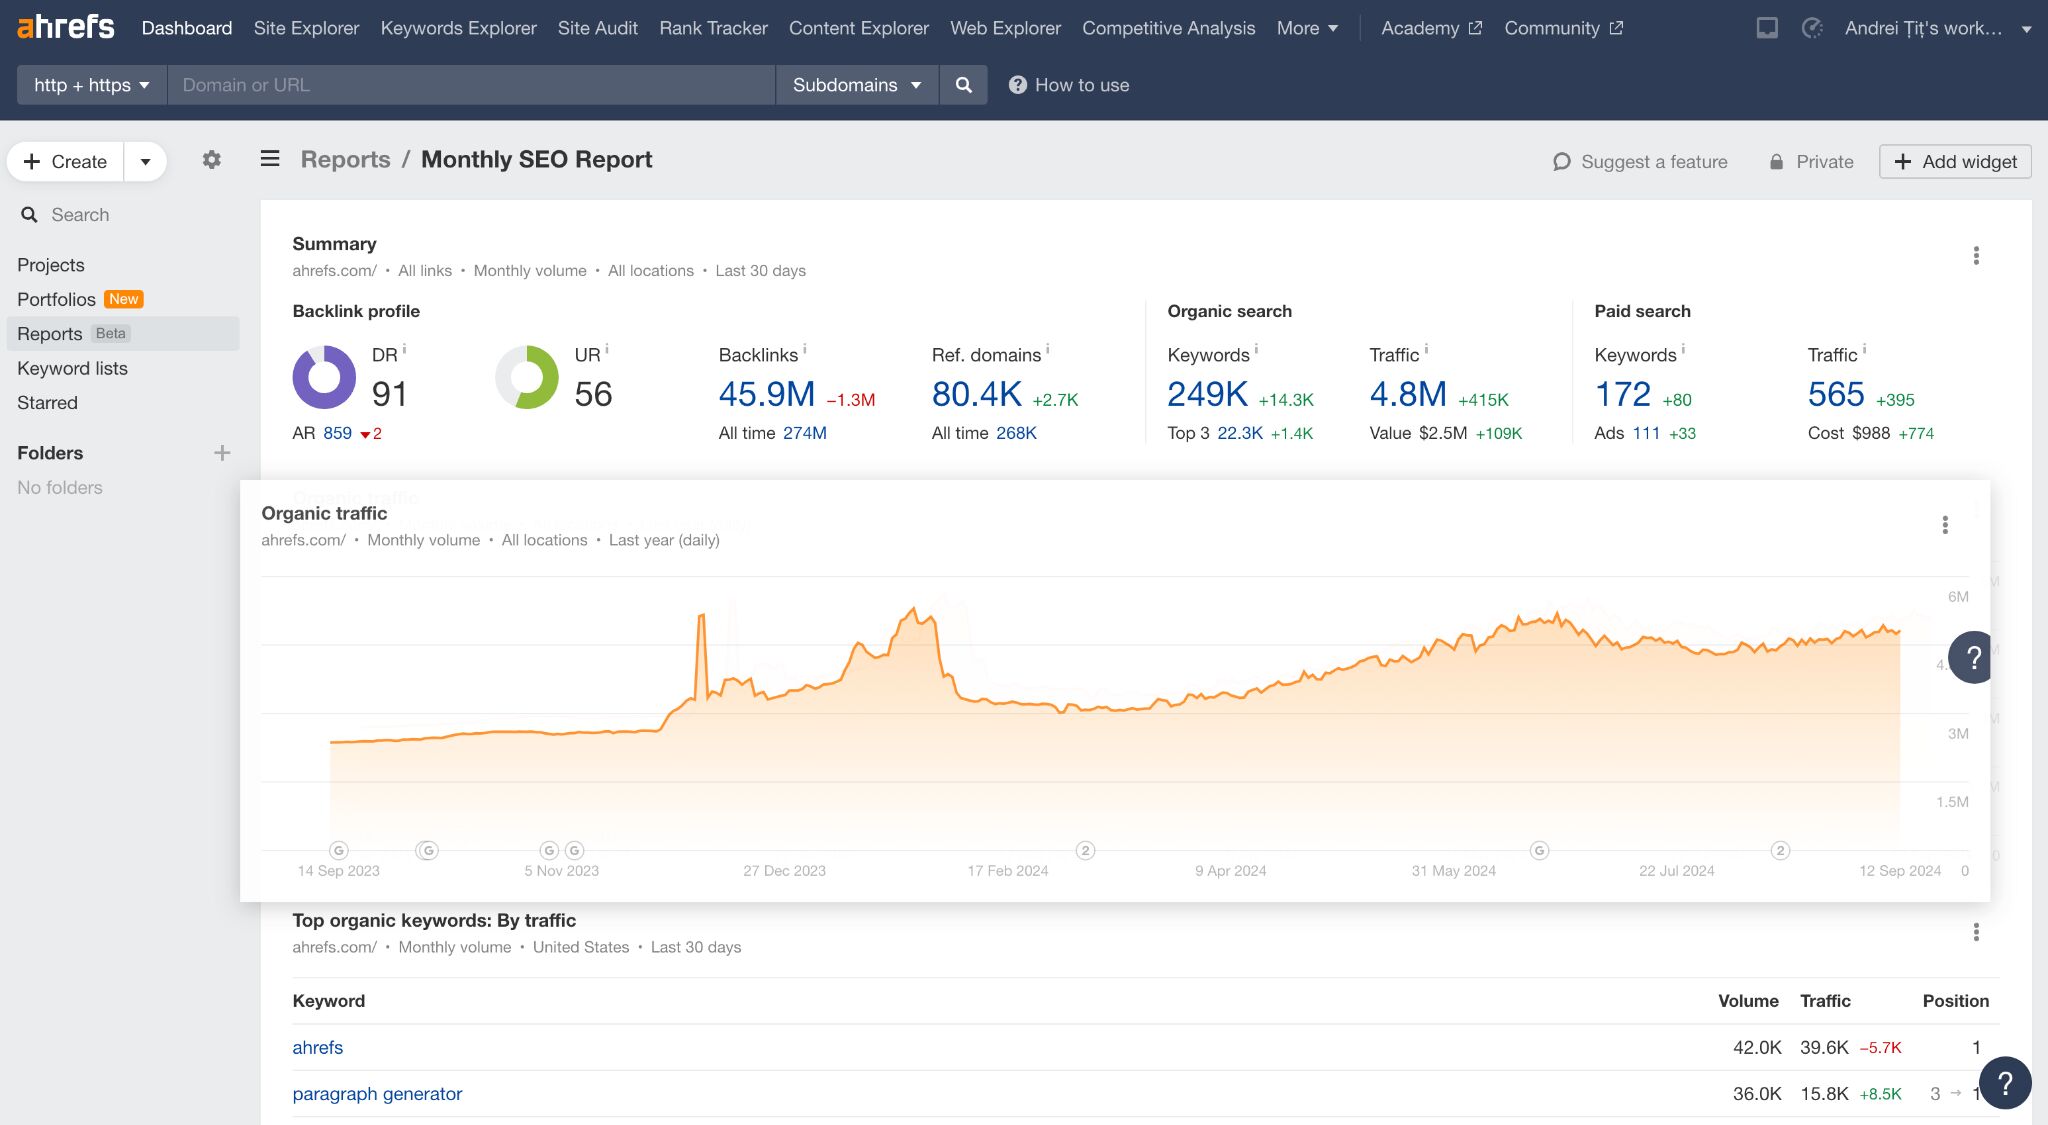
1. Monthly SEO report
This is a classic report where you summarize important metrics that reflect a client website’s organic search performance, backlink profile strength, and website health score.
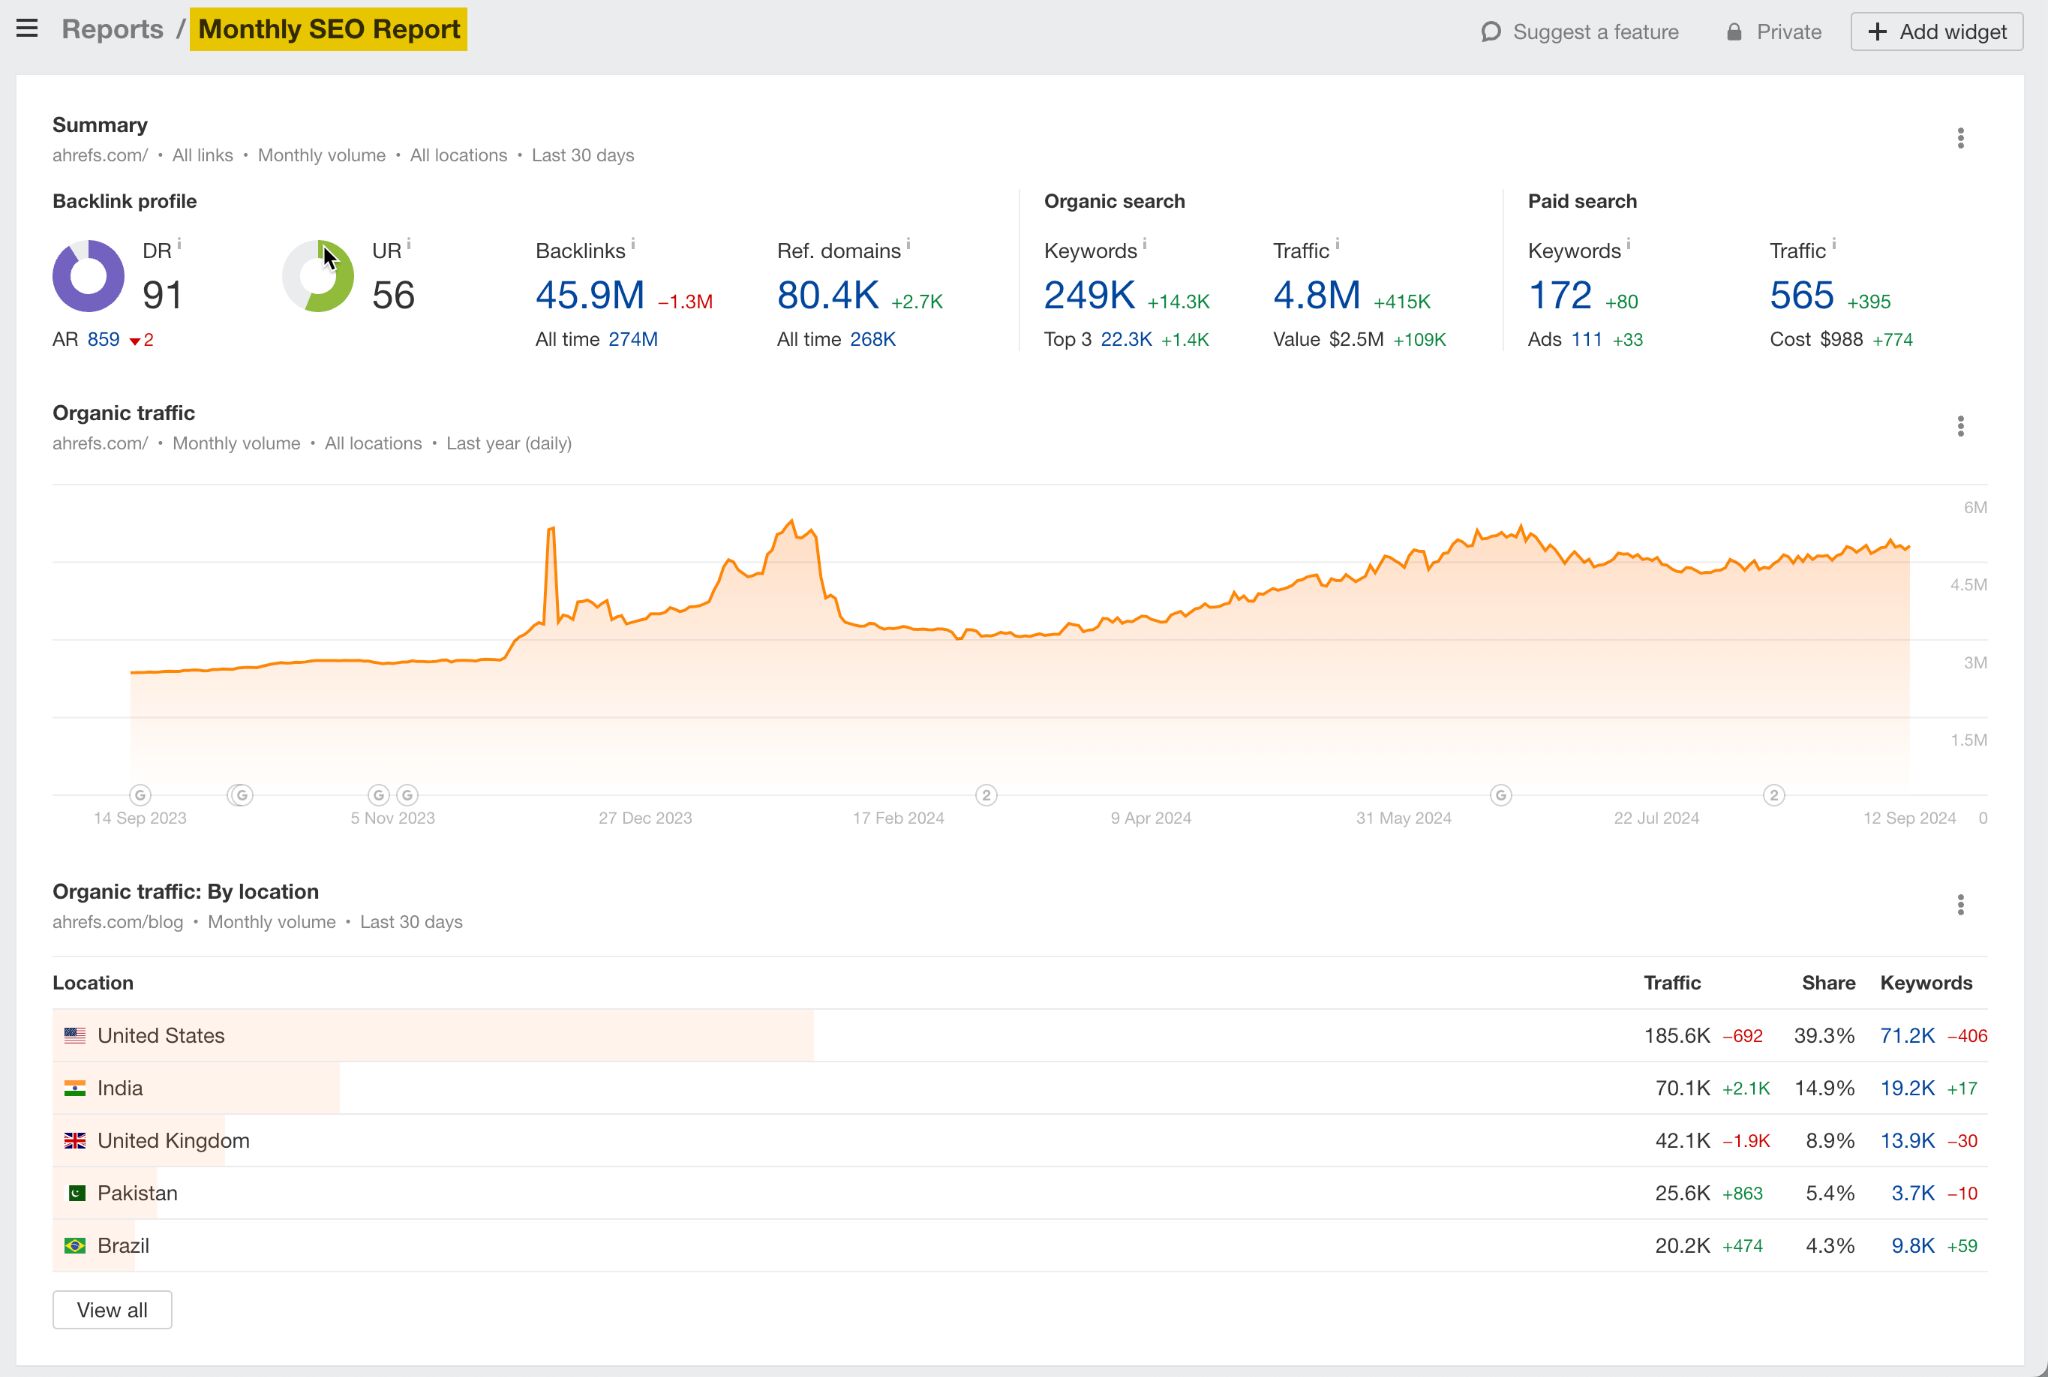
Its main purpose? To share useful insights on how your SEO efforts add up for a given time period.
Target: Client website
Tool: Site Explorer
Widgets to include:
- Summary: Last 30 days
- Organic search - Organic traffic: Last 30 days
- Organic traffic by location: Last 30 days
- Top organic keywords: Winners/Losers [country]
- Top organic keywords: New/Lost [country]
- Backlink profile: All widgets
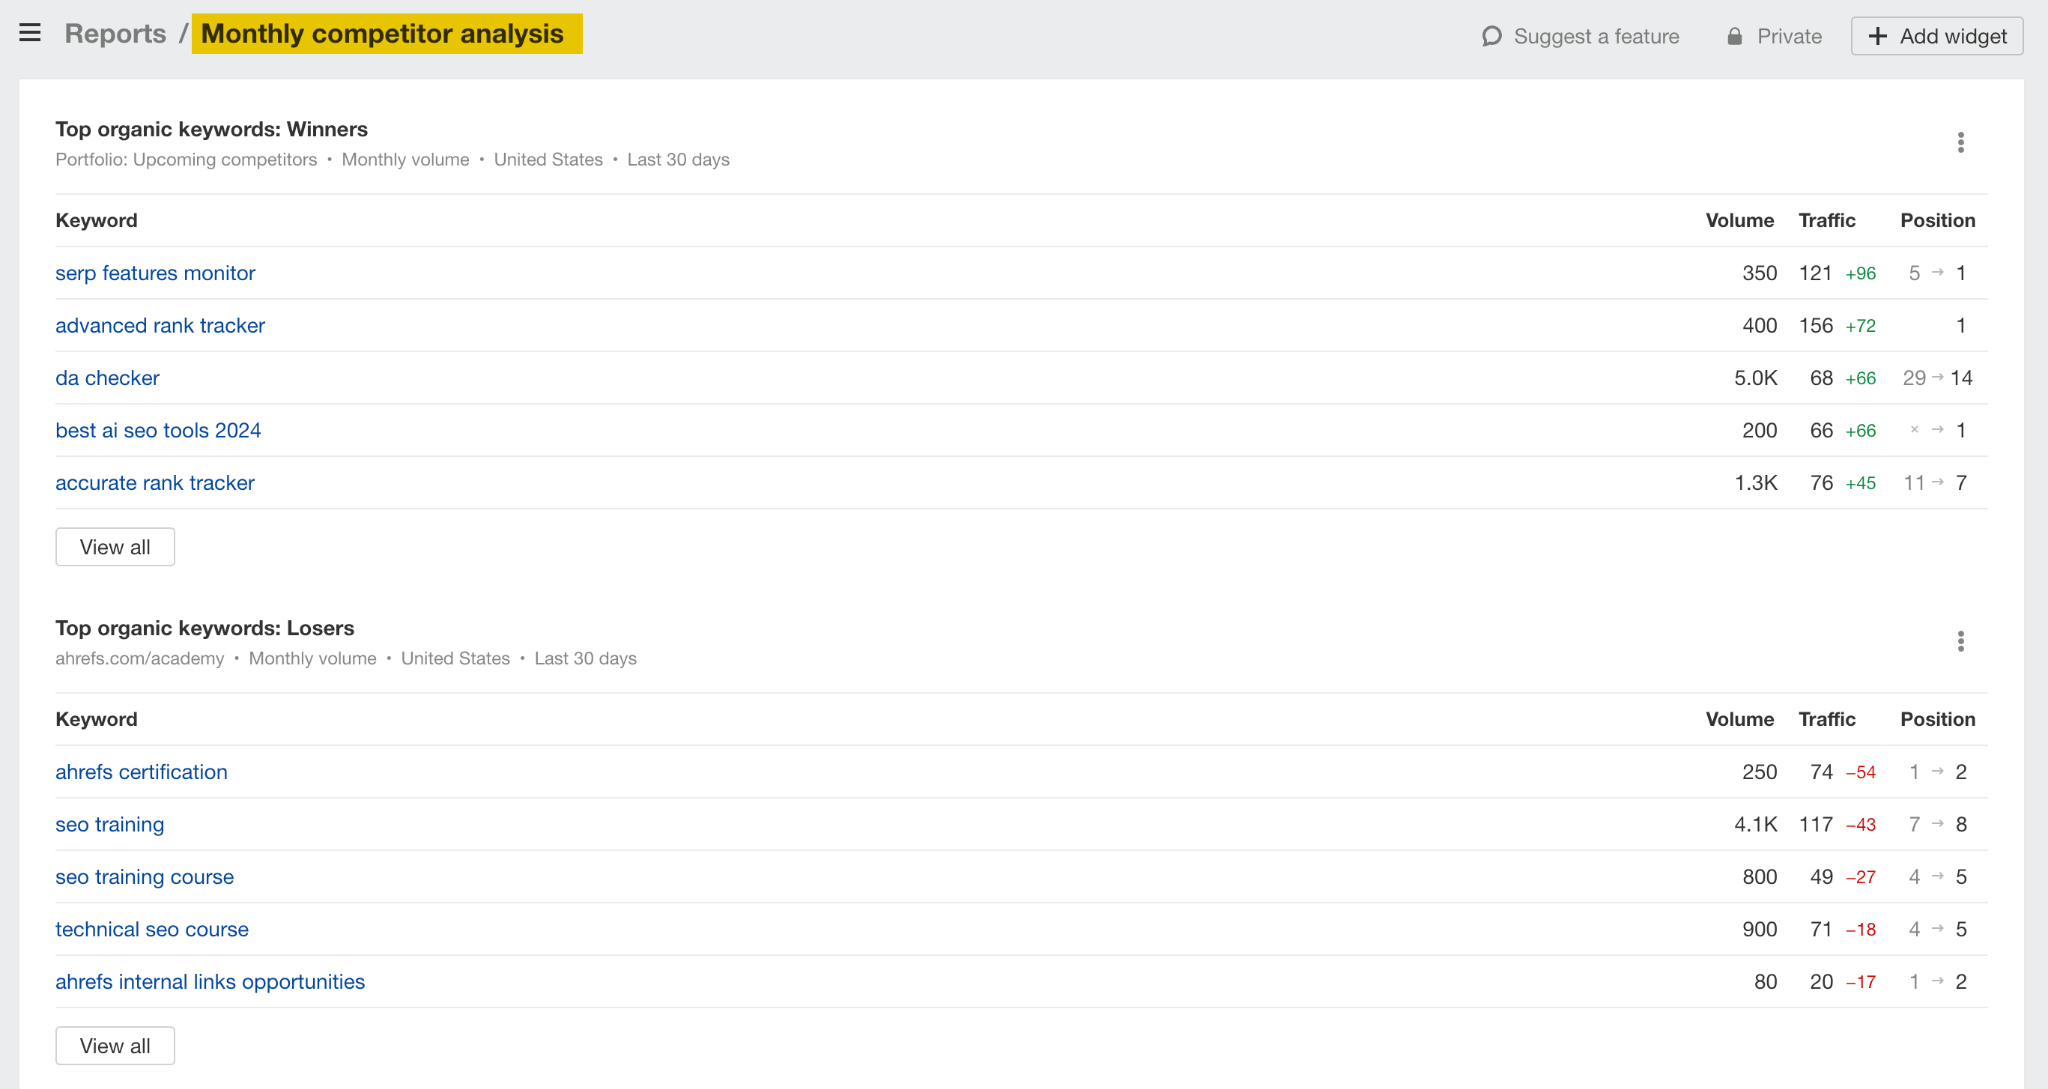
2. Monthly competitor analysis report
Wouldn’t it be great if you could gather intel on your competitors on auto-pilot without pulling outdated data from different sources? Let’s be honest, nobody uses that spreadsheet anyway.
Instead, group a bunch of competitors into a portfolio and create a report with the following settings:
Target: Portfolio (top 10 competitors)
Tool: Site Explorer
Widgets to include:
- Top organic keywords: Winners/Losers [country]
- Top organic keywords: New/Lost [country]
- Referring domains: By follow type
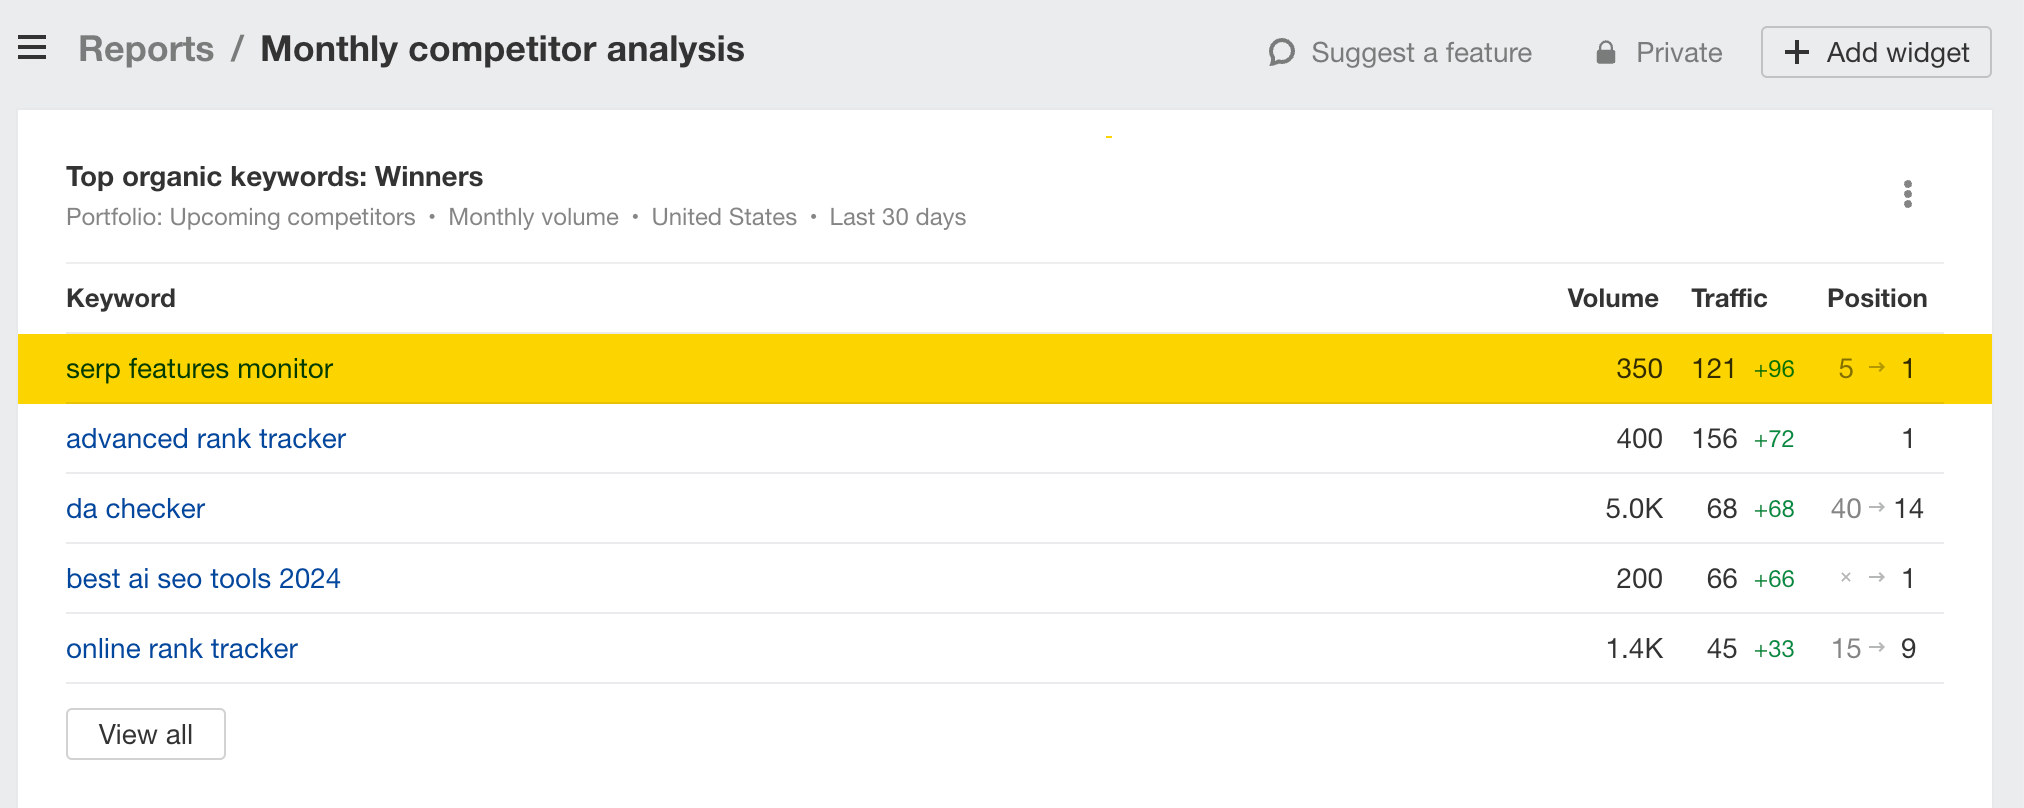
This allows you to proactively monitor your industry as a whole and make strategic moves that increase your brand’s visibility over your competitors’.
For example, we’ve just noticed that one of our competitors has climbed up the rankings from position #5 to #1 for the keyword “serp features monitor”. We’re not even ranking in the Top 10 for it, so we might consider covering the topic.
3. Dashboard for brand monitoring
Let’s face it, C-level executives prefer dashboard reports for a big-picture view of the search landscape. Middle managers can also use these type of “search dashboards” to get more SEO resource buy-in for large marketing and SEO campaigns.
For this type of report, focus on widgets that paint the big picture:
Target: Client website
Tool: Site Explorer
Widgets to include:
- Organic traffic competitors: Last 6 months
- Referring domains competitors: Last 6 months
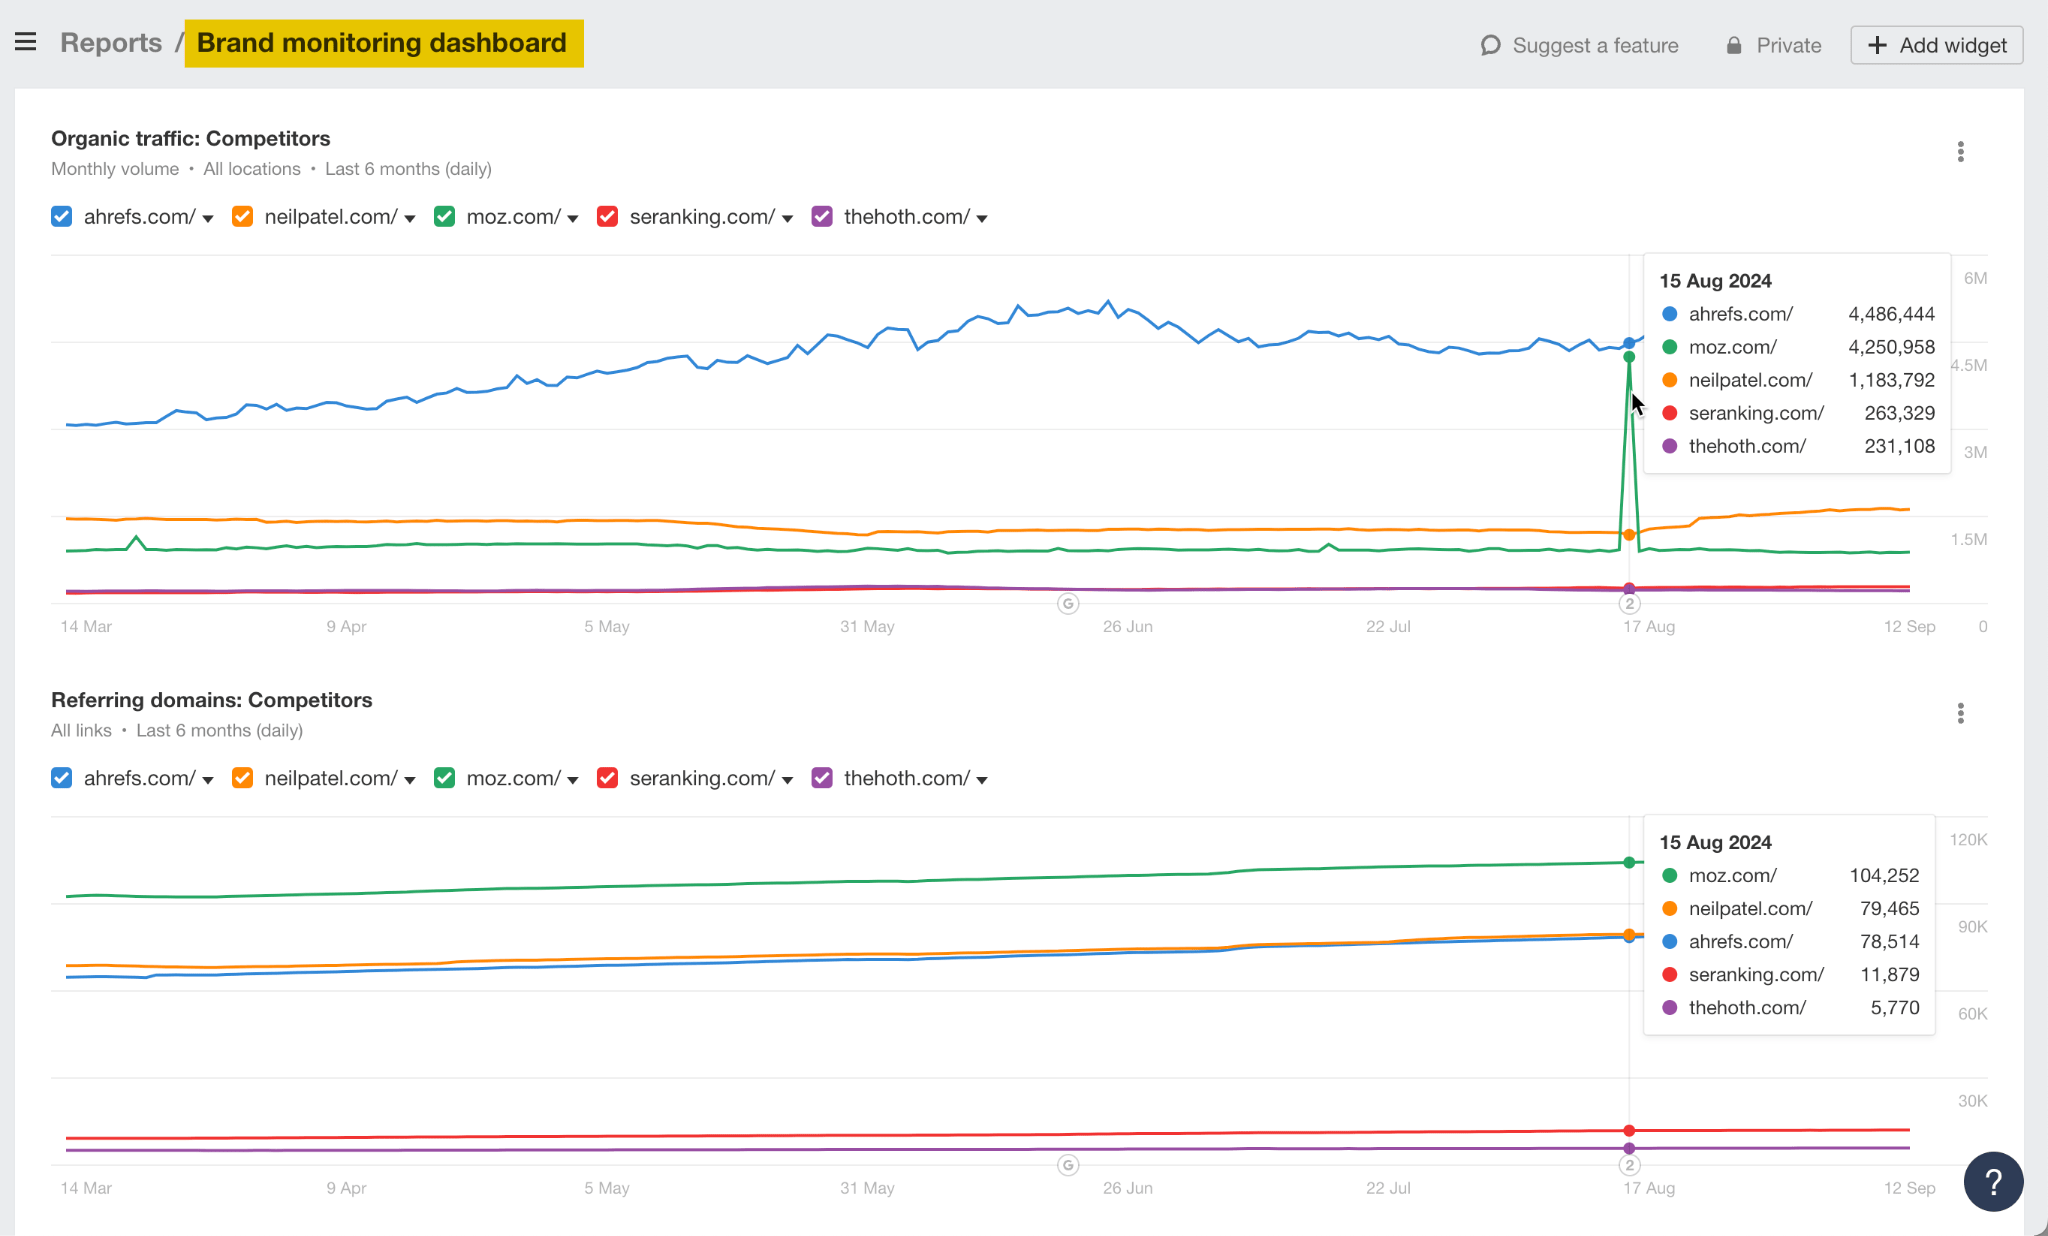
Judging by the last screenshot, it seems like one of our competitors had a sudden traffic spike. All that’s left is to investigate what was the cause and whether or not we can still capitalize on it.
4. Monthly regional rankings report
Only this time, we’ll focus on widgets from the Rank Tracker tool, which monitors rankings across 190+ locations on both desktop and mobile.
Target: Regional websites
Tool: Rank Tracker
Widgets to include:
- Top keywords: By traffic
- Device: Desktop
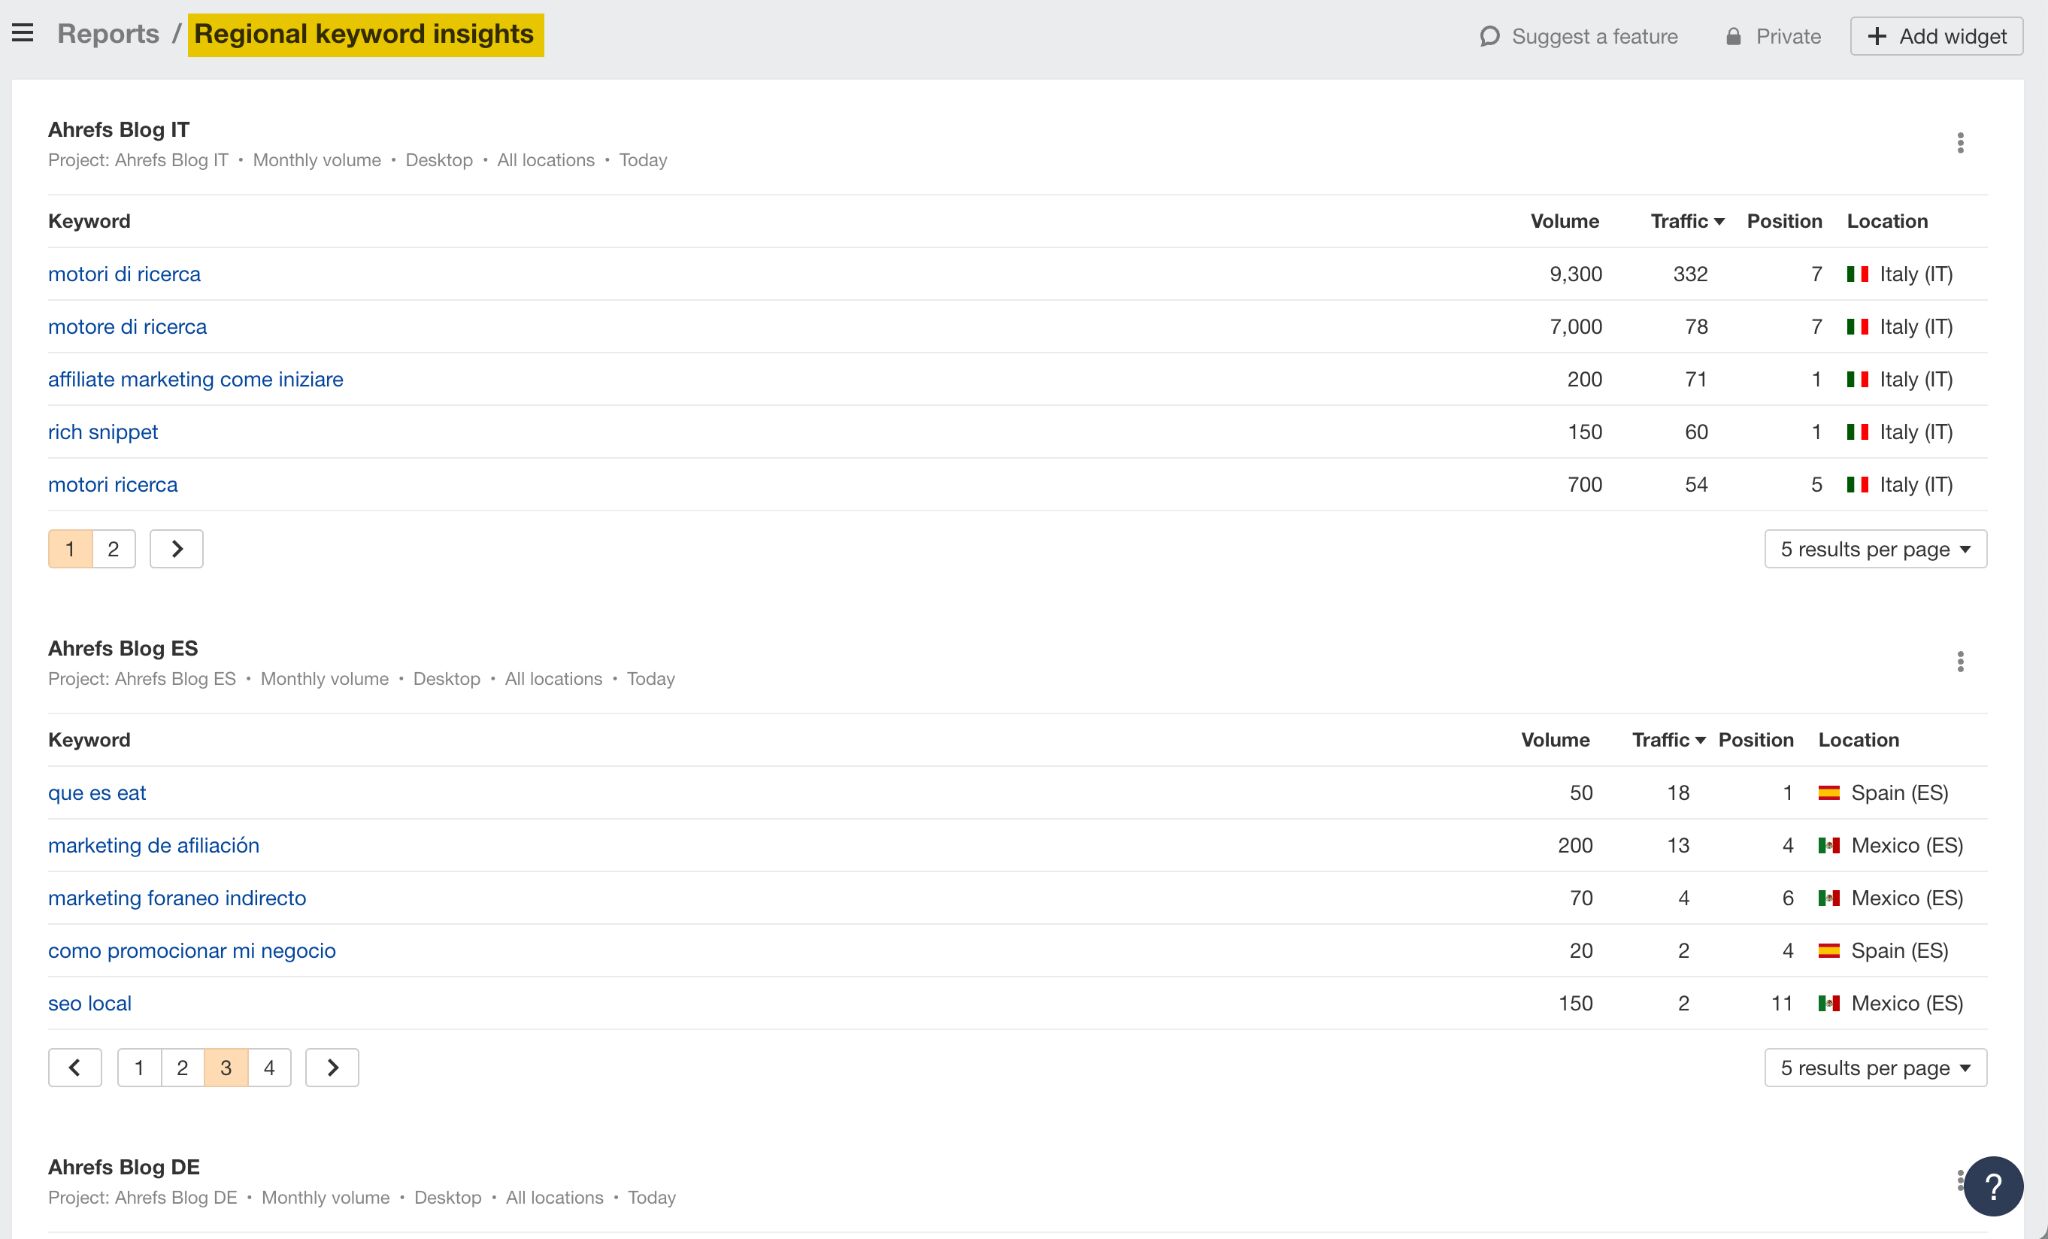
In the example above, we’ve monitored all desktop rankings for our five international blogs. But you can get more creative and compare the desktop vs. mobile rankings for a complete picture.
While in beta, Reports are free for all paid plans – including legacy ones.
Currently, you can only add widgets from Site Explorer and Rank Tracker. Each workspace allows up to 50 reports and 200 widgets, with a maximum of 50 widgets/report.
In the future, they will support:
- Headings and paragraphs for better formatting
- Sharing and scheduling reports for clients, via email (you can only share them with your team now)
- Site Audit widgets for website health monitoring
Have any use cases in mind or suggestions for improvements? Share them with us by clicking on the Suggest a feature button inside the report builder.