PageSpeed Insights works by analyzing a webpage’s HTML, CSS, fonts, and JavaScript, and provides suggestions to optimize the performance of the page. This includes things like compressing images, minifying code, and reducing the number of HTTP requests made by the page.
Let’s look at PageSpeed Insights more closely.
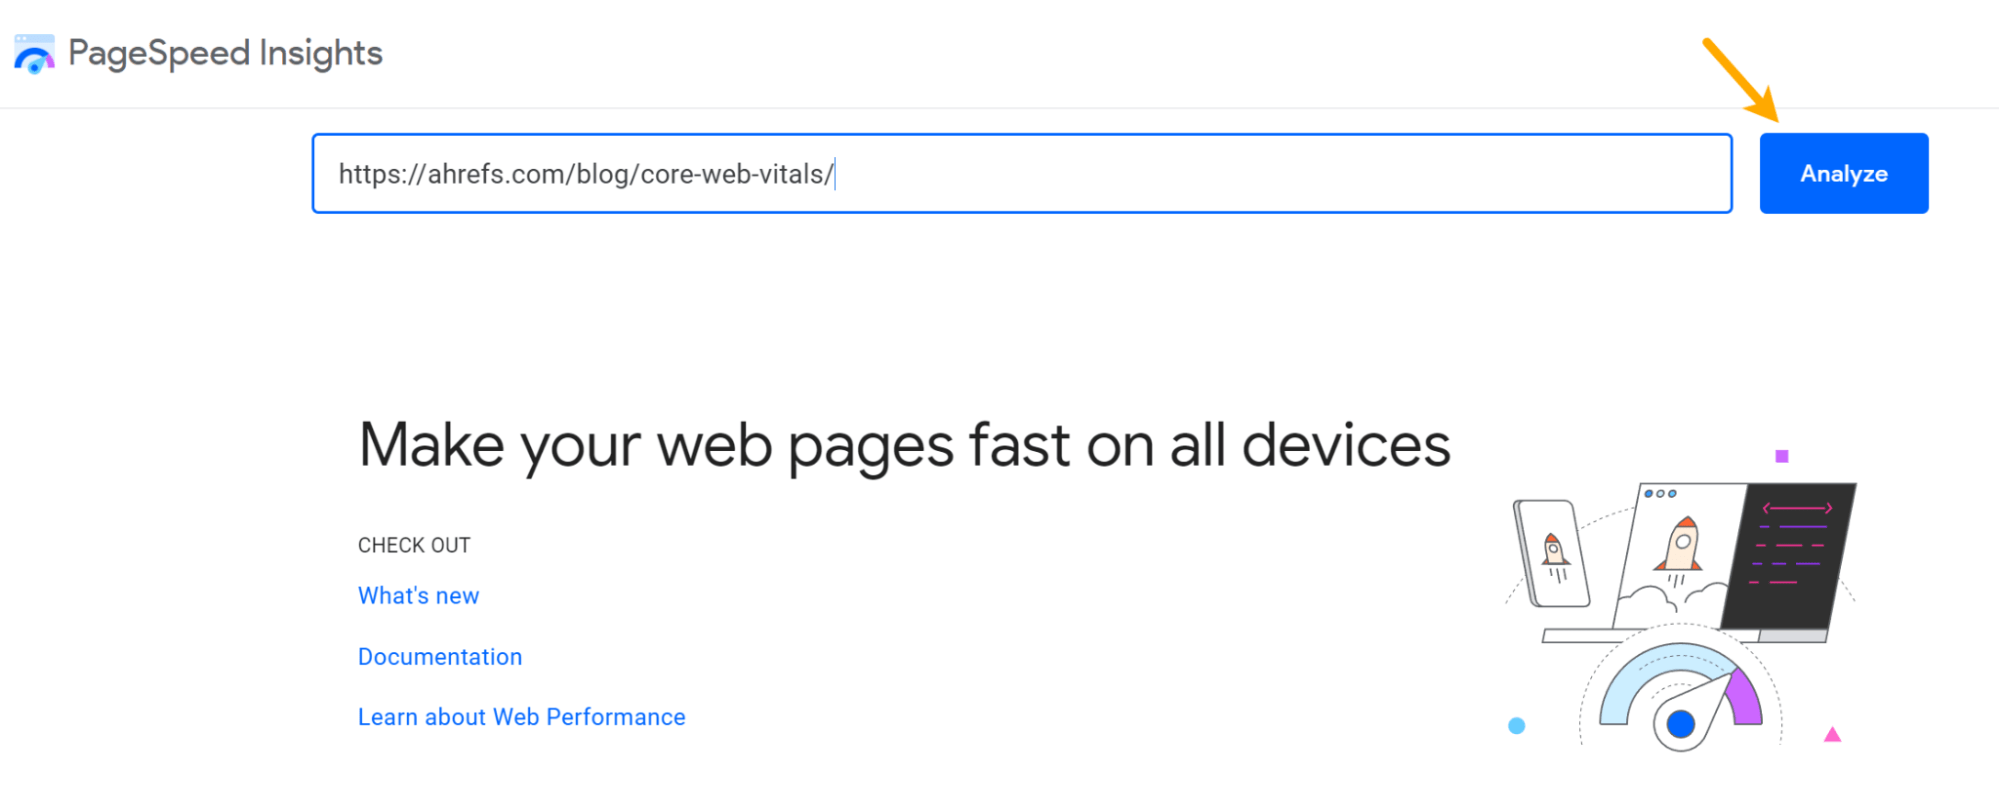
To start, go to PageSpeed Insights. Enter a URL and click “Analyze.”
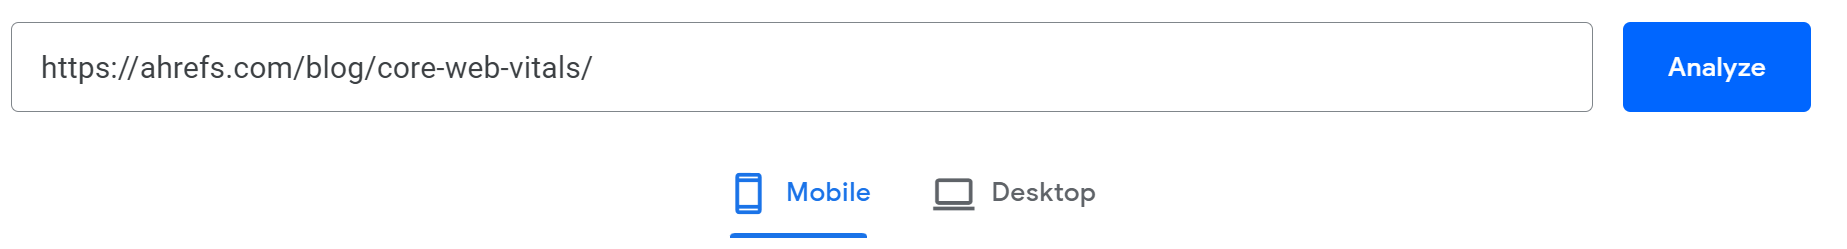
You’ll have the option to switch between the Desktop and Mobile analysis. Mobile scores will usually be worse than Desktop scores. Mobile data may reveal more issues for you to resolve, and that’s what I recommend looking at.
Field data
The next section contains data from real users of your website. PageSpeed Insights is pulling this from the Chrome User Experience Report (CrUX), which contains the data of Chrome users who opted in to sharing that data.
At the top is a tab to switch between page and origin (similar to domain) level data, which aggregates the data for many pages. You may not have data for all pages or even origin data. It depends on how many people visit your website and opt in to sharing this information.
As of April 2023, there are ~29.5 million origins in the CrUX dataset.
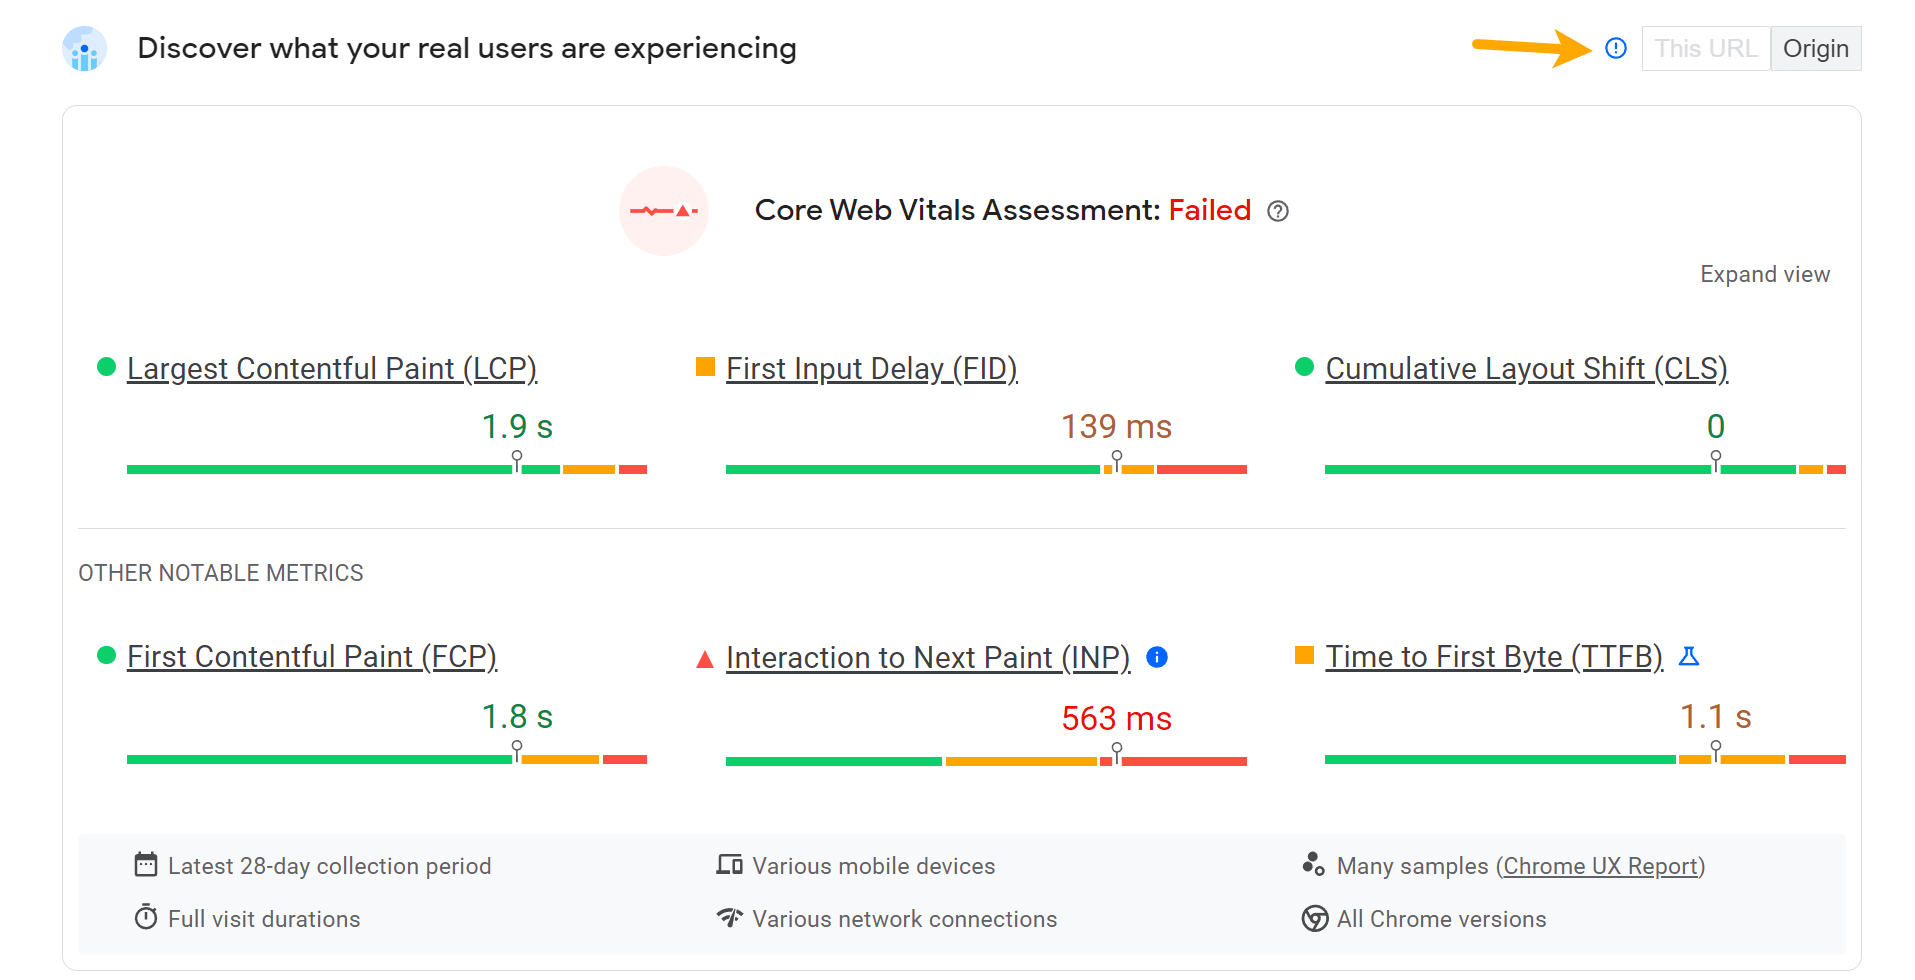
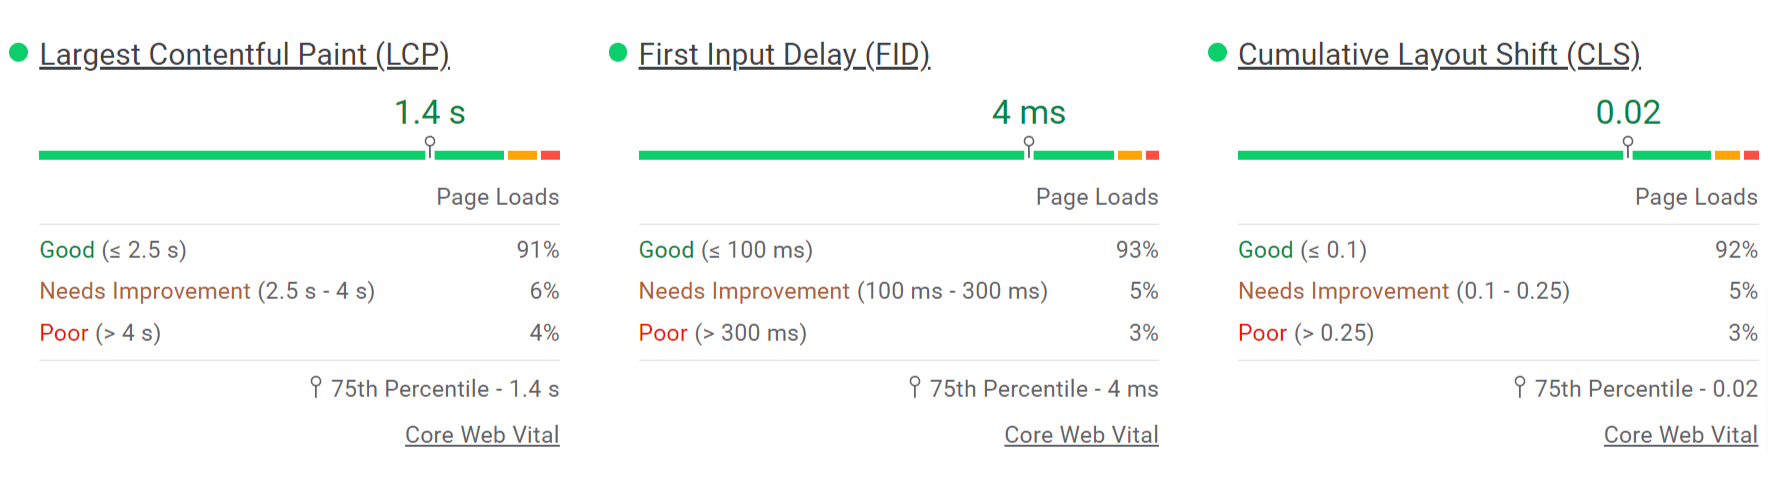
The next section is all about Core Web Vitals (CWV), including a pass/fail assessment. The main metrics are Largest Contentful Paint (LCP), First Input Delay (FID), and Cumulative Layout Shift (CLS). These CWV metrics are the ones Google uses in its rankings.
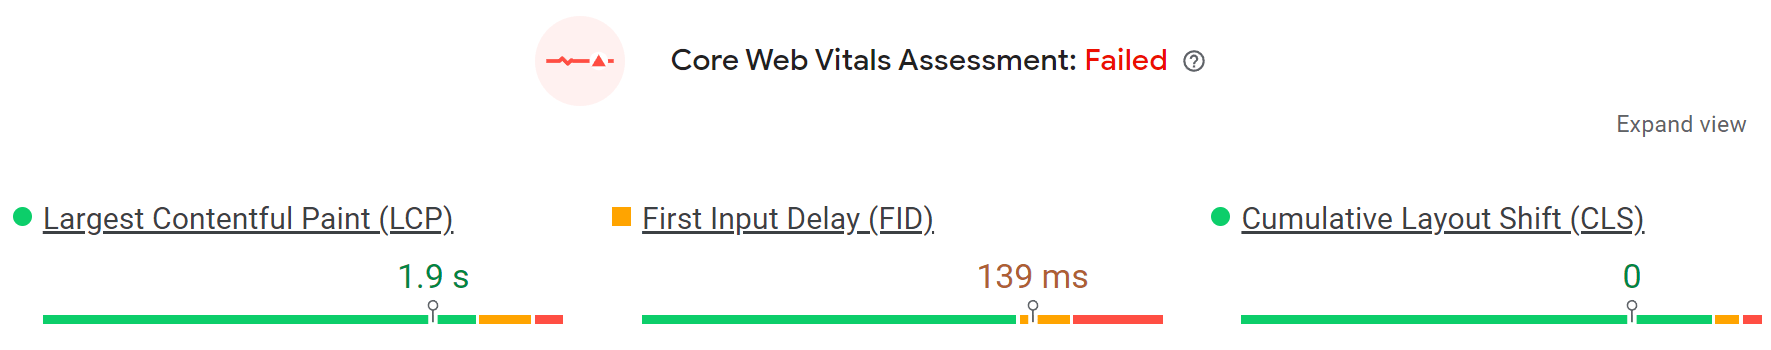
The numbers are color coded to show you that green = good, orange = needs improvement, and red = poor. In all, 75% of user experiences need to meet the threshold set for a given metric for it to be considered “good.” These are the thresholds:
| Metric | Good | Needs improvement | Poor |
|---|---|---|---|
| LCP | 2500 ms | 2500 ms–4000 ms | > 4000 ms |
| FID | 100 ms | 100 ms–300 ms | > 300 ms |
| CLS | 0.1 | 0.1–0.25 | > 0.25 |
If you click “Expand view,” you’ll see the distribution for each metric.
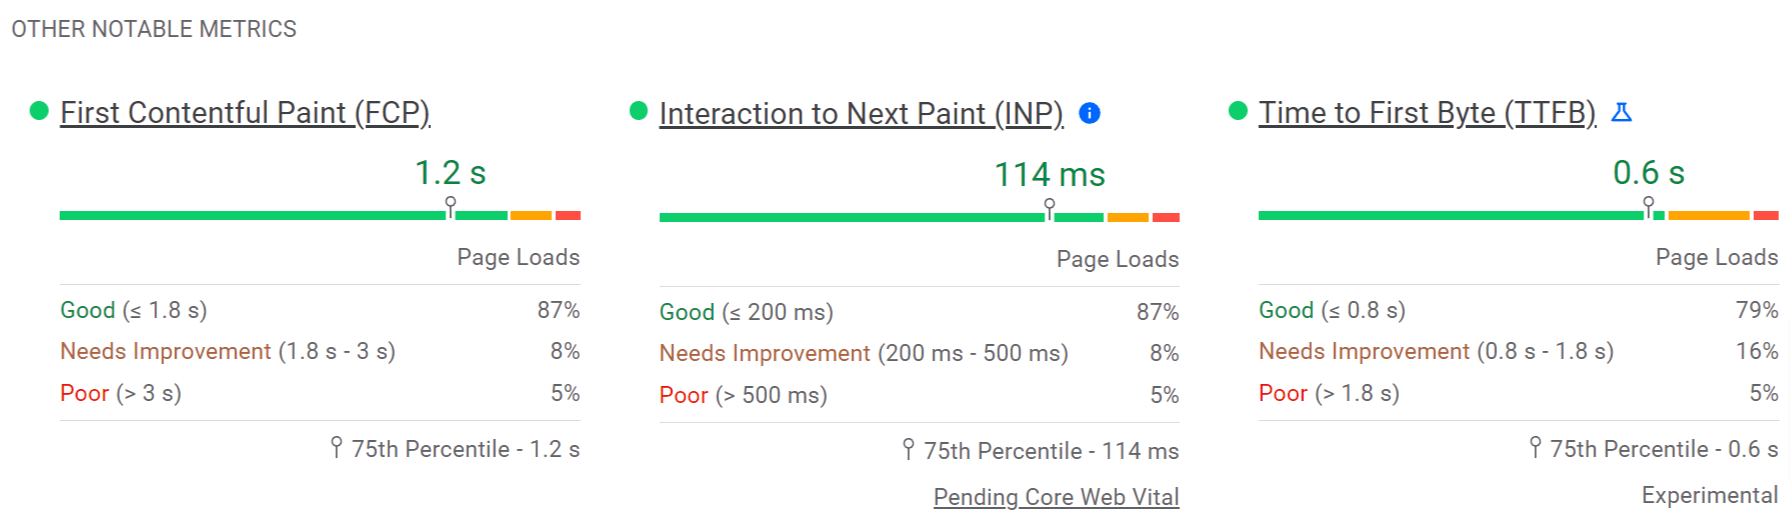
There are additional metrics from the CrUX database that are not currently used in the rankings. These include First Contentful Paint (FCP), Interaction to Next Paint (INP), and Time to First Byte (TTFB). INP will be replacing FID as a CWV metric in March 2024.
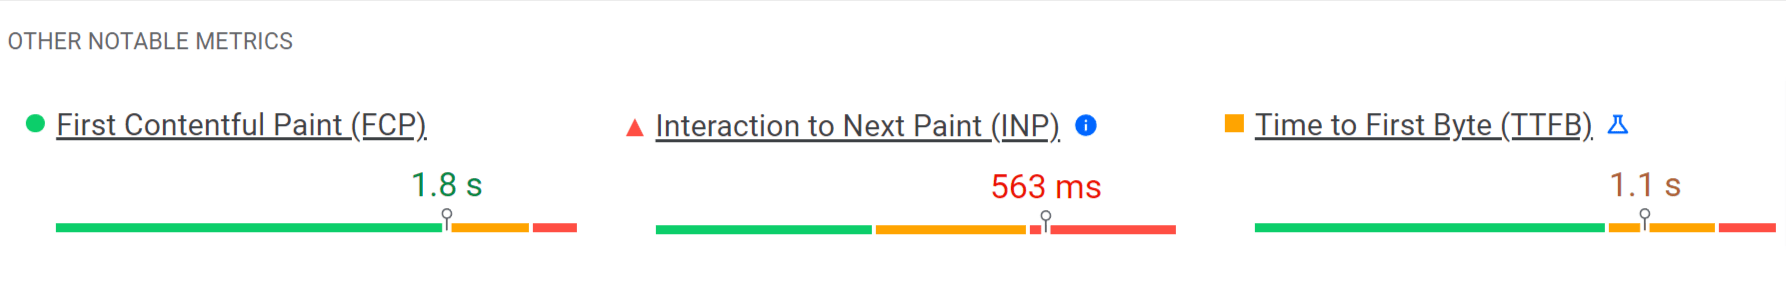
The numbers are color coded to show you that green = good, orange = needs improvement, and red = poor. 75% of user experiences need to meet the threshold set for a given metric for it to be considered “good.” These are the thresholds:
| Metric | Good | Needs improvement | Poor |
|---|---|---|---|
| FCP | 1800 ms | 1800 ms–3000 ms | > 3000 ms |
| INP | 200 ms | 200 ms–500 ms | > 500 ms |
| TTFB | 800 ms | 800 ms–1800 ms | > 1800 ms |
If you click “Expand view,” you’ll see the distribution for each metric.
The last section tells you a bit about where this data comes from. The data is from real user experiences and is a rolling average over a 28-day period.

Lab data
Lighthouse is an open-source tool for measuring the performance and quality of webpages. It can be run in your own browser. But in the case of PageSpeed Insights, it runs on Google’s servers.
You’ll see several numbers for Performance, Accessibility, Best Practices, and SEO. All of these really just check for best practices, but they don’t tell you how well you’re doing in each of the areas.

Once again, the metrics are color coded to quickly give you an idea of what is good and what you may need to work on.
For the purpose of this article, we’re going to focus on the “Performance” section, since that is what SEOs use the tool for. First up, you have a performance score and a screenshot of the page.
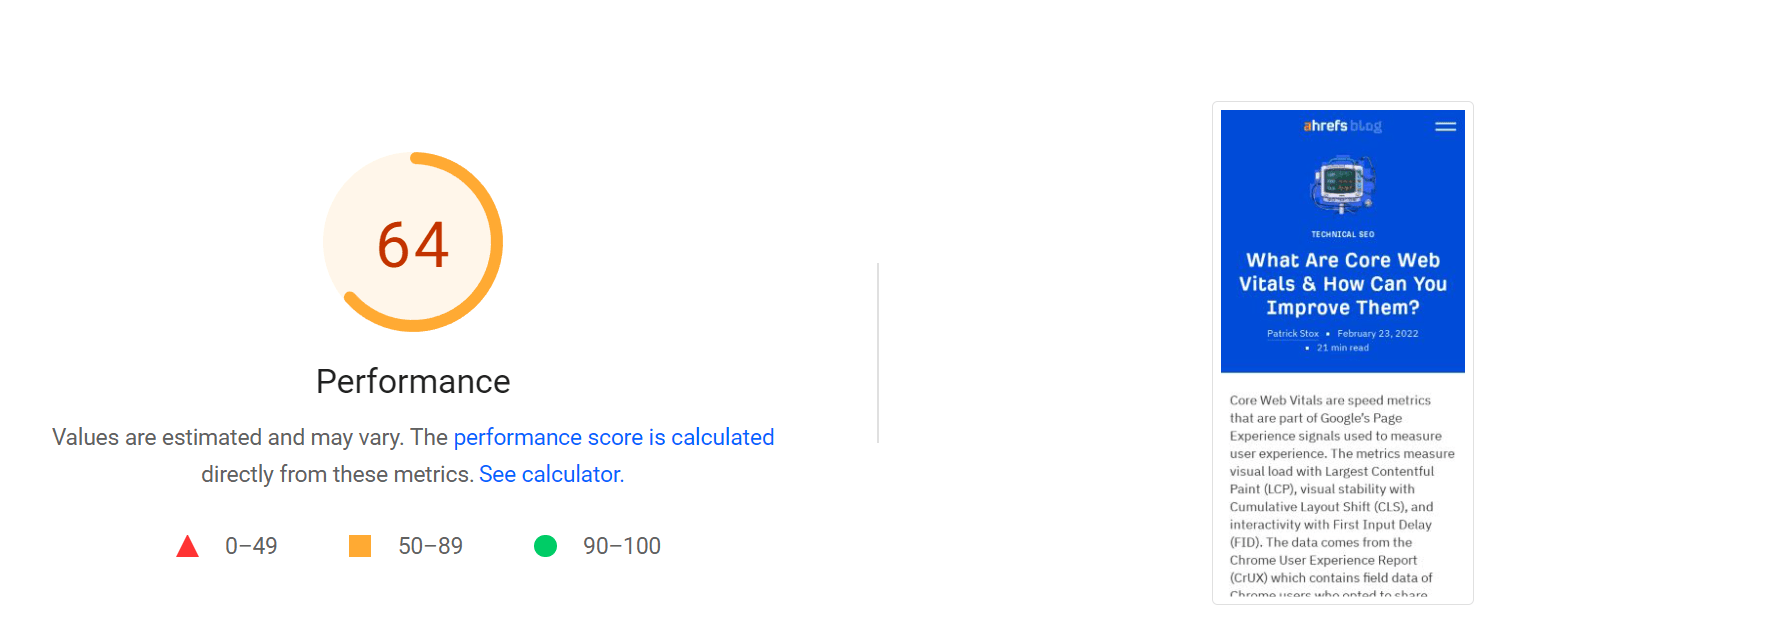
You’ll be scored between 0 and 100. The current score thresholds are:
- Good: scores of 90–100
- Needs improvement: scores of 50–89
- Poor: scores of 0–49
As I mentioned, you can have a good score but still have a slow page that doesn’t pass CWV. Other factors, such as network conditions, server load, caching, and the user device, also affect page load time.
Only 2% of tested pages score 100. A score of 50 puts you in the top 25% of tested pages.
The score and metrics can change each time you run a test. This can happen because of network conditions, load, or browsers that make different decisions in the page-loading process. I recommend running three to five tests and averaging the results.
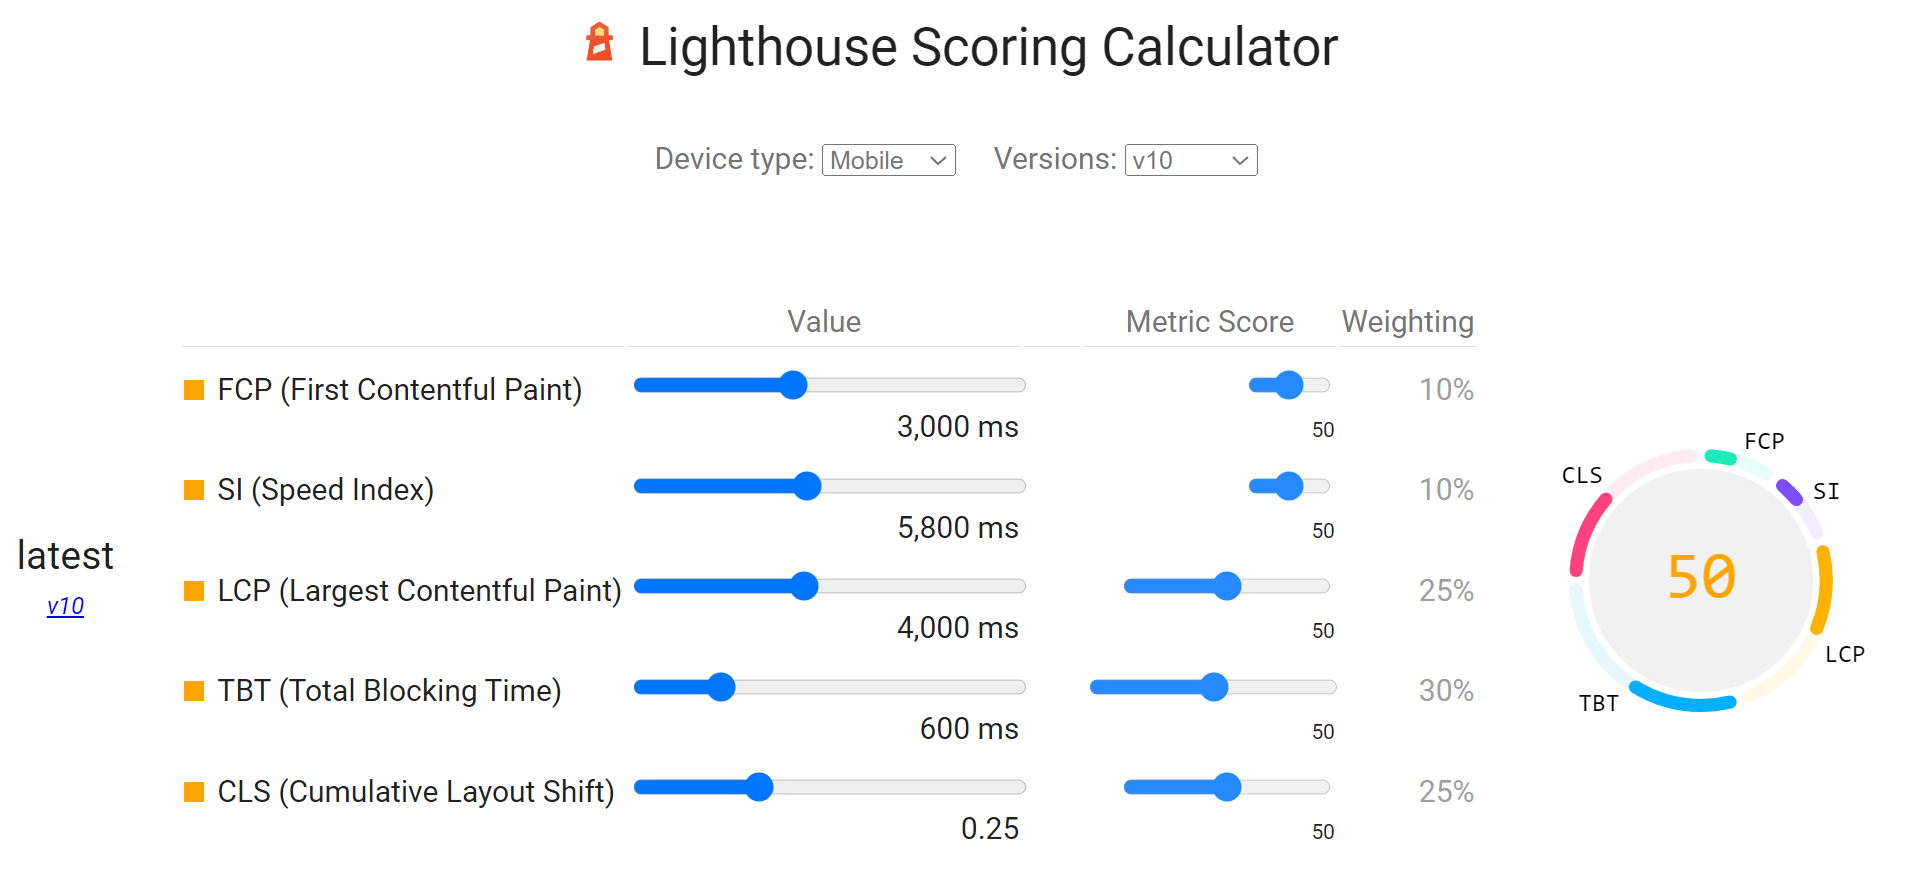
The score is based on a calculation and involves weighting several of the metrics. The weights change between Mobile and Desktop. These are the current scores for Mobile, but check the calculator for the latest info.
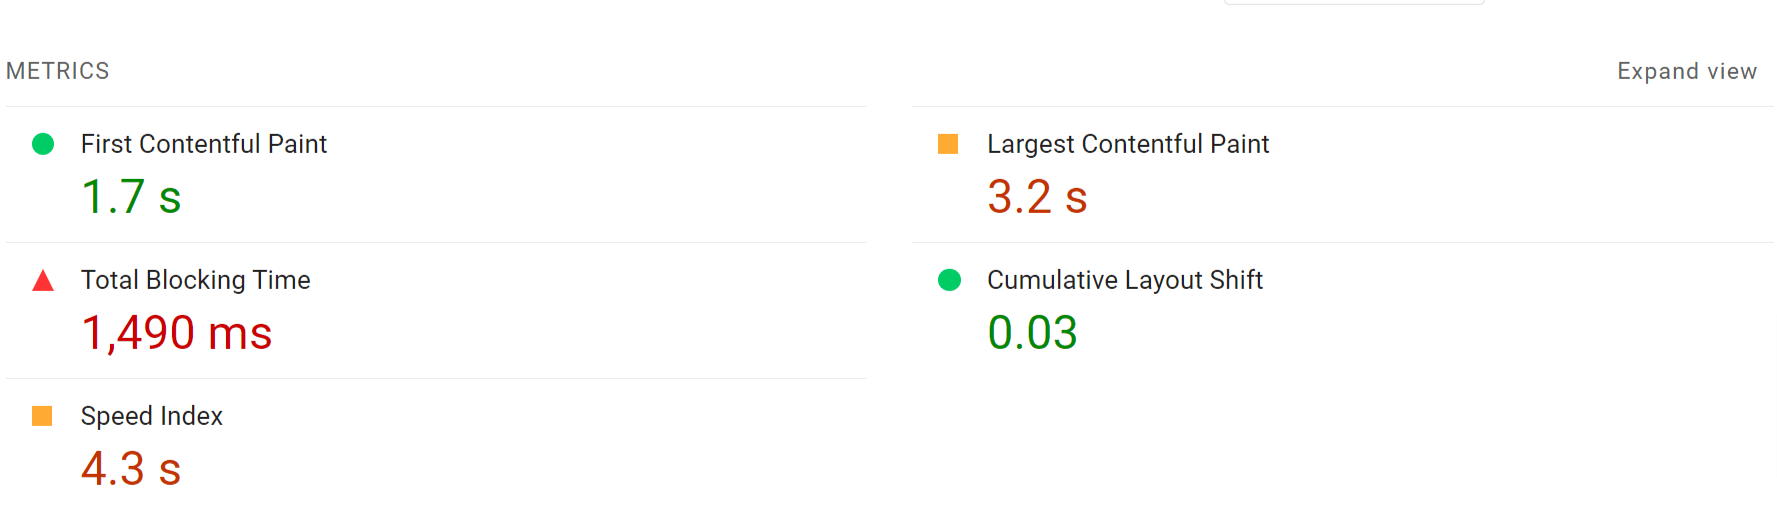
There’s another metric section, this time for the lab test metrics. You’ll find LCP and CLS here but won’t find the FID or INP metrics from CWV. Those require clicks on the page, which lab testing doesn’t reproduce. Instead, you can use Total Blocking Time (TBT) as a proxy metric to work on improving.
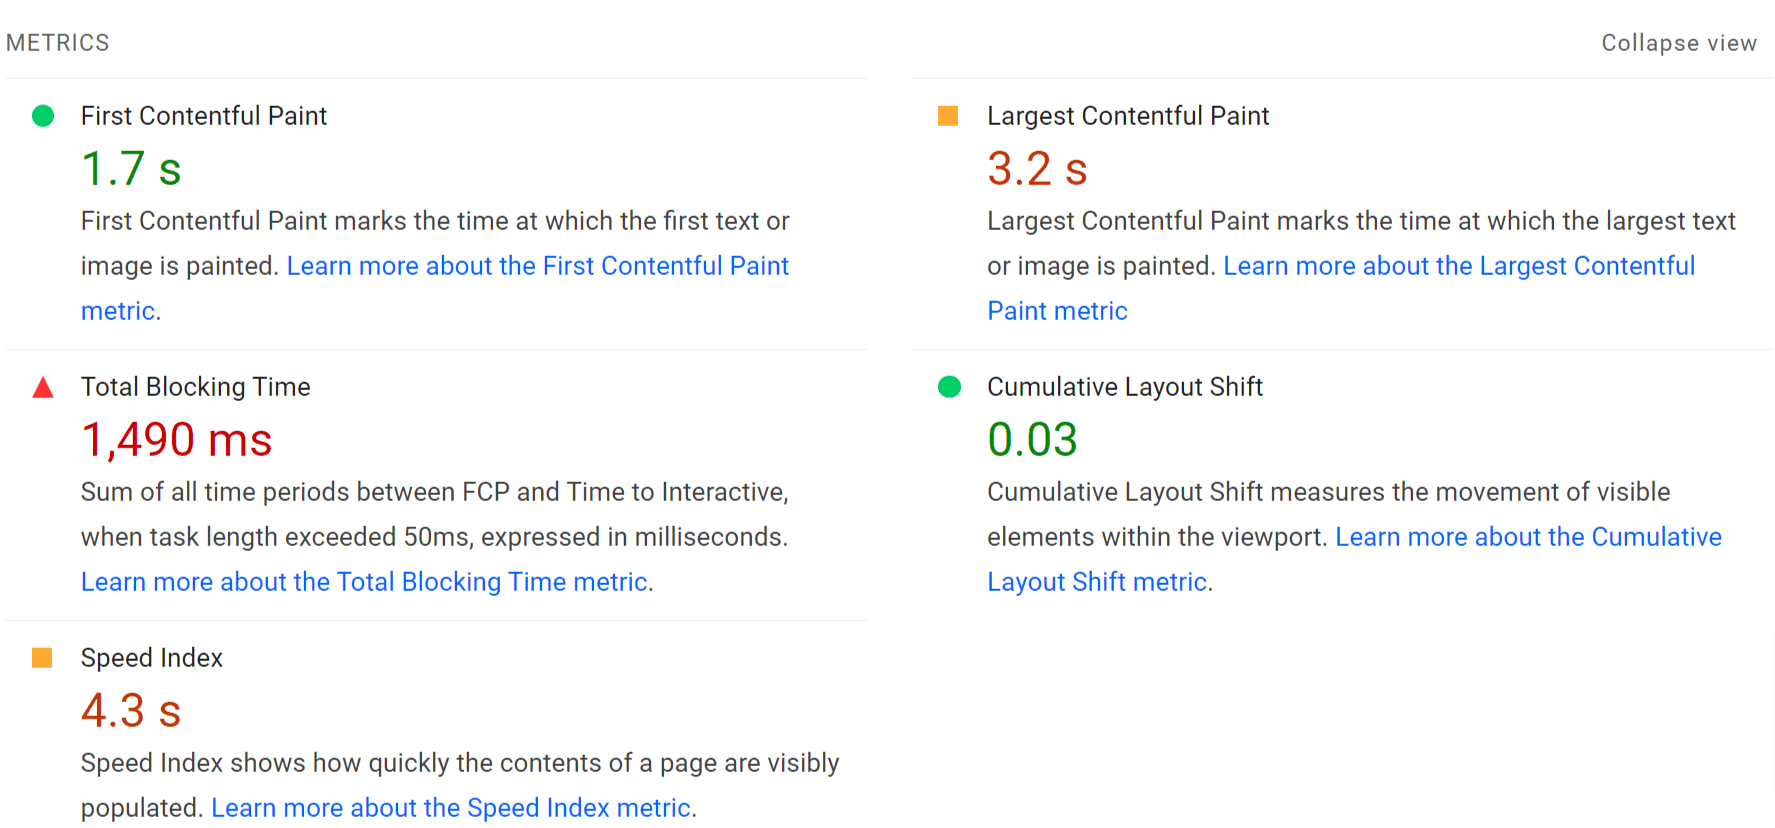
You can also click the “Expand view” button to get an expanded view that includes definitions for the metrics and links with more details.
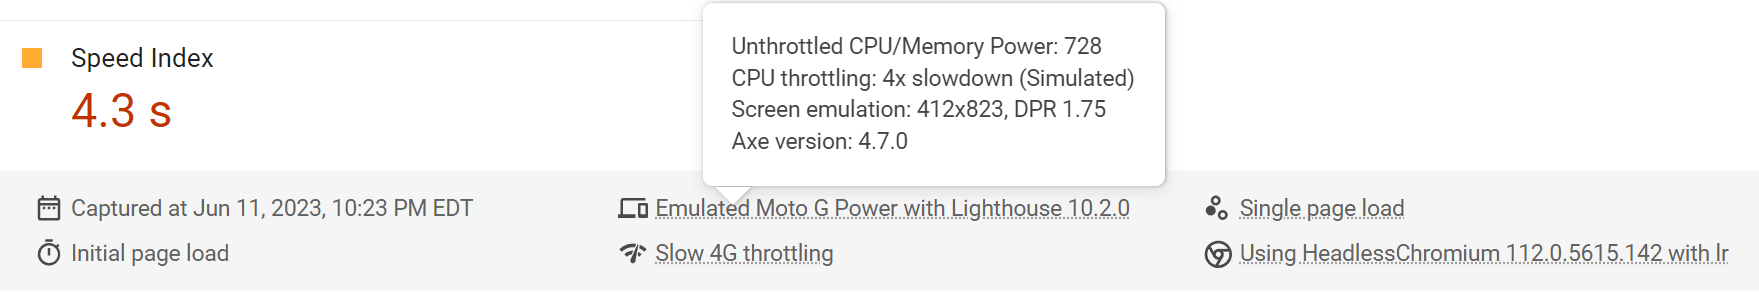
The last section tells you a bit about where this data comes from.

If you hover over this information, you’ll get even more info on the test conditions. While PageSpeed Insights has traditionally used a Moto G4 as the test device for many years, it looks like that is now a Moto G Power. You can also get data on the location of the test, which will be North America, Europe, or Asia.
There are some snapshots that visually show you how a page loaded over time.
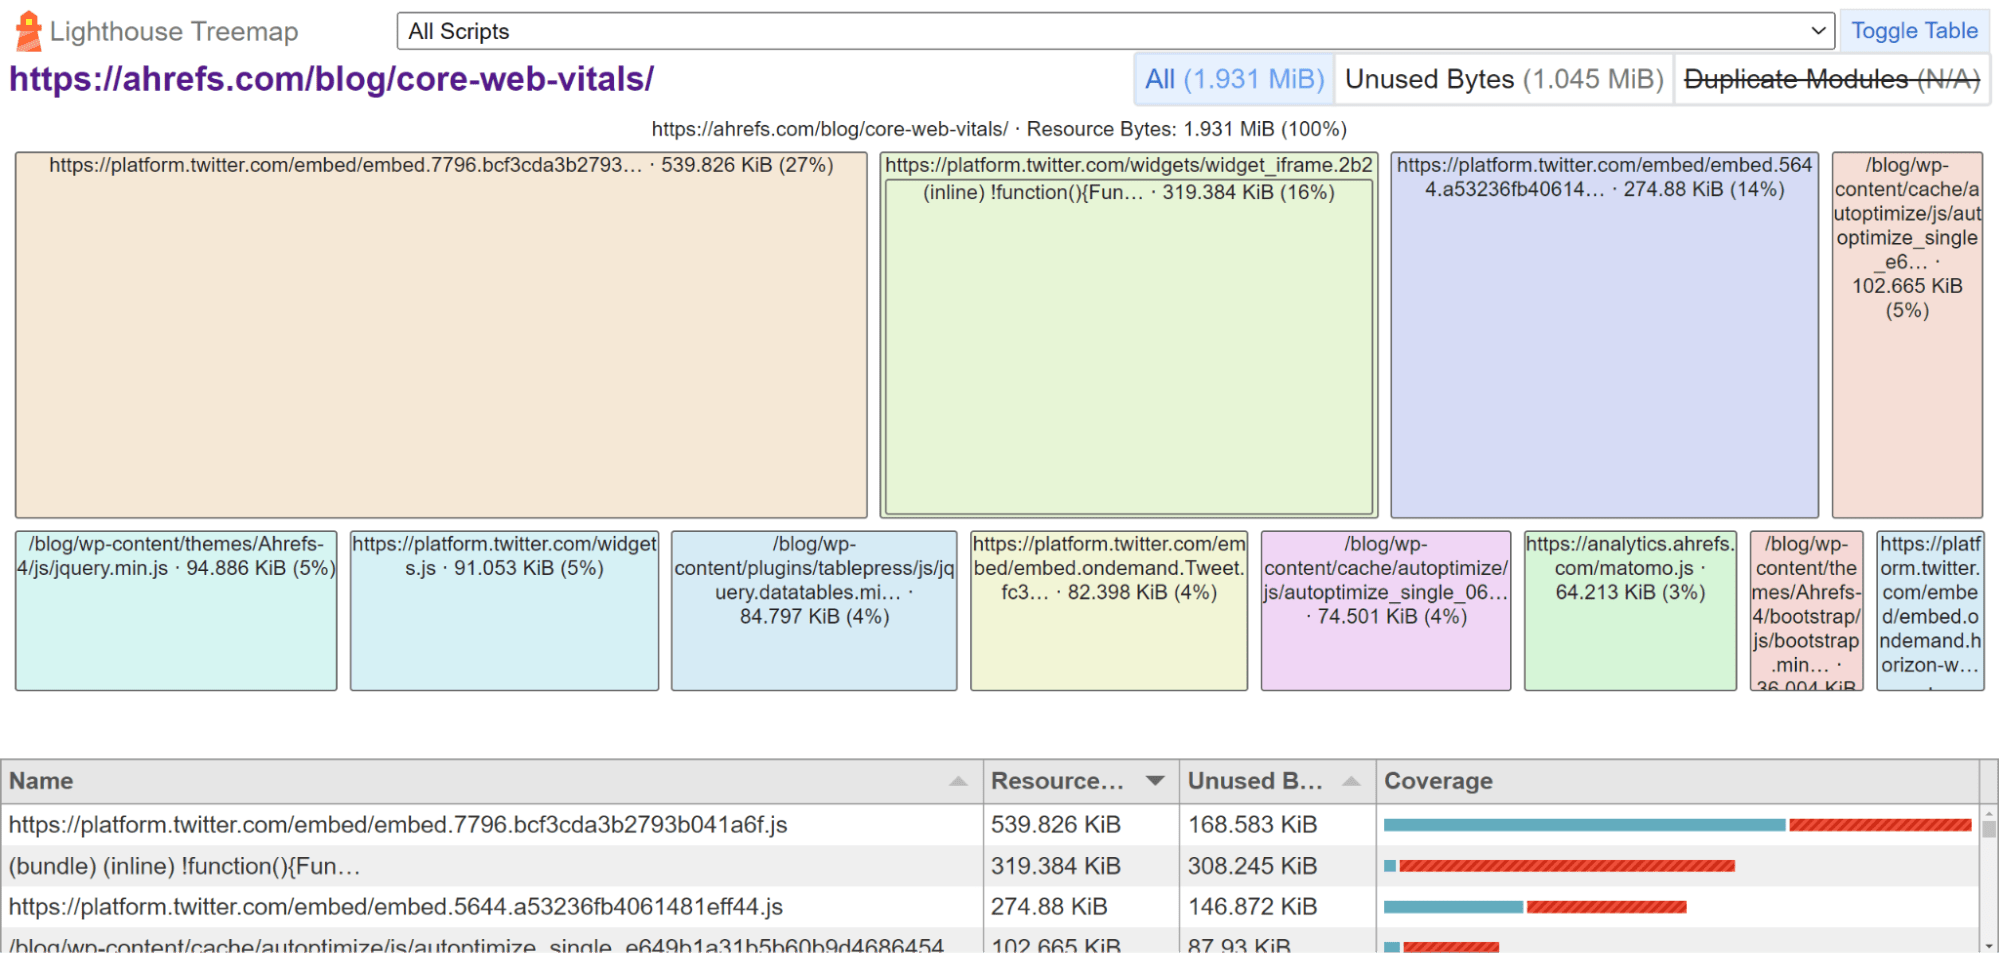
If you click “View Treemap,” you can find the largest files and how much of the code is unused on the page.
By default, you’ll see issues related to all of the metrics. There are buttons where you can filter to issues impacting specific metrics that you may want to improve.

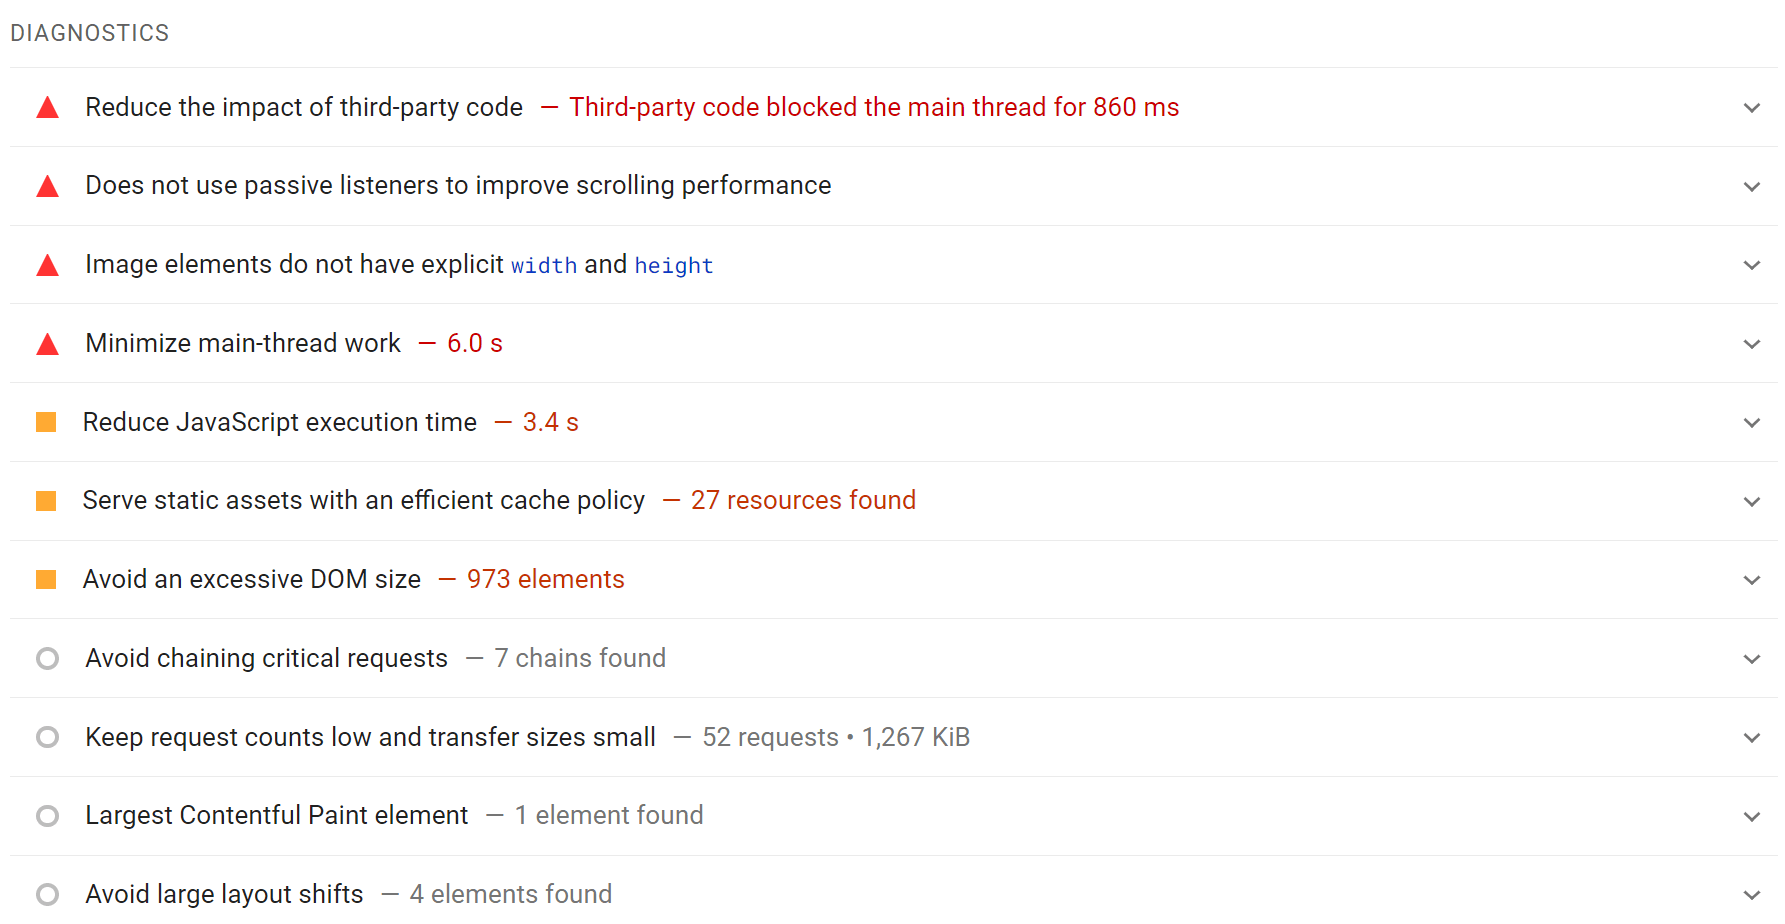
The “Opportunities” and “Diagnostics” sections will show you issues that can help your page performance.
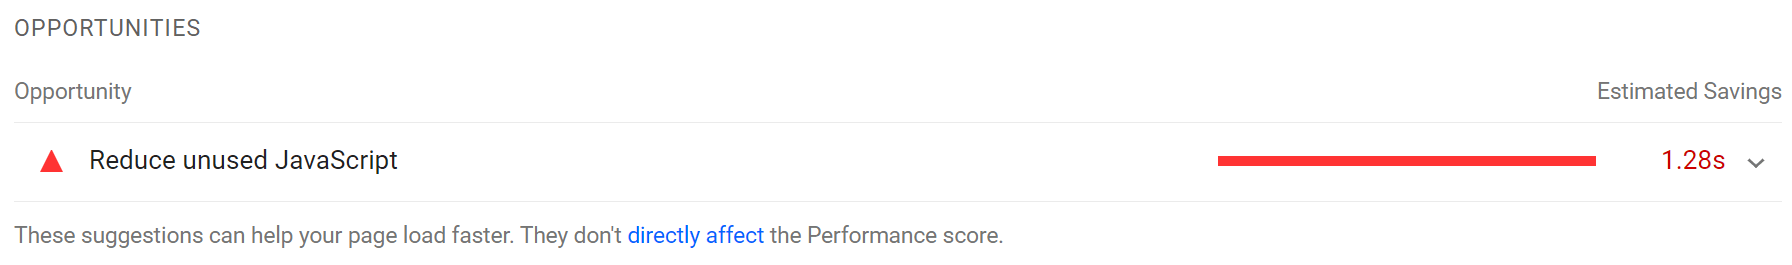
The estimated savings and improvements they show aren’t realistic. There can be other blockers so you won’t get the improvements shown or, in some cases, any improvement at all if you fix an issue. Sometimes, you have to fix multiple issues to actually see an improvement.
You can click to expand any of the elements. You’ll receive some guidance on how to fix each issue. The recommendations can change based on the system that’s being tested. For instance, I tested a page on our WordPress blog, and I saw WordPress-specific guidance.
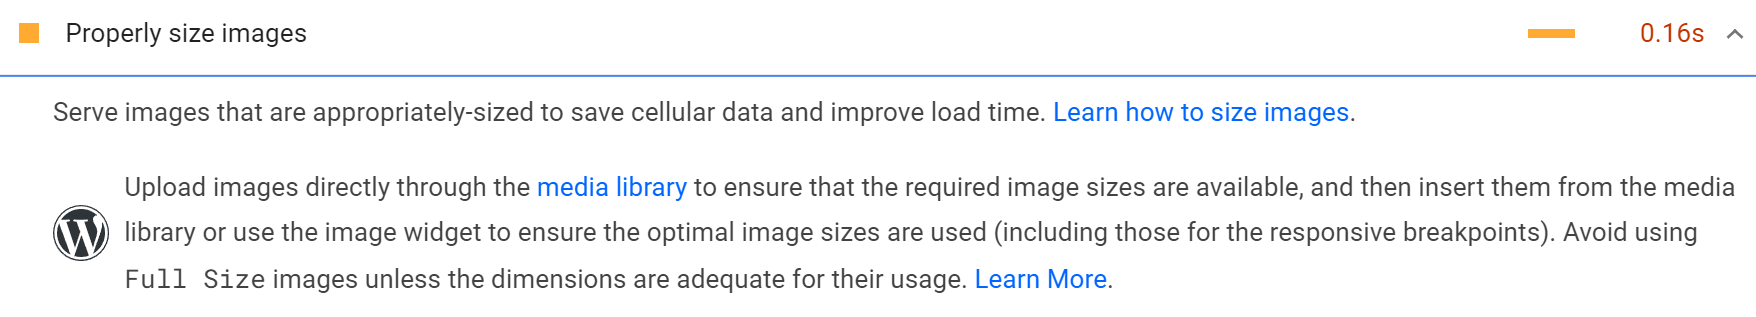
The tips are useful for translating some of the issues into terms you may have heard. For instance, the “defer offscreen elements” issue tells you that you should be lazy loading images. You can then search for a plugin in WordPress that handles lazy loading.
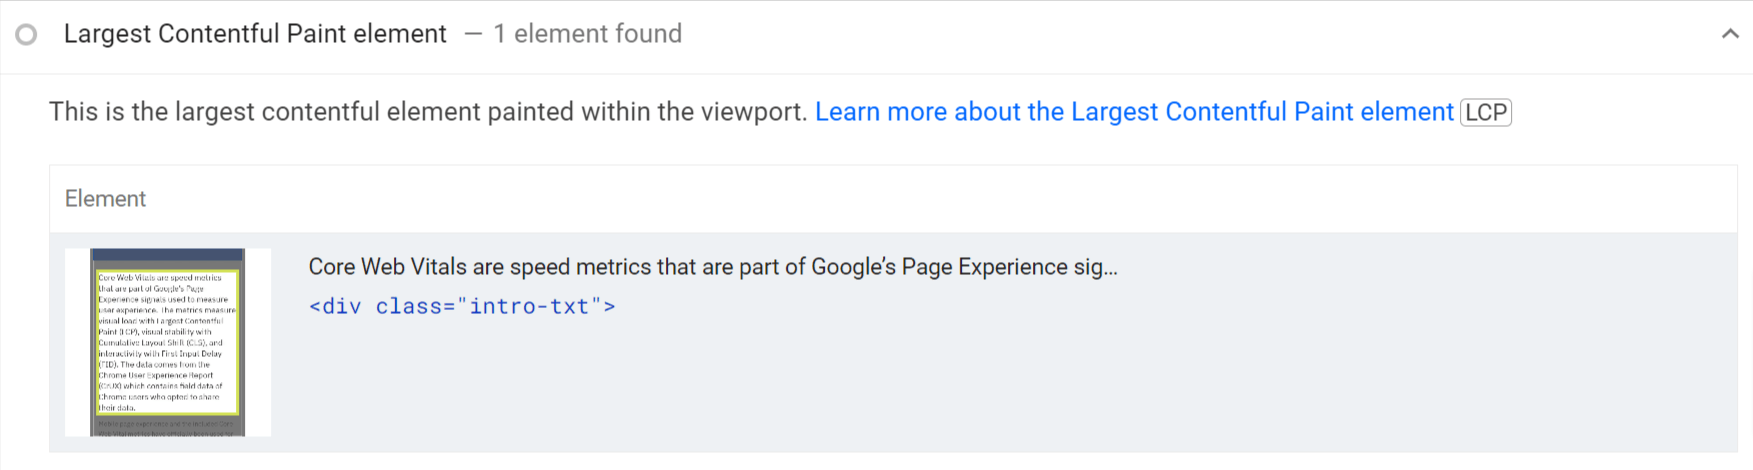
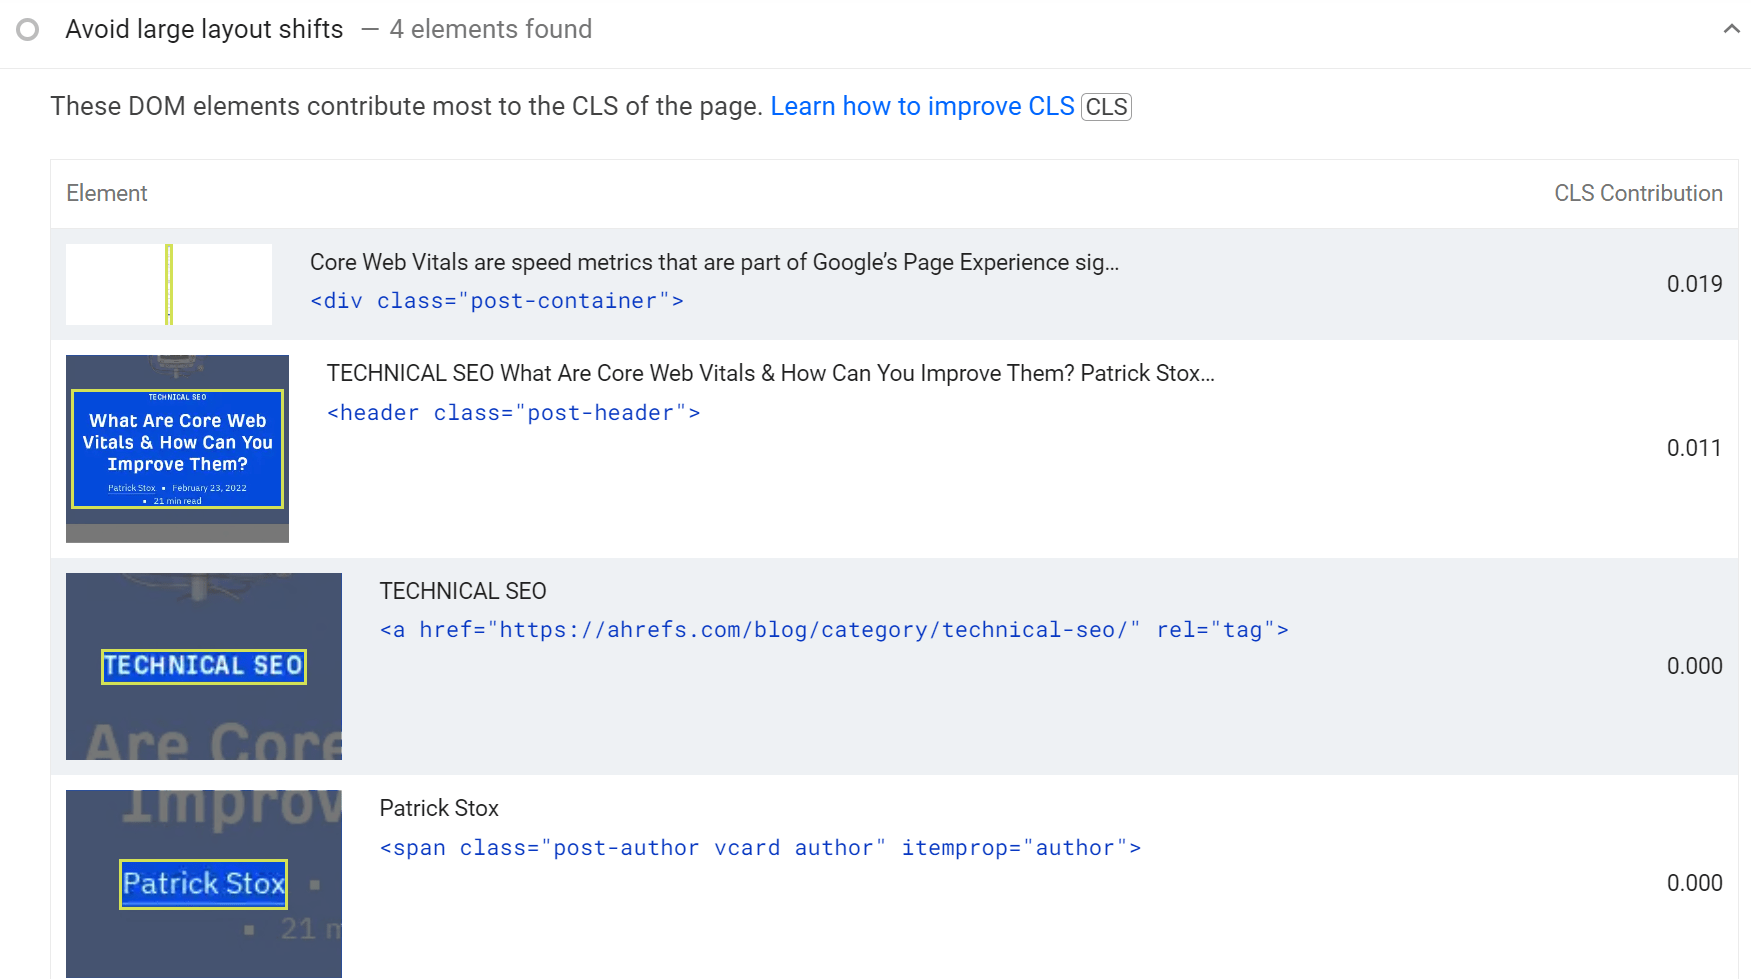
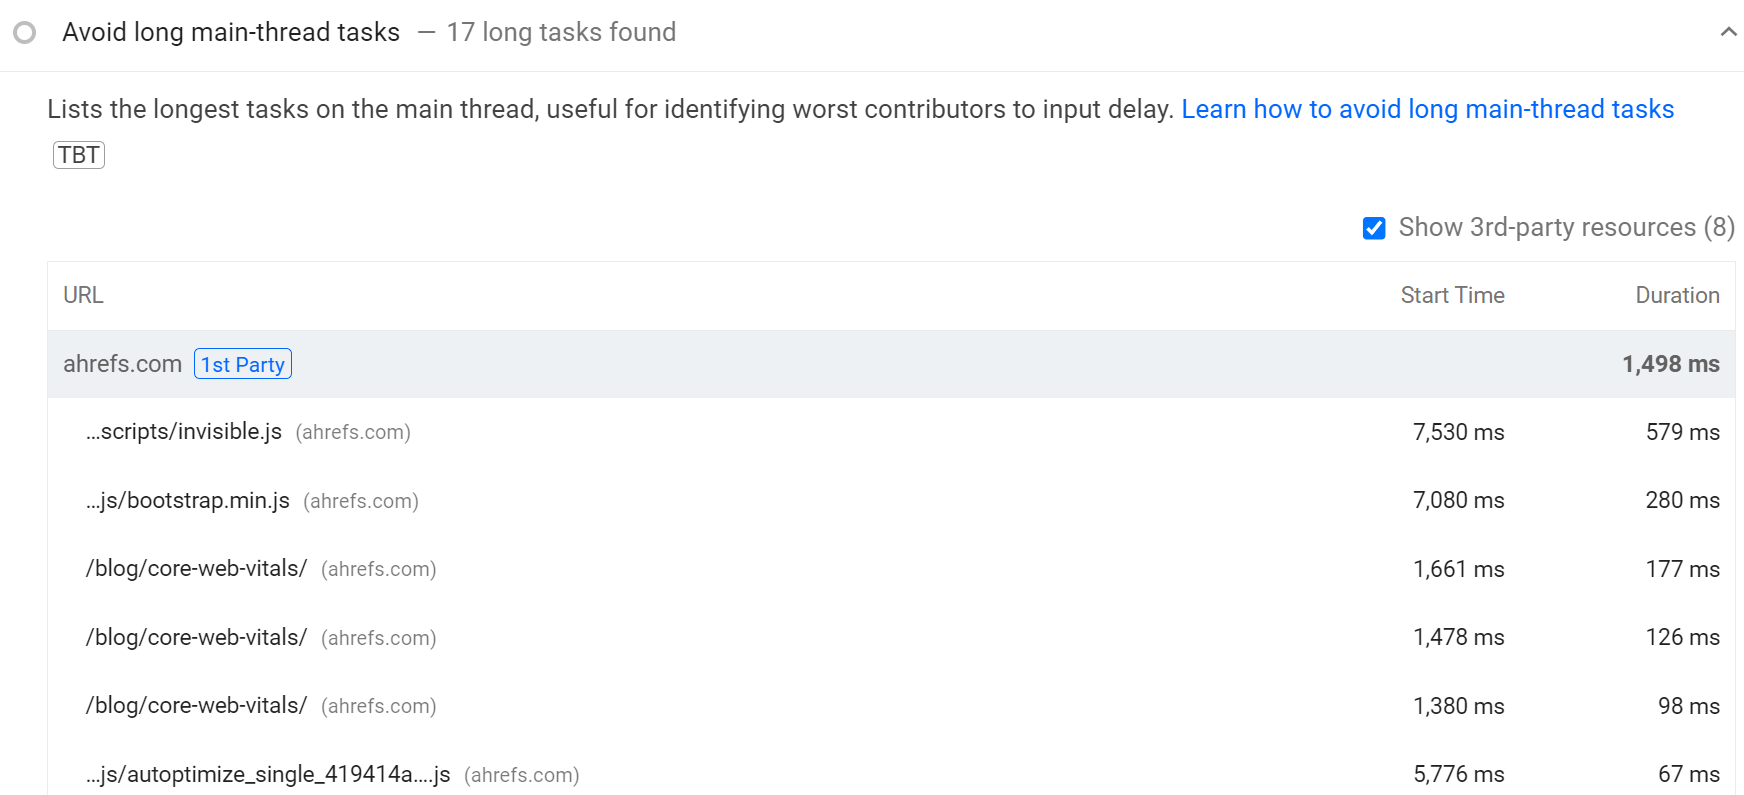
There is additional information that shows what the LCP image is, what elements are causing CLS, and what elements are blocking the main thread (what you need to reduce to improve FID/INP). This information can help you target fixes toward these elements.
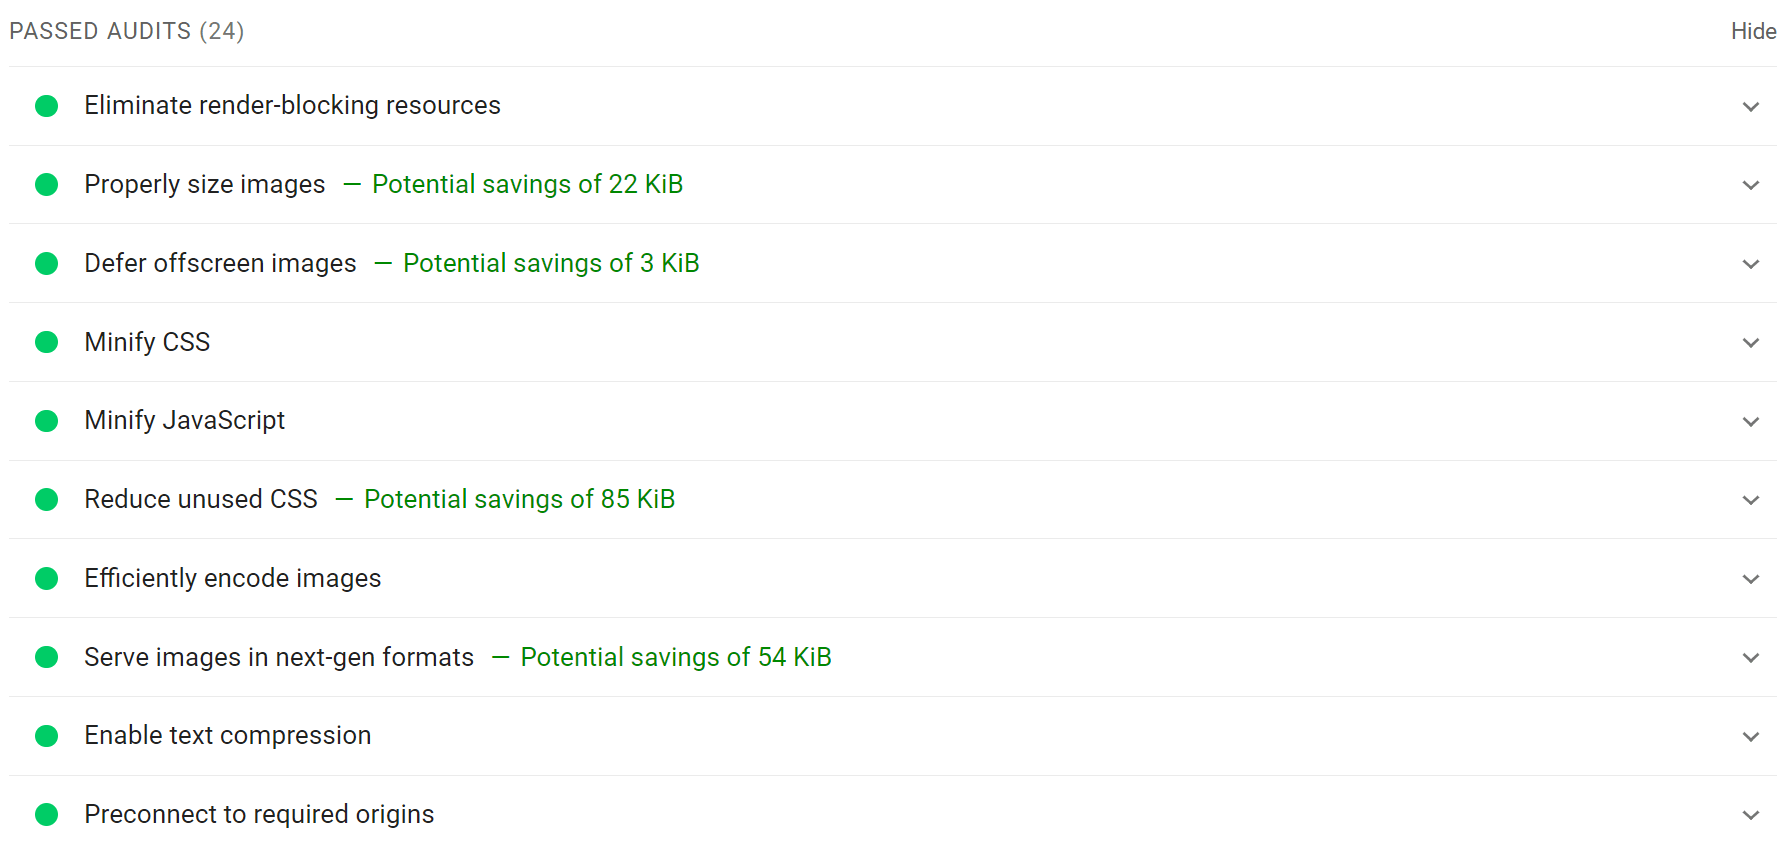
There’s also a section for passed audits, showing you where you’re already doing a good job. You may still be able to improve these. But you’re likely better off spending time on other issues.
PageSpeed Insights has a great API. It lets you pull the field data from CrUX and the lab data from the Lighthouse test. You can also get page-level CWV data in bulk that can only be accessed via PageSpeed Insights.
The problem is that not everyone has the skills to query the data in bulk and store it. But we make it easy for you in Ahrefs’ Site Audit. Follow the instructions for setting up CWV in the Crawl settings.
Grab and store your PageSpeed Insights and CWV data with Site Audit
When you run a crawl, we’ll pull the data from PageSpeed Insights into the Performance report, and you can drill into problematic pages.
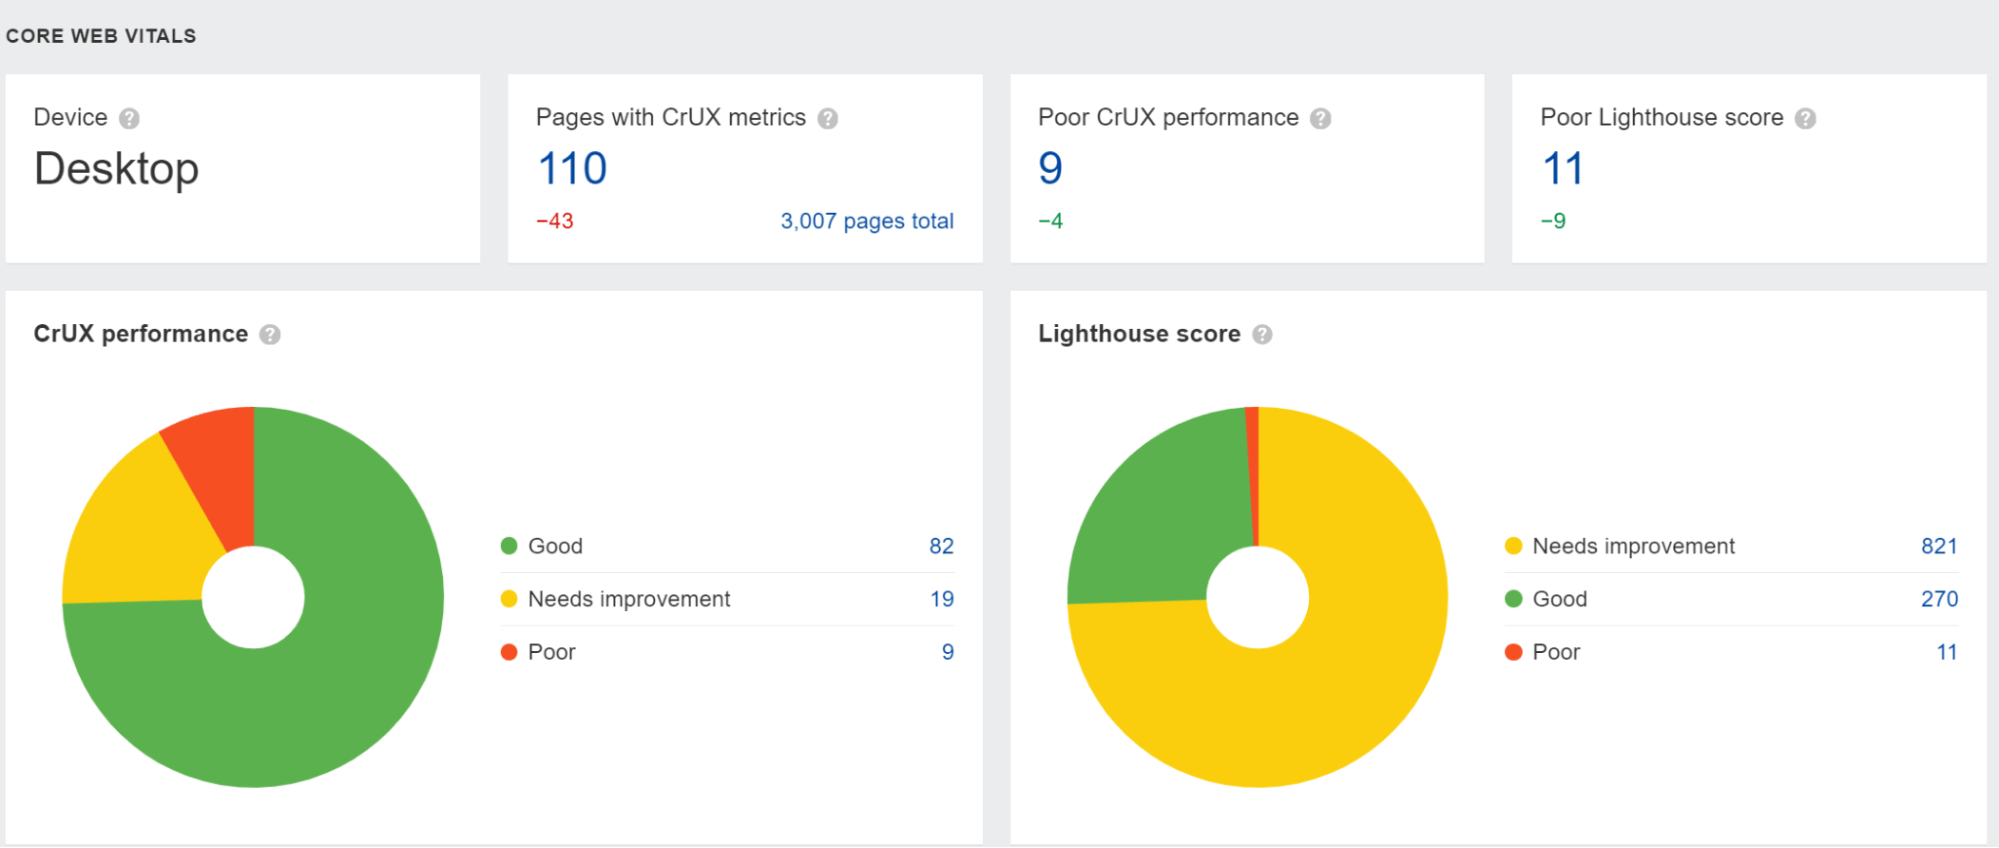
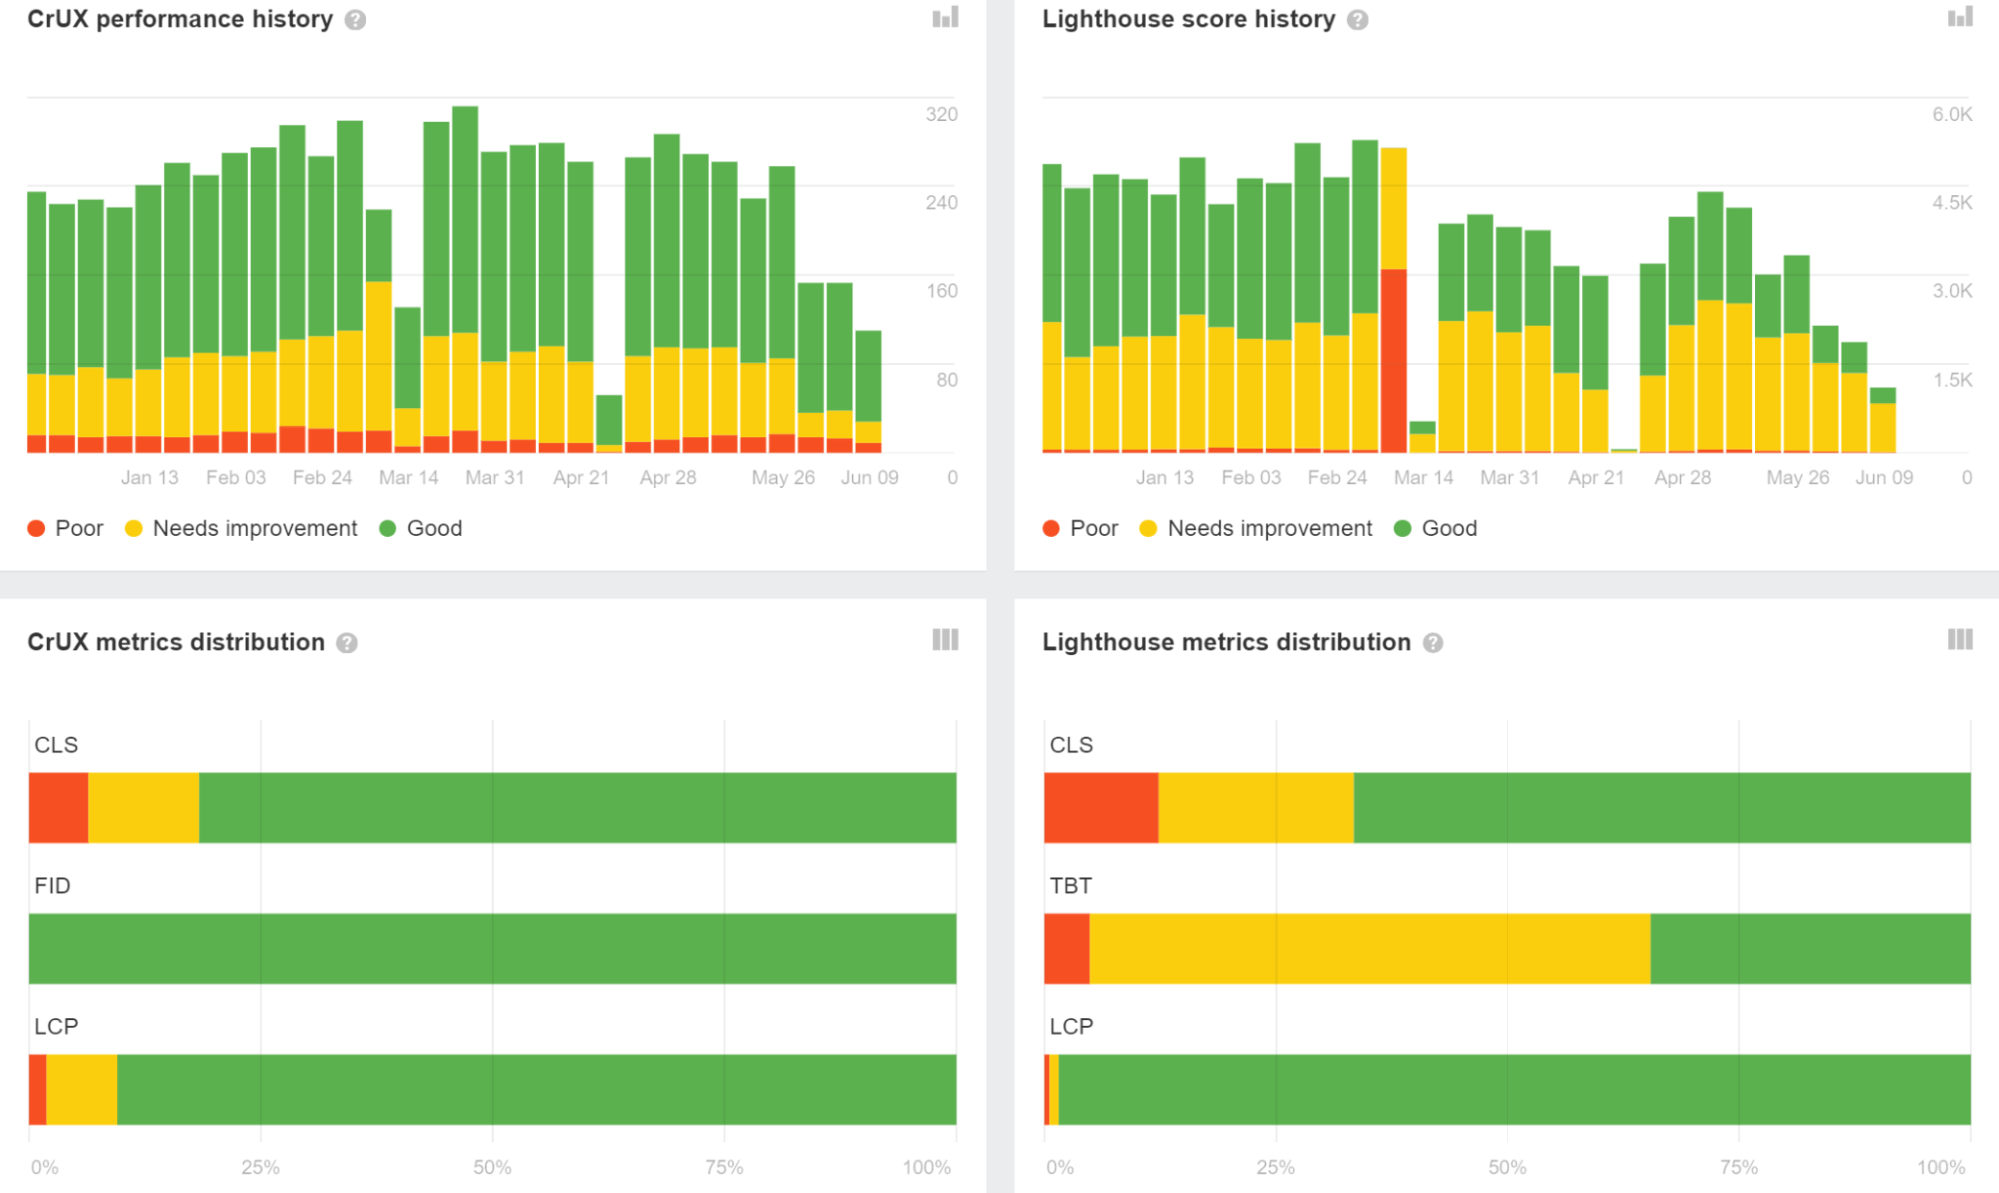
We also show the data from previous crawls, which you can use to monitor performance over time. Additionally, you can see the distribution of affected pages for each individual metric.
Free tool: Check CWVs and Lighthouse metrics for desktop and mobile for up to 10 pages or websites
Here’s another free tool that you can use to check up to 10 pages or websites at once to see how you compare to your competitors.
Setup:
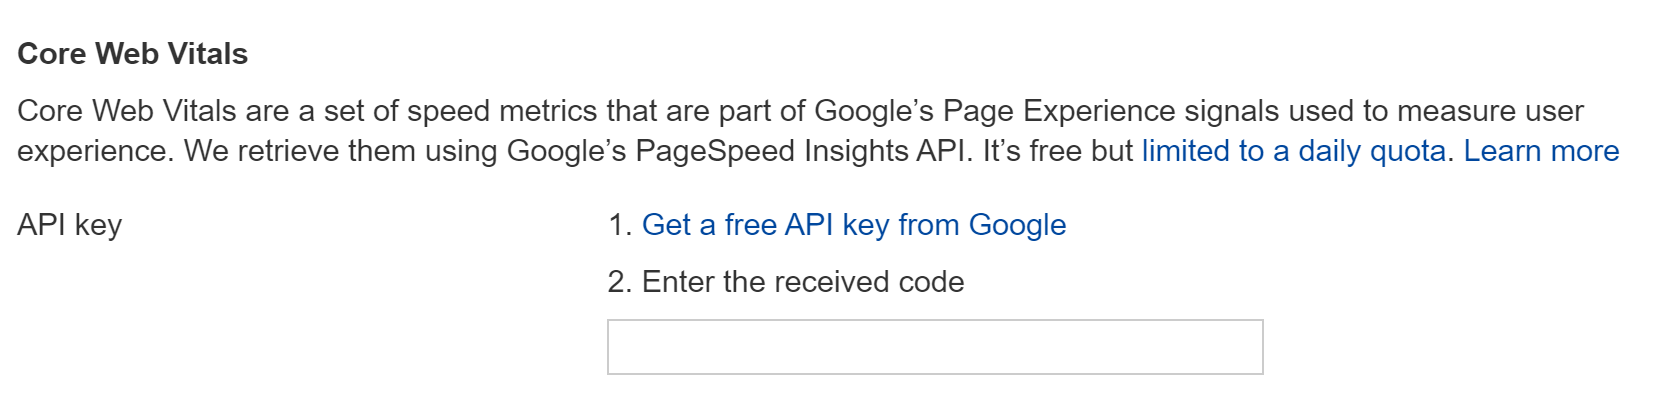
- Enter your Google PageSpeed Insights API key into the designated input field. (Learn how to generate an API key here.)
- Add the URLs you want to analyze (one per line).
Run the Analysis:
- Click on the “Check CWV” button to start fetching metrics. A progress indicator will show the status of the requests.
View Results:
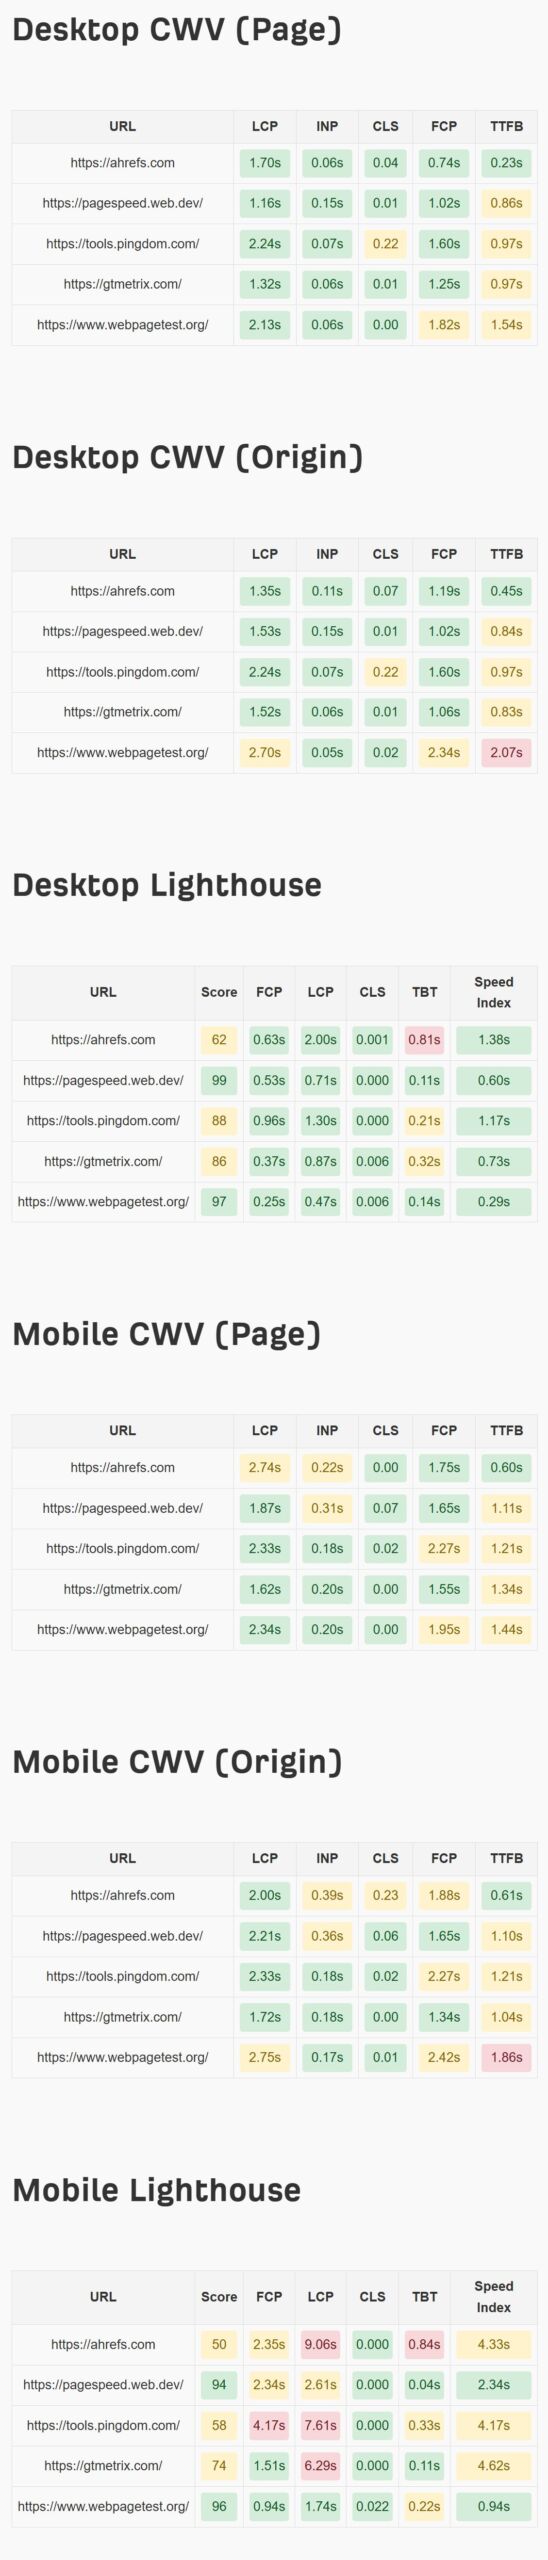
- The results are displayed in neatly categorized scorecards:
- Desktop CWV for the Page
- Desktop CWV for the Origin
- Desktop Lighthouse
- Mobile CWV for the Page
- Mobile CWV for the Origin
- Mobile Lighthouse
- Each metric is color-coded to show performance:
- Green: Good
- Yellow: Needs Improvement
- Red: Poor
Page Speed Tester
This is an example output to show you how the speed scorecards look. You can use it as a standalone tool: website speed test.
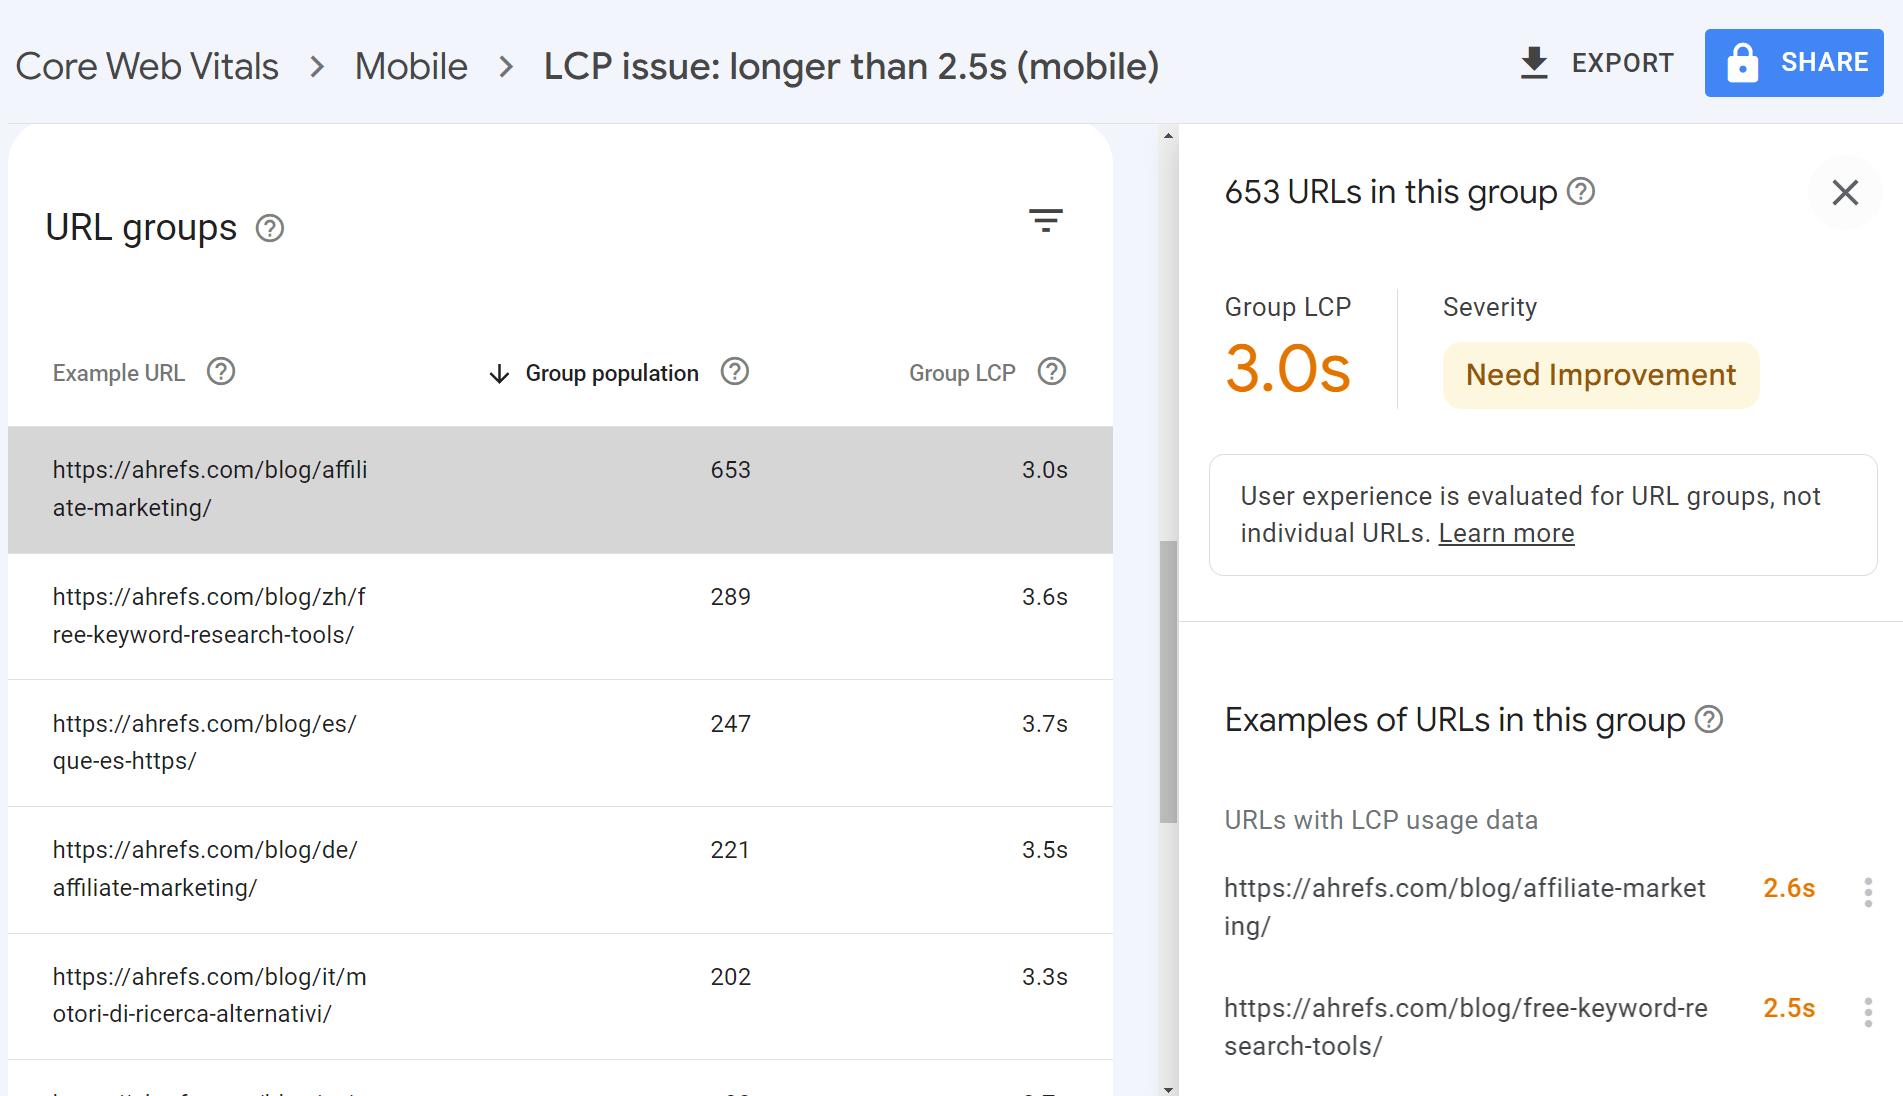
For evaluation and monitoring, I’d use Ahrefs, as shown above, to see the problematic pages and trends, as well as the Core Web Vitals report in Google Search Console (GSC).
The benefit of GSC is that it buckets similar URLs. For the bucketed pages, you will likely be working in one system or template. And when you fix the issues, you will fix them for all of the pages in that bucket.
Once you know what pages or templates you need to work on, you can use the guidance from PageSpeed Insights to make improvements. I’d also recommend checking out our guides on LCP, FID, and CLS for how to fix various issues.
To check the improvements, you can use PageSpeed Insights or run another crawl in Site Audit to get the data in bulk. The CWV data will take longer to show the impact of any changes because it is a 28-day average, so use PSI or the PSI data in Ahrefs to check if the changes you made improved the lab test metrics.
If you have any questions, message me on Twitter.