We wanted to look at the data to see how websites were doing and if we could glean any important insights.
The data we used is from the Chrome User Experience Report (CrUX), which is the source of Core Web Vitals data and is data from actual Chrome users.
In the public dataset, the data is aggregated at the origin (domain) level. We also wanted to look at page-level data, so we pulled over 5.2M pages with Core Web Vitals information in Ahrefs’ Site Audit.
Let’s dig in.
CrUX Data
Overall, we saw nearly 33% of websites passing Core Web Vitals thresholds. This is up ~10% from the previous year, indicating that websites are getting faster.
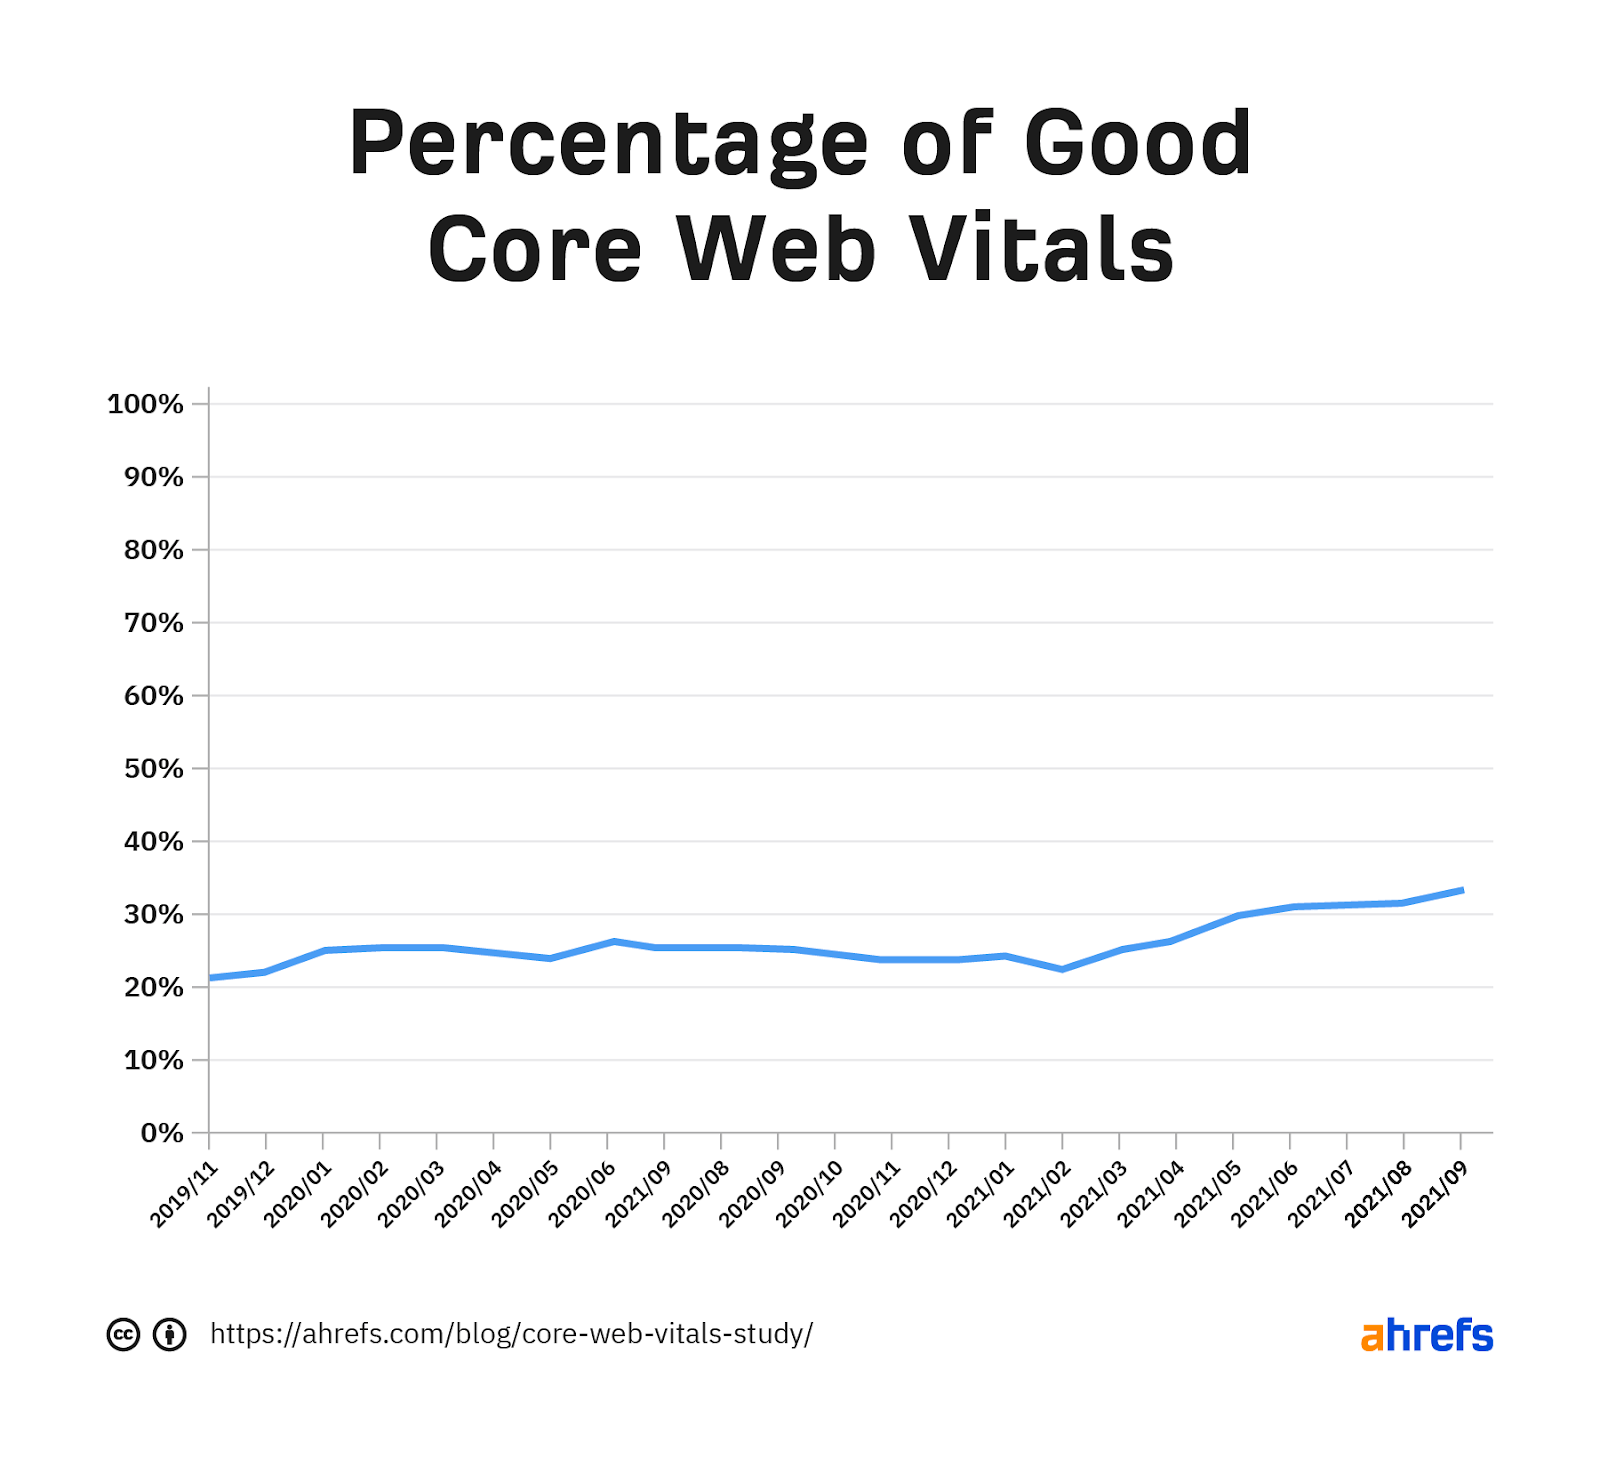
Percentage of websites passing Core Web Vitals thresholds.
The improvements are similar on desktop and mobile. Most of the focus in 2021 was on mobile results. But generally, improving speed on mobile pages also improves speed on desktop pages.
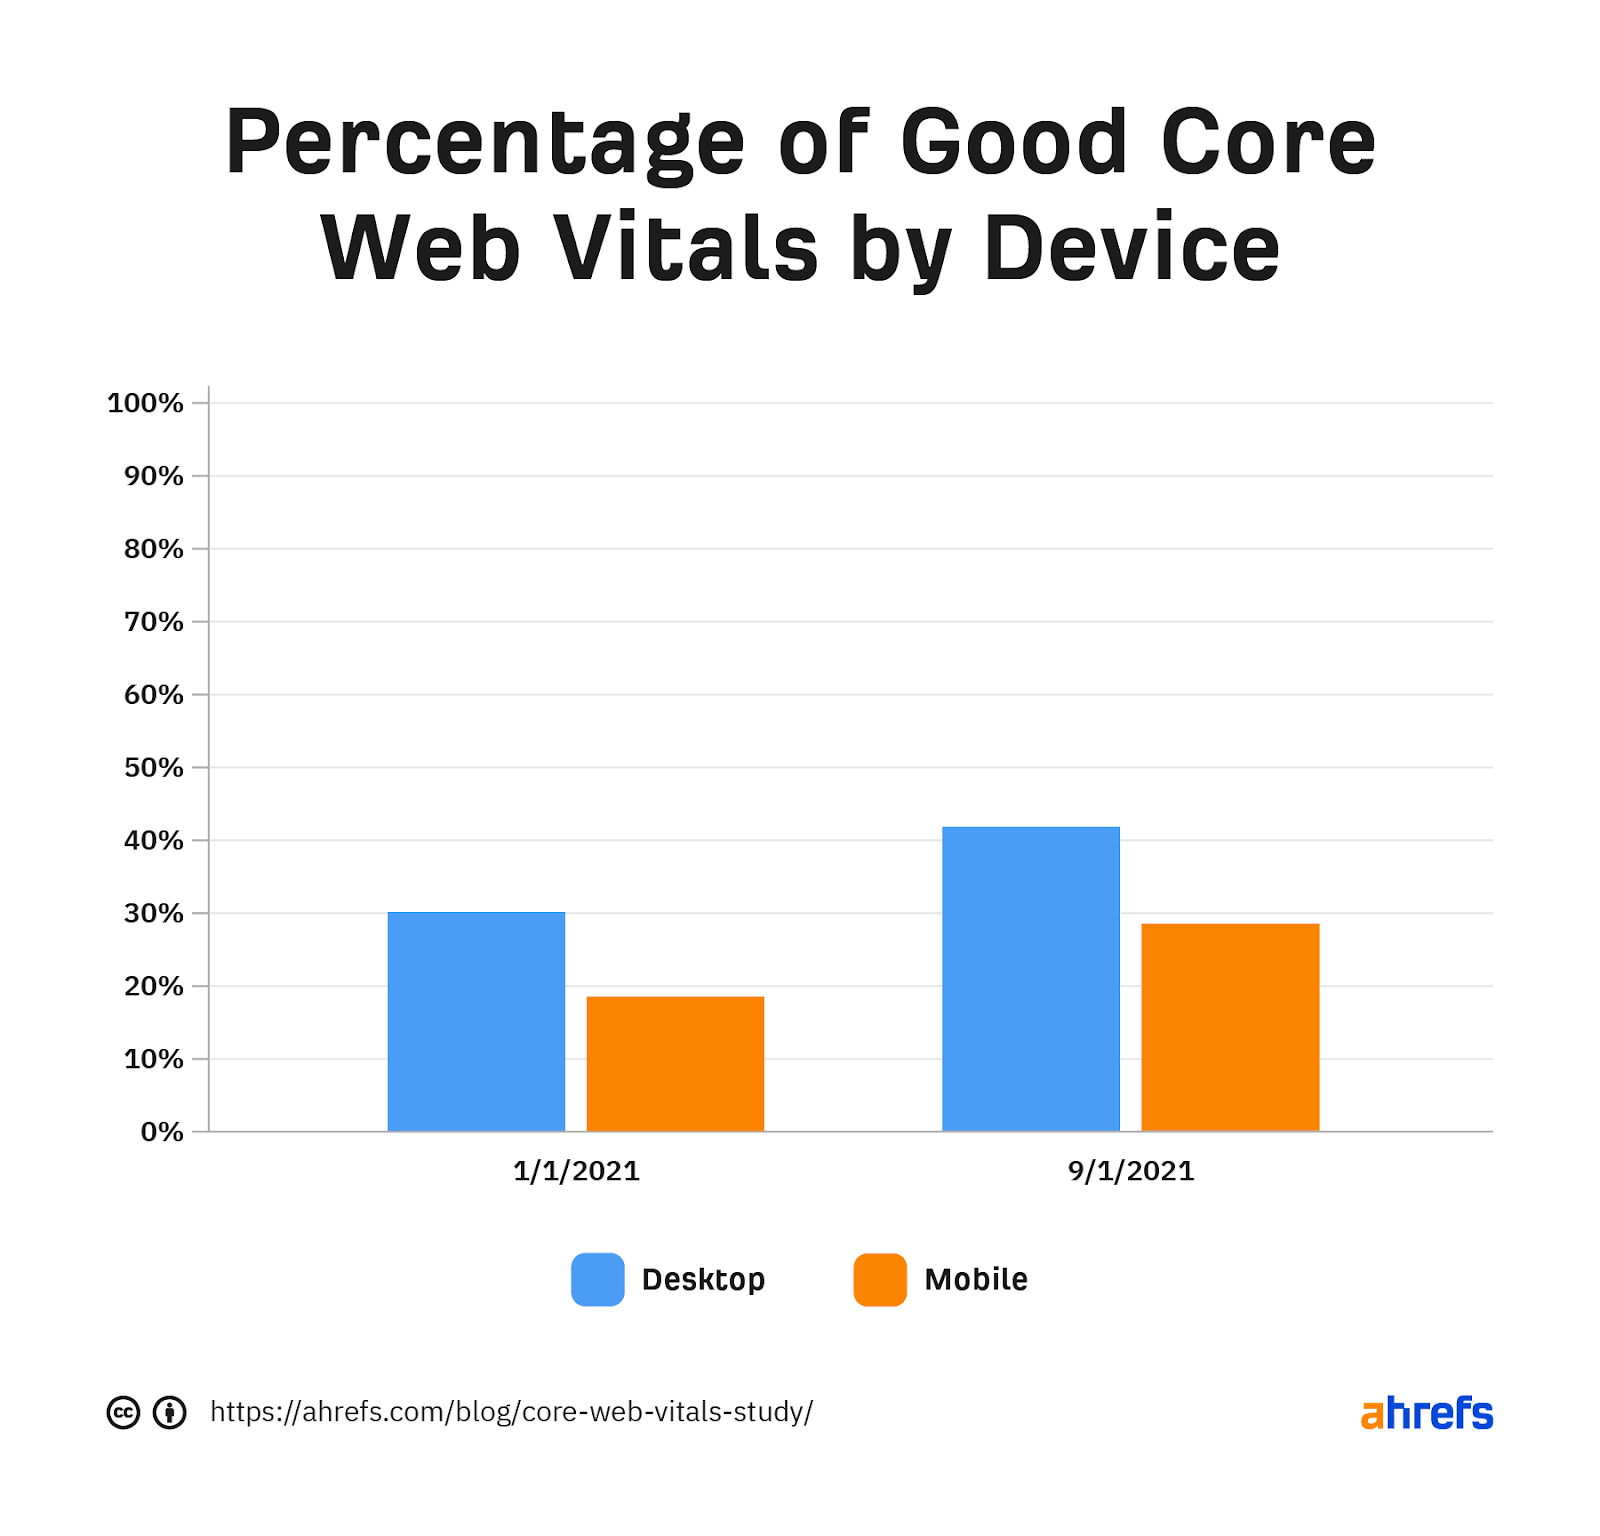
Core Web Vitals improvement by device.
Websites seem to be making progress on improving FID and CLS, but they are struggling with LCP. I’m not really surprised by this. LCP has the most components, making it the hardest to fix.
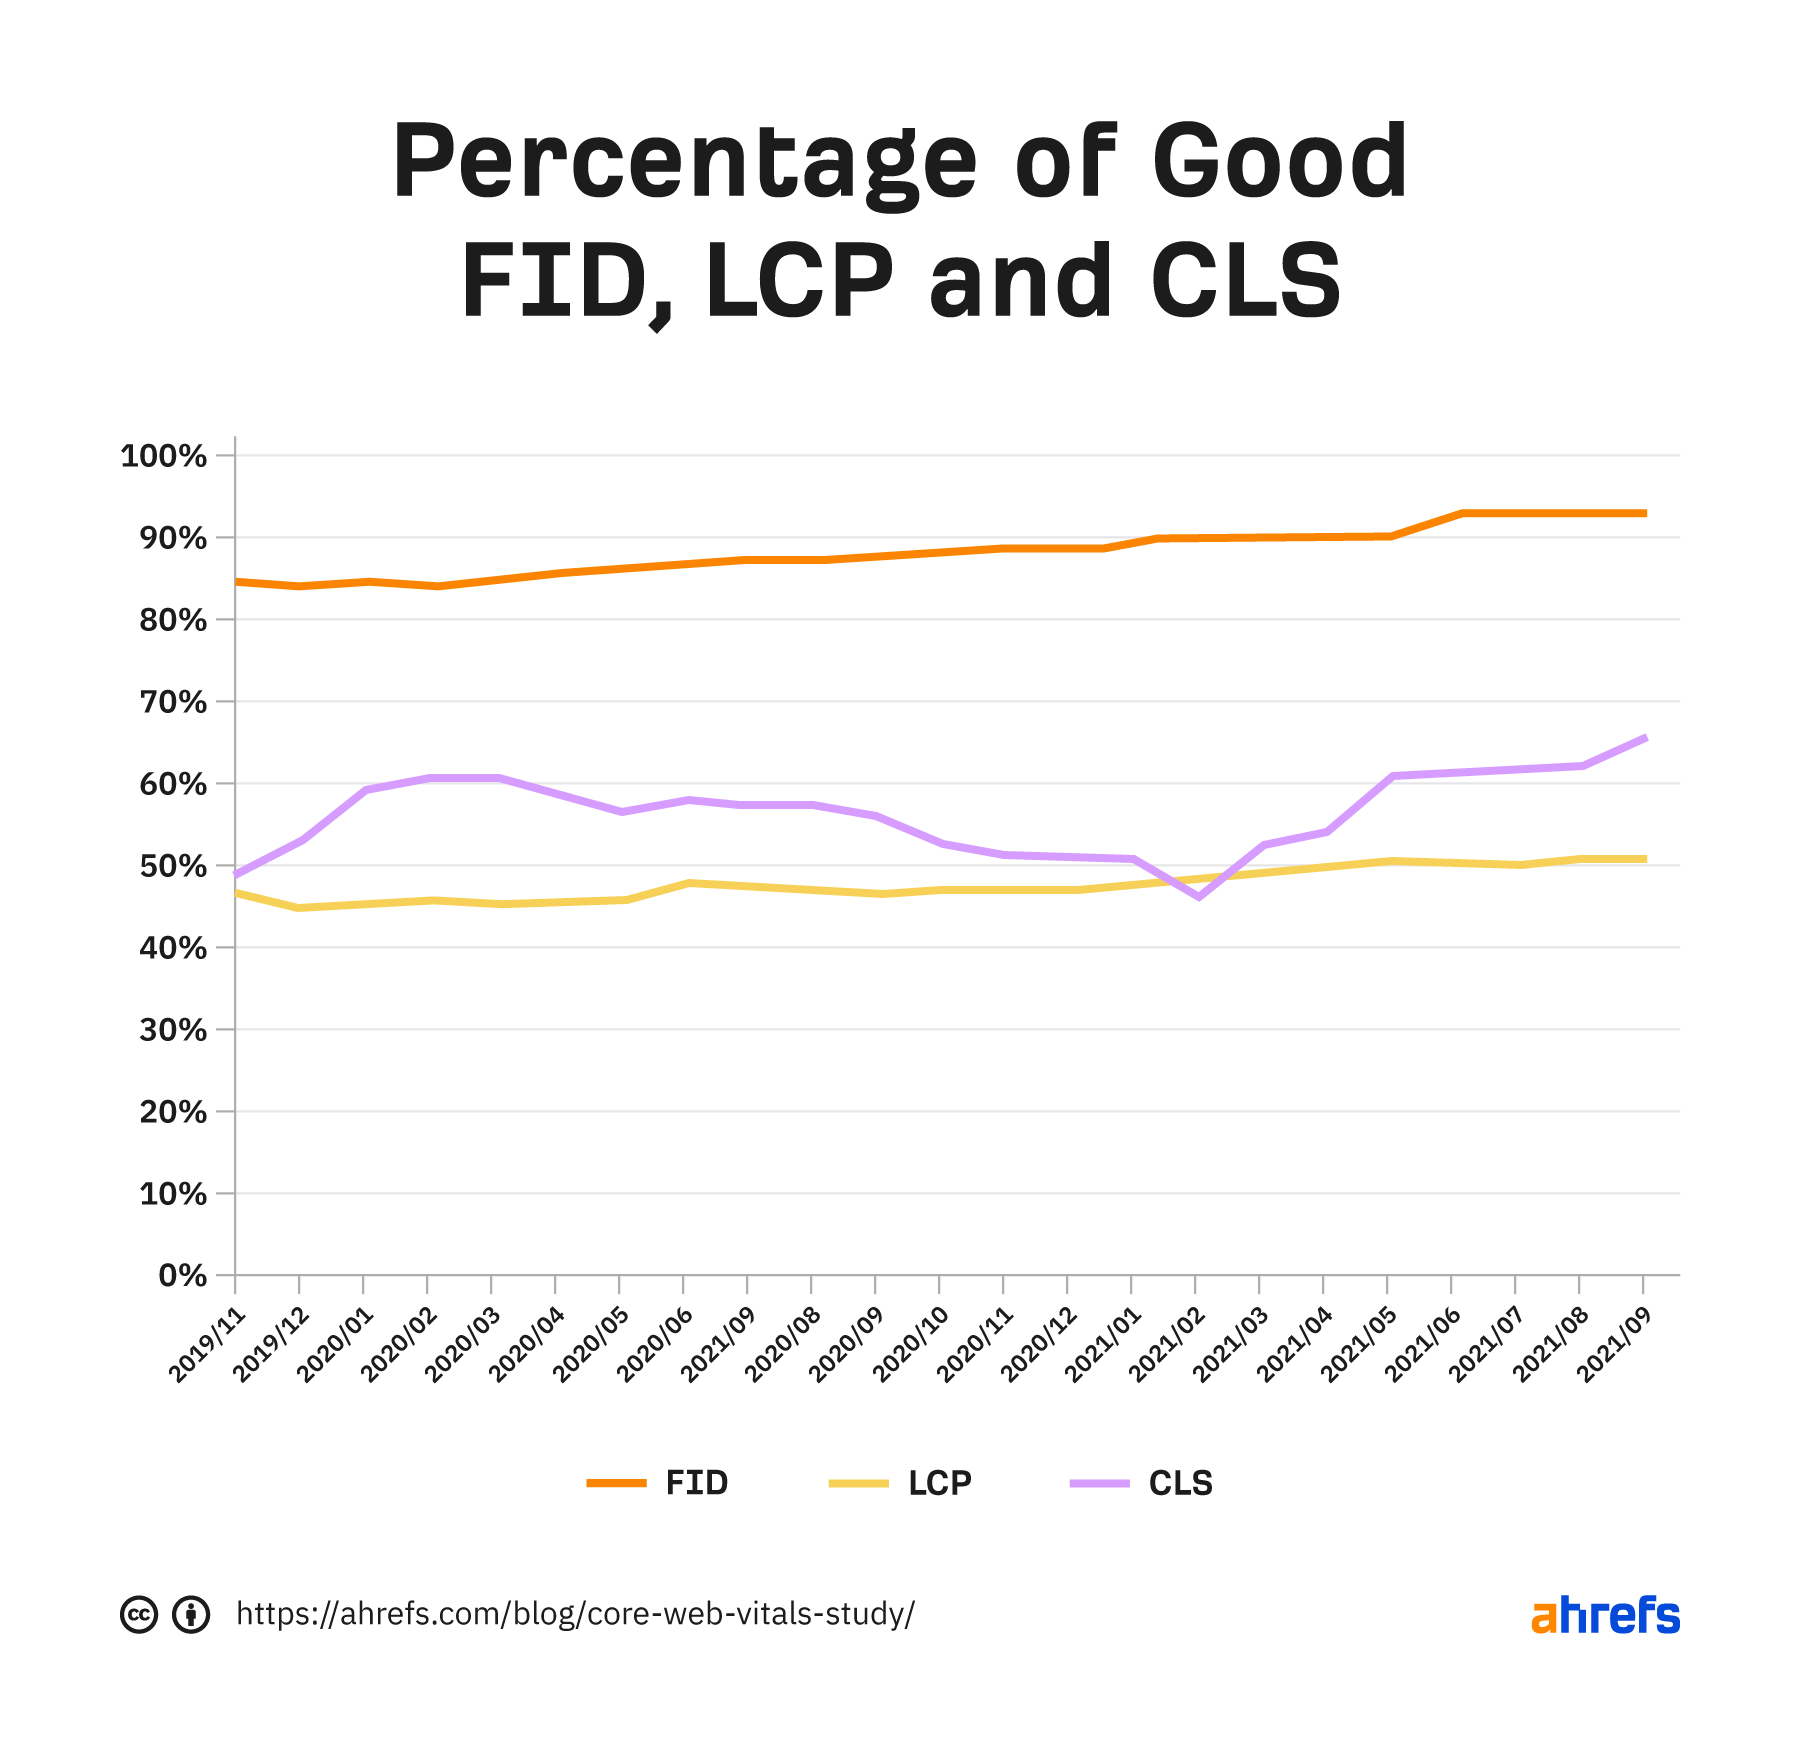
Percentage of good FID, LCP, and CLS over time.
Websites seem to struggle a bit more with LCP on mobile compared to desktop. It’s likely because of the connection speed and mobile CPUs having less processing power.
For FID, it looks like almost no one needs to worry about this metric on their desktop versions, and very few need to focus on this metric in general.
CLS is similar on mobile and desktop.
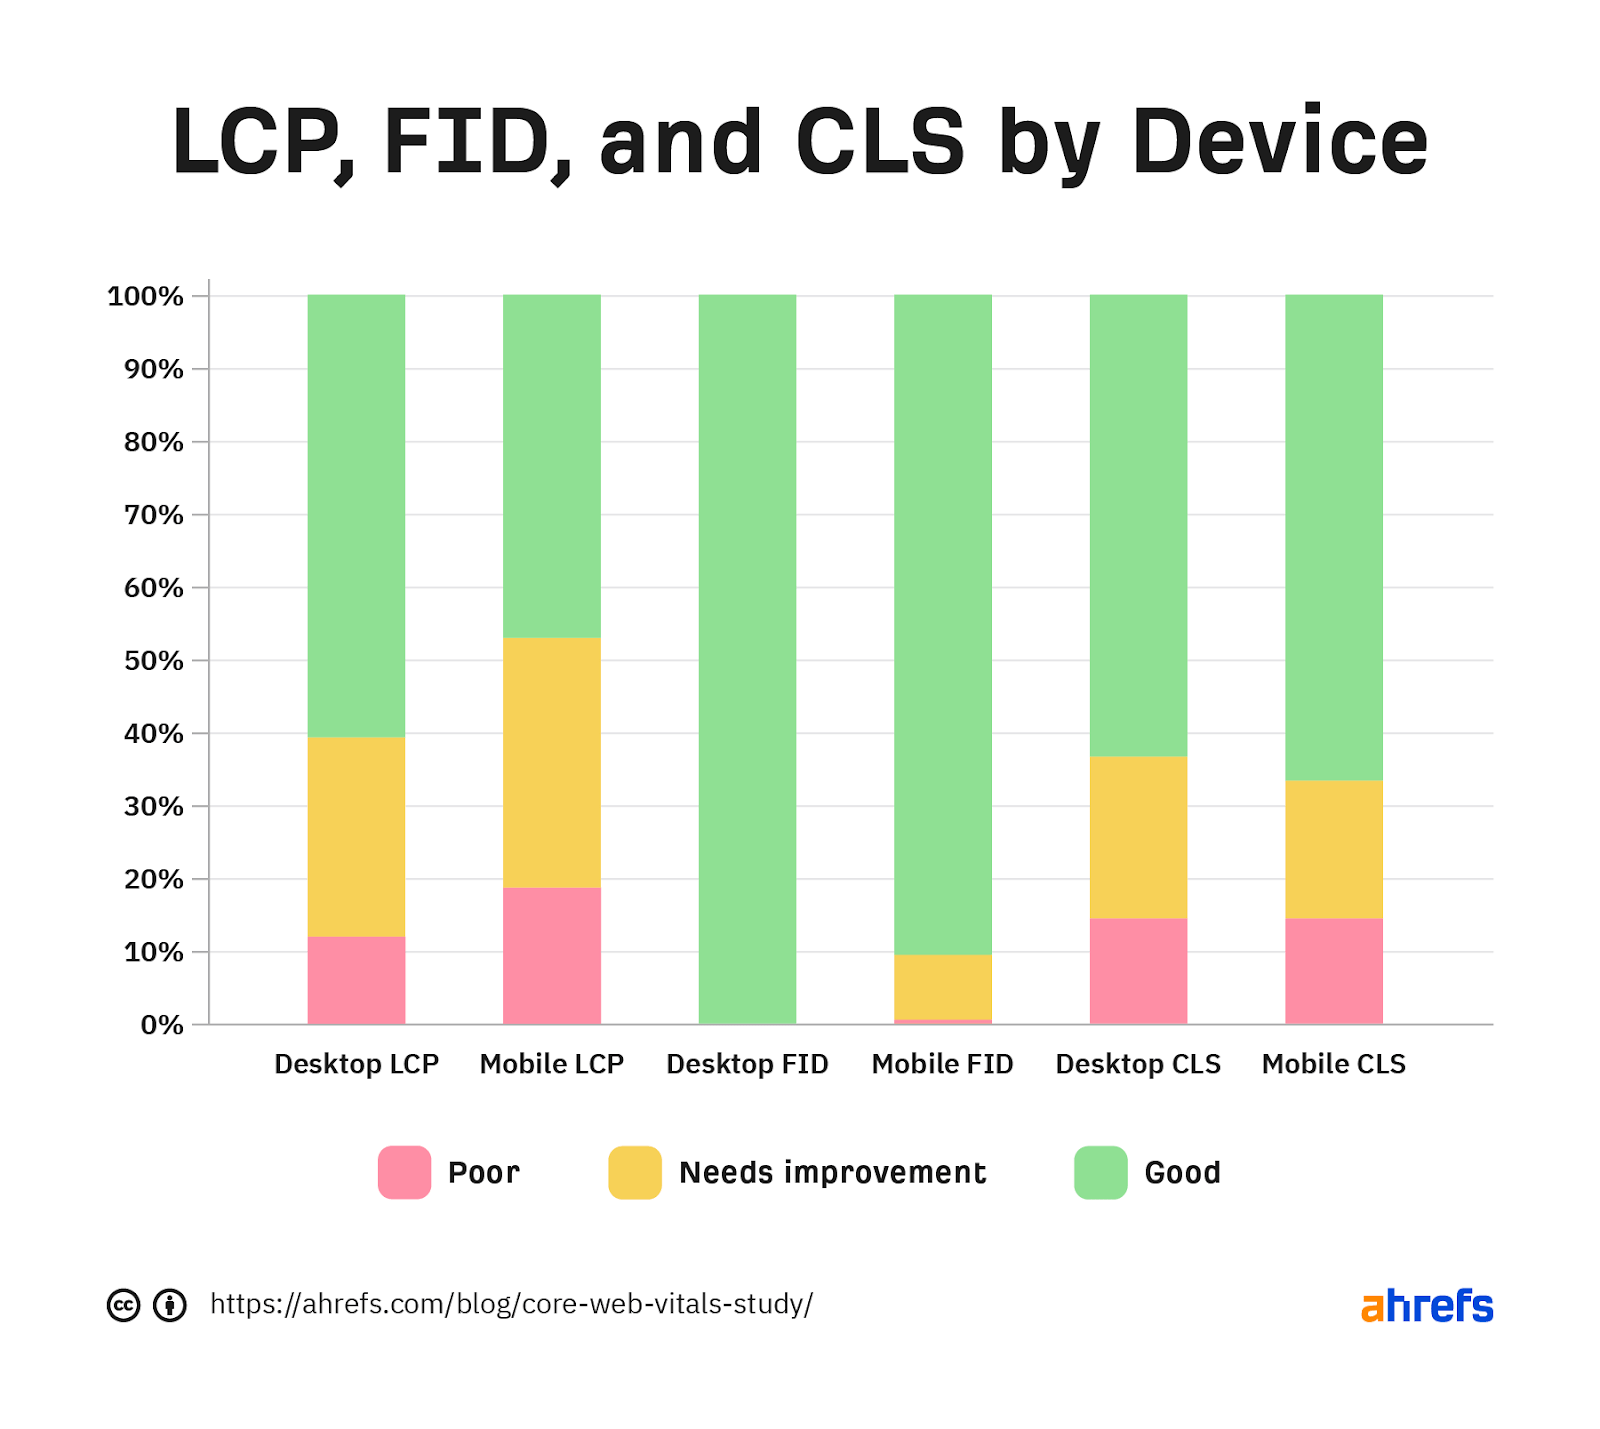
Further breakdown of LCP, FID, and CLS by device.
When you break down Core Web Vitals by connection speed, almost no sites on 3G or slower connections are passing. If many of your users are on slower connections or the internet in your country is slower, you’ll be fighting an uphill battle.
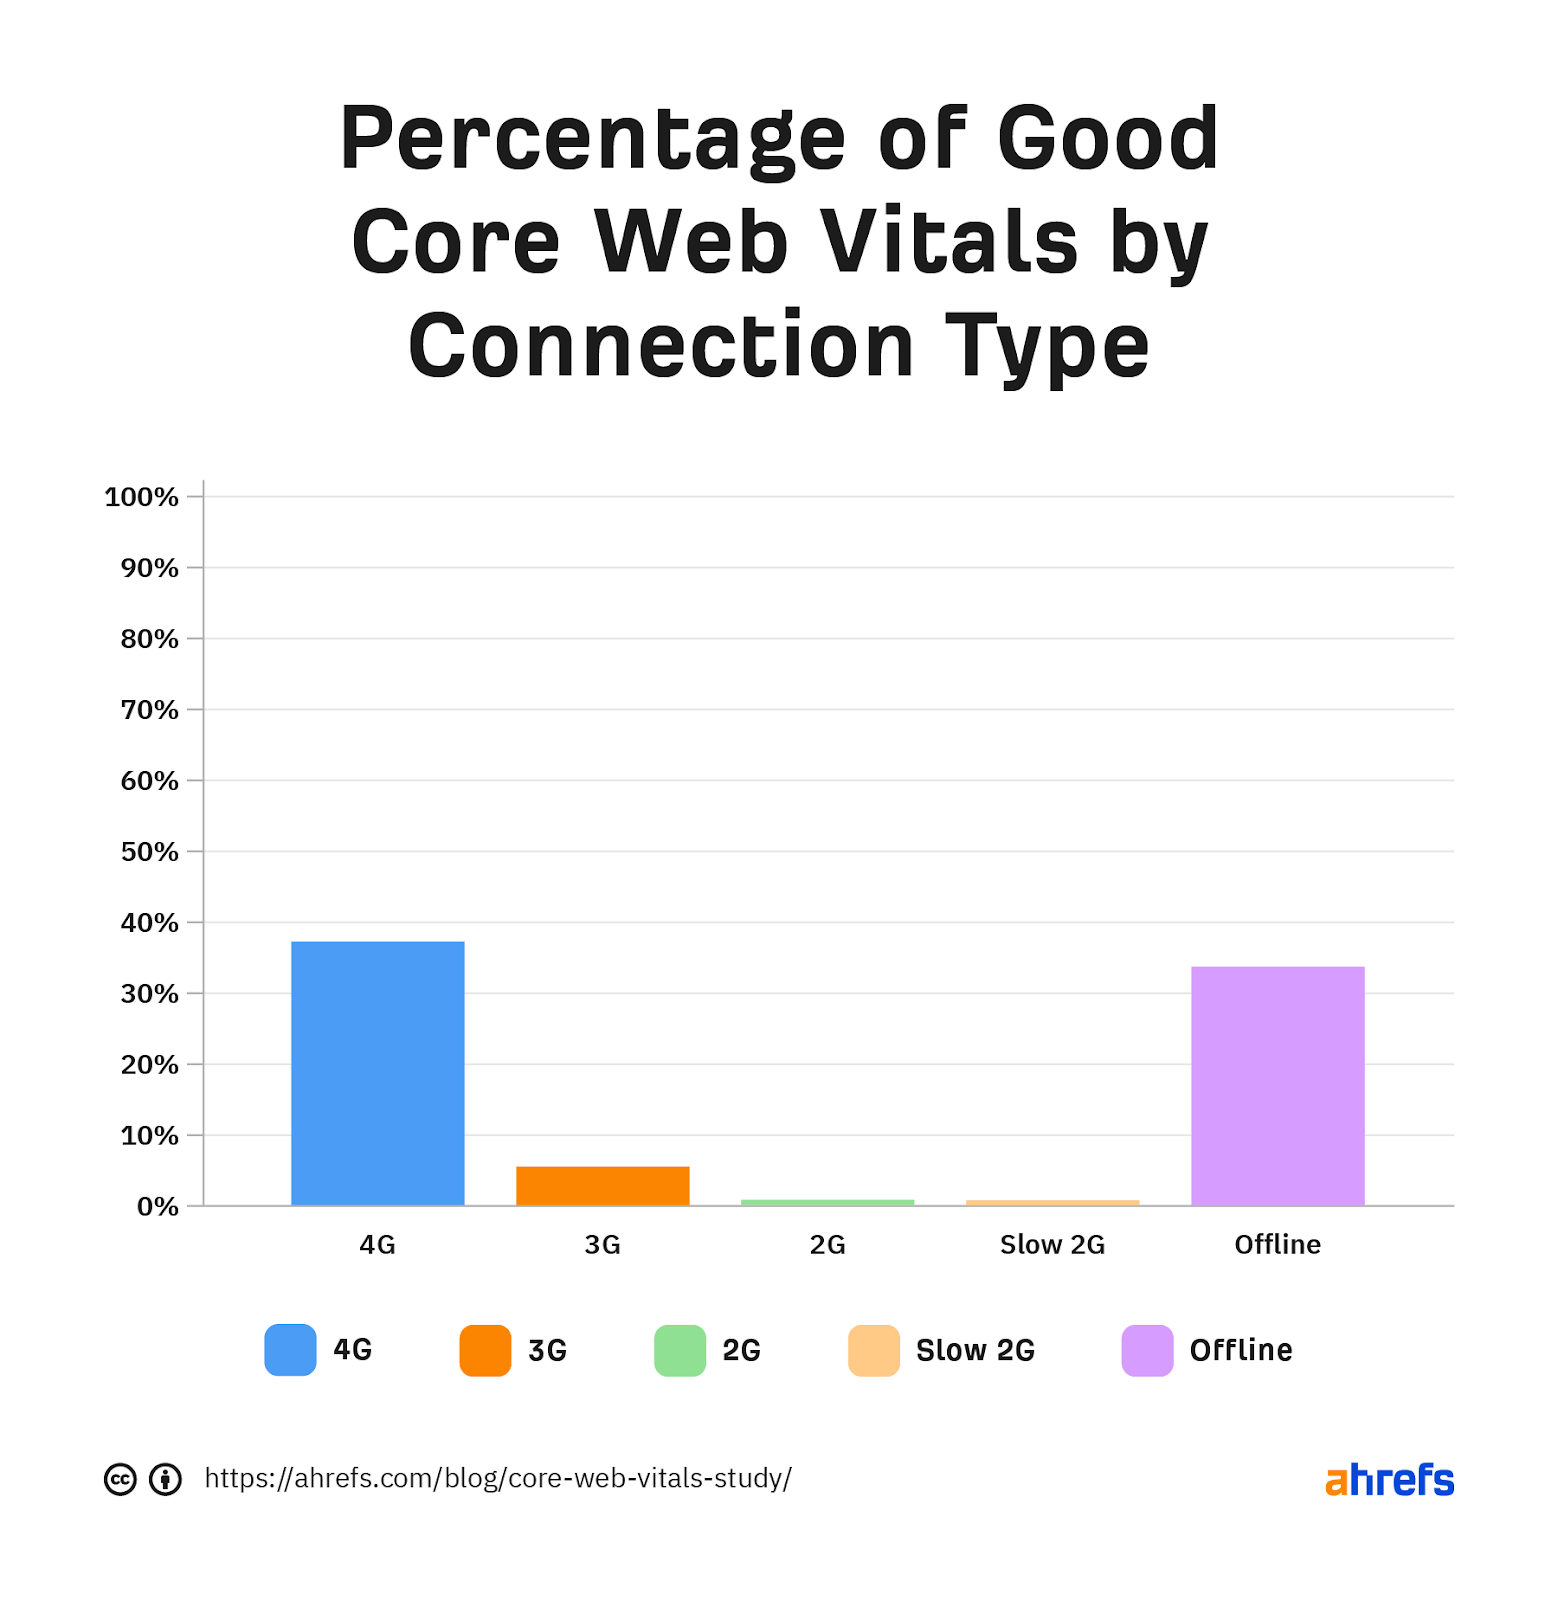
Passing Core Web Vitals by connection type.
Here’s another way of looking at the data with the individual metrics broken down by connection speed. The LCP threshold seems almost impossible to pass on slower connections.
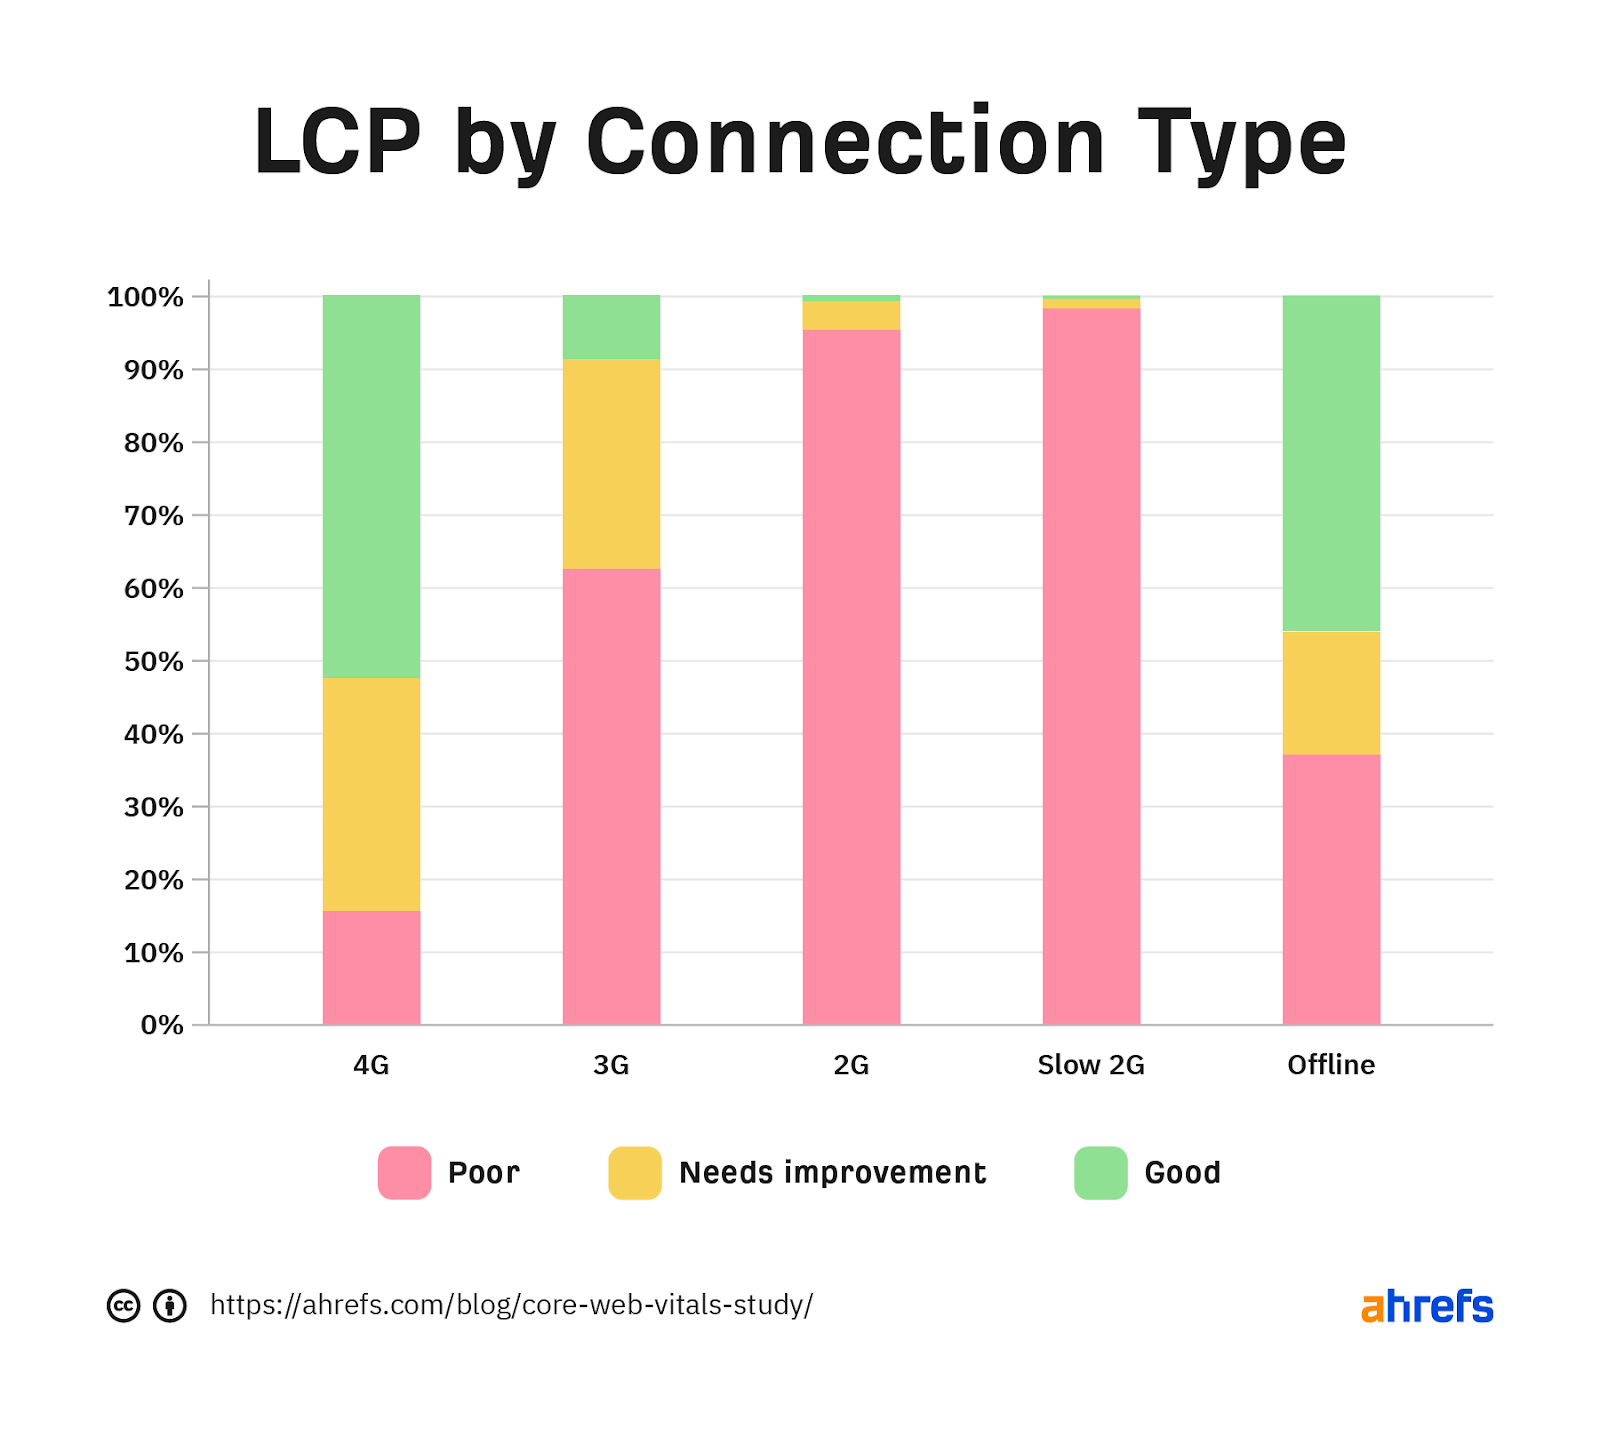
Breakdown of LCP by connection type.
Few sites need to worry about FID, even on slower connections.
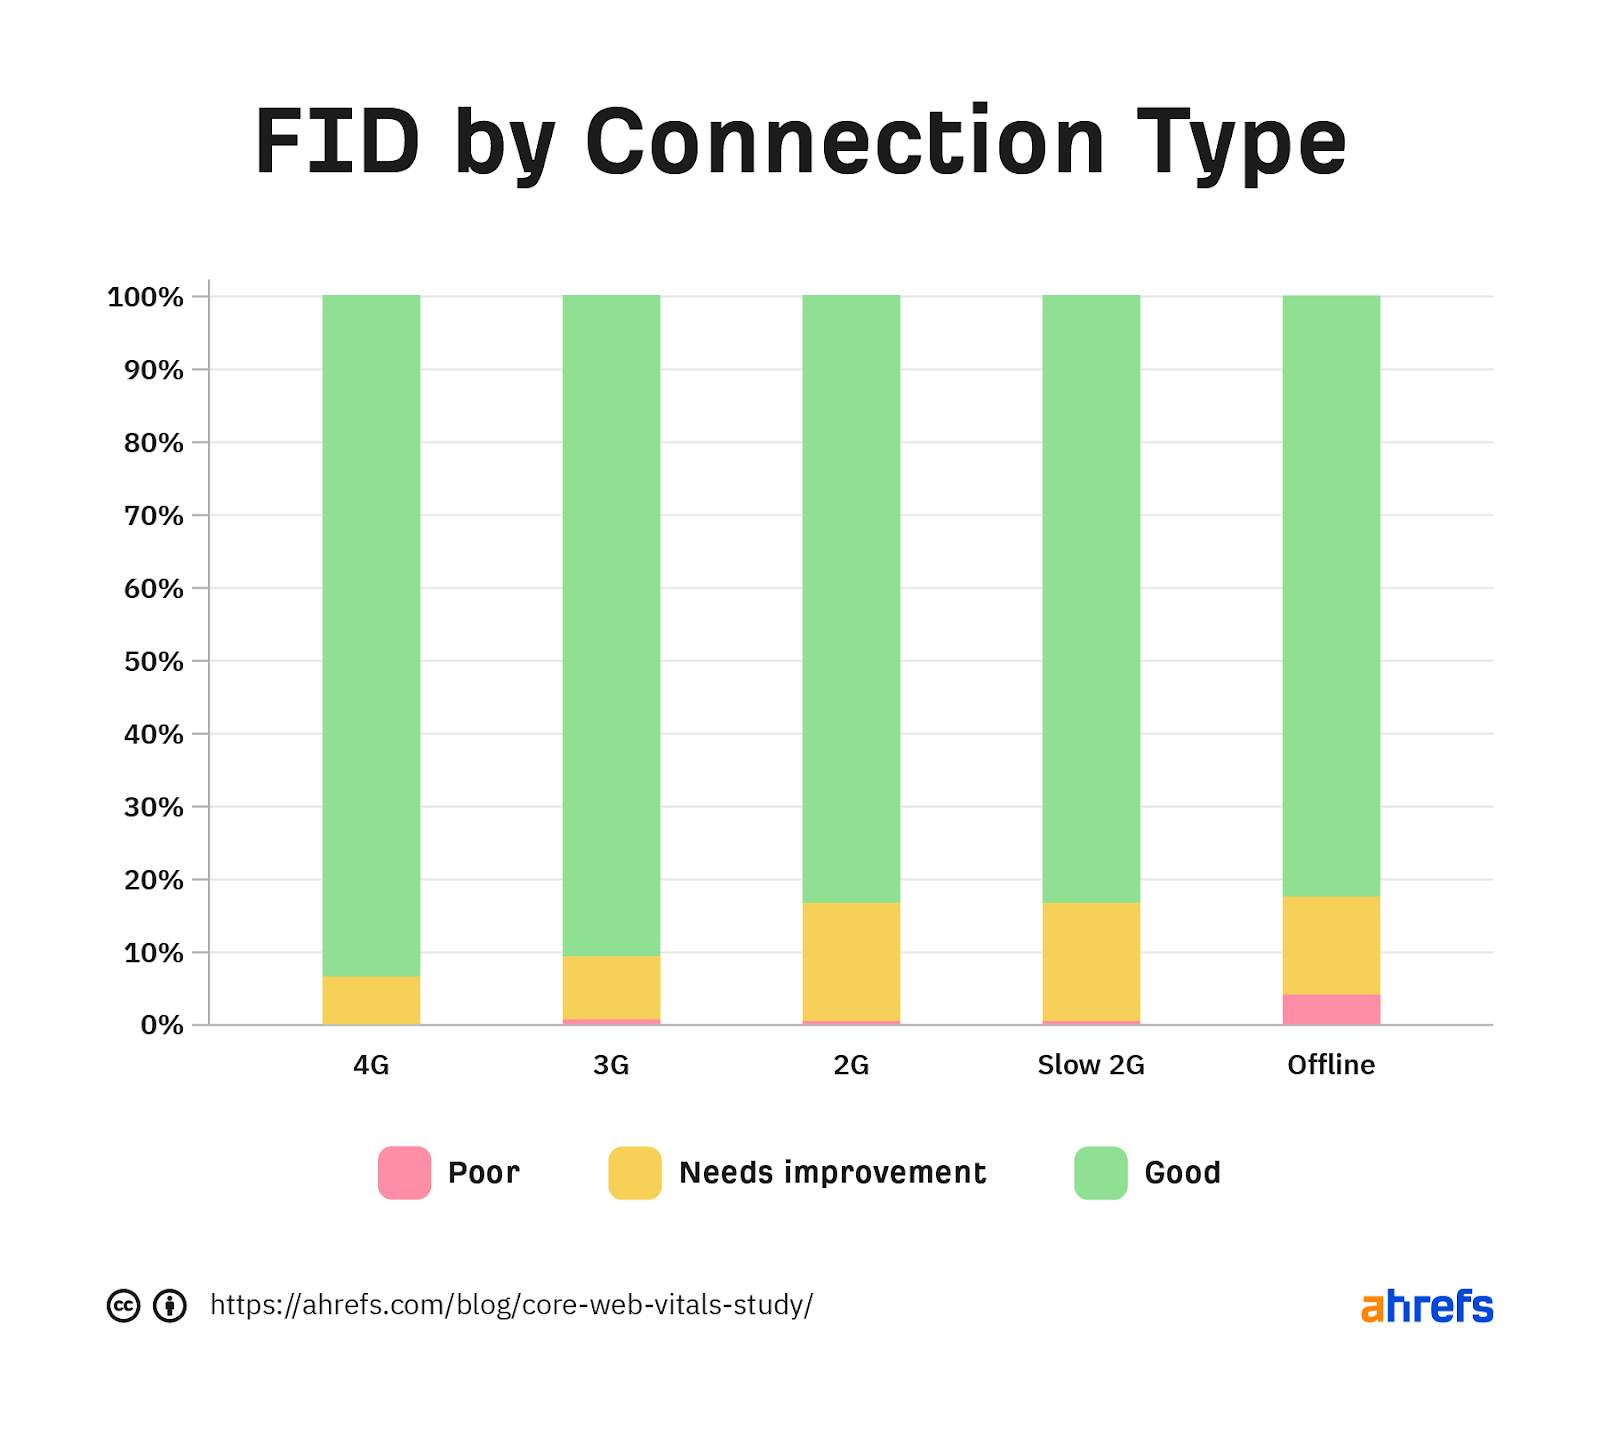
Breakdown of FID by connection type.
Many sites struggle with CLS on slower connections.
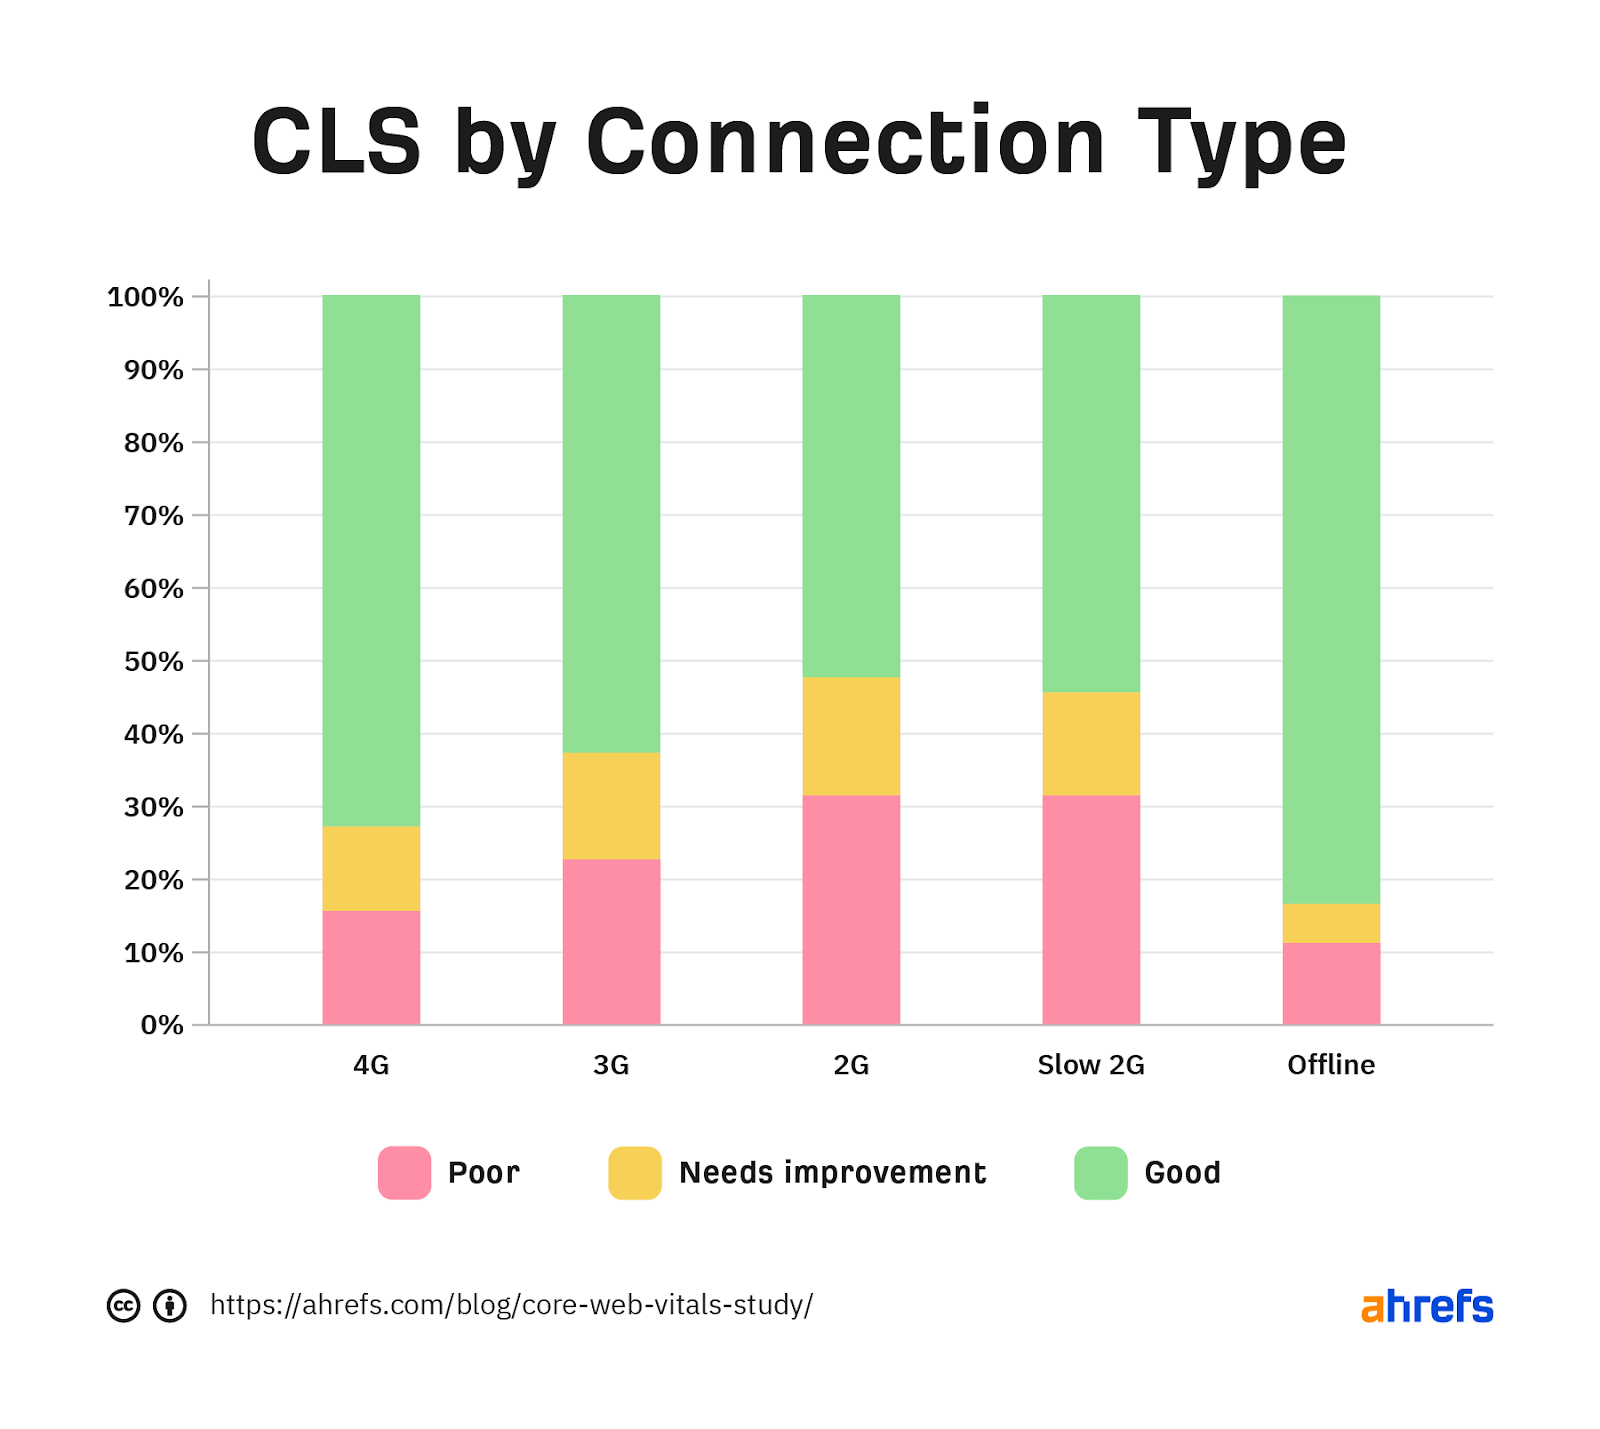
Breakdown of CLS by connection type.
The location of your users seems to have a big impact. Different countries have different device preferences and different network infrastructures. If your users are in a country where everyone uses desktop devices with fast internet, your website will more likely have good Core Web Vitals. The opposite is likely true for websites whose users are all using older phones and on slower connections.
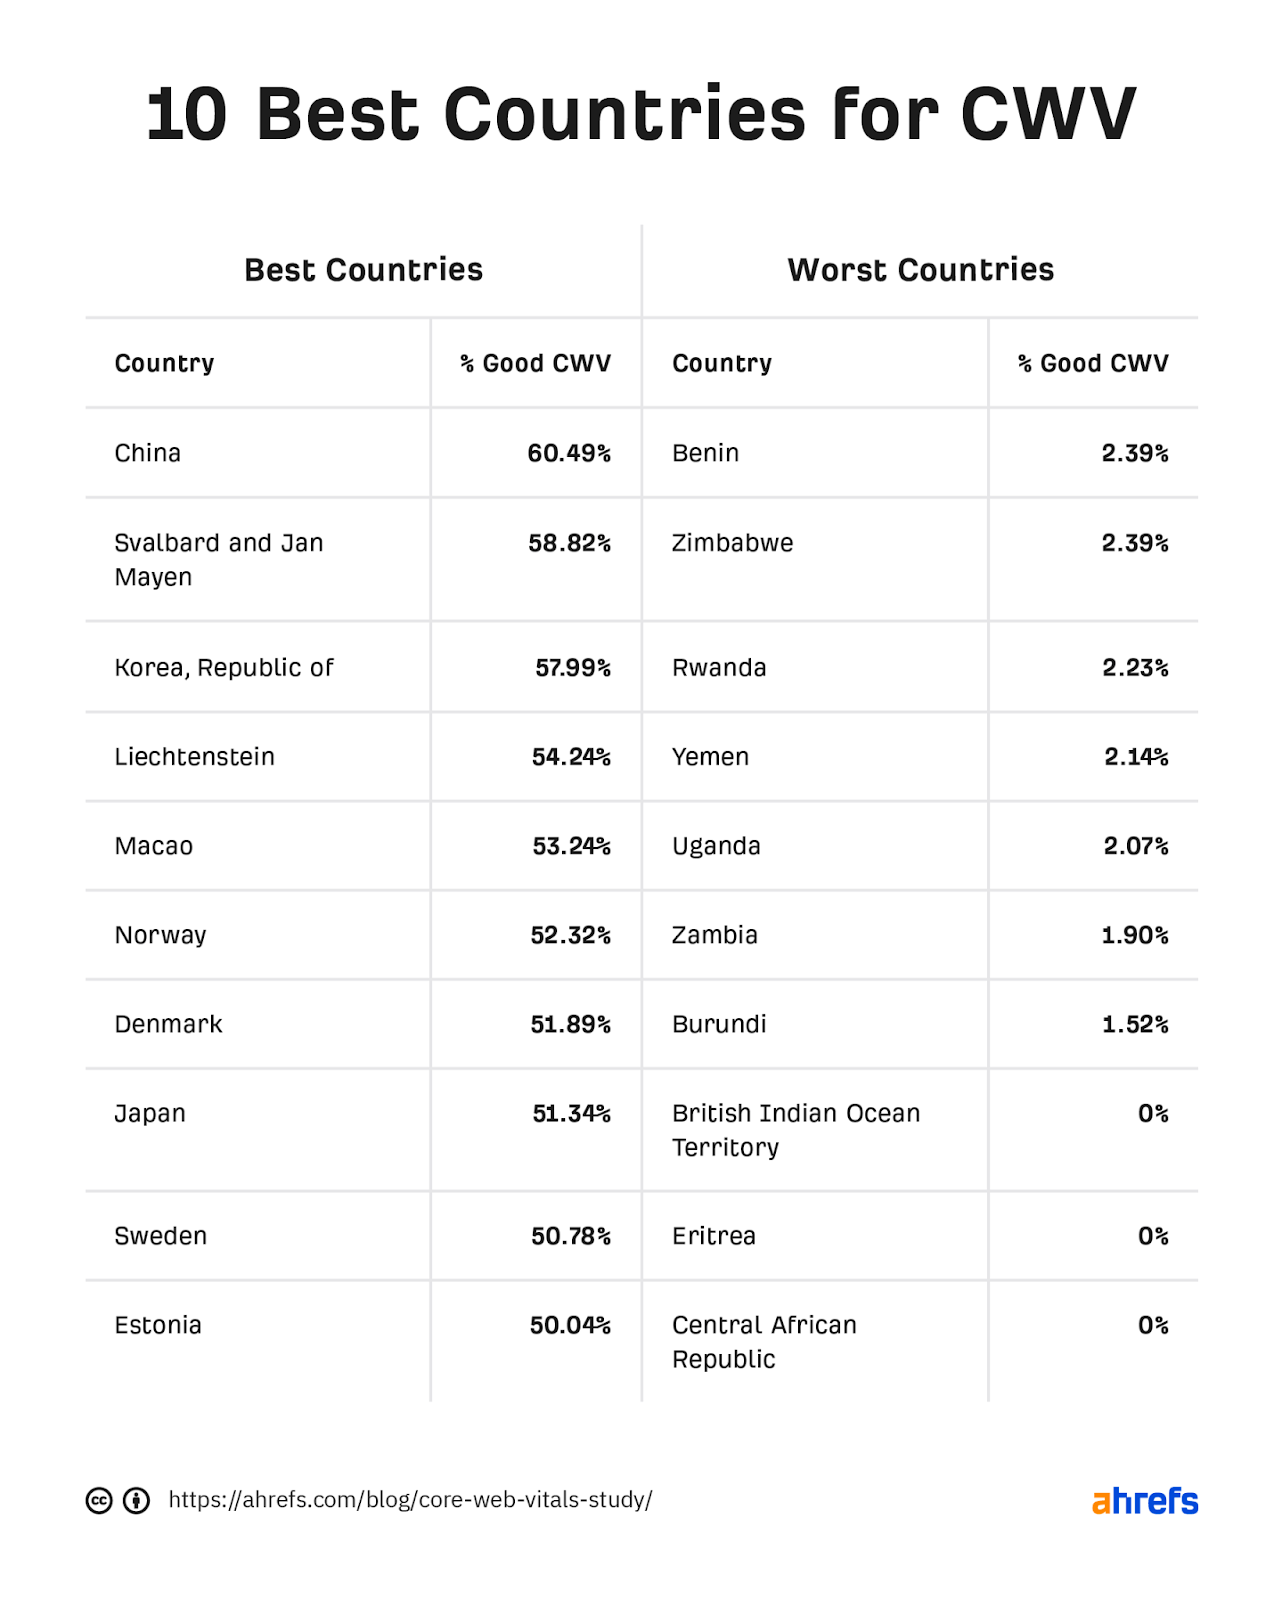
The U.S. is 38th in the data with a 41% passing rate. If you’re curious, here’s the full country data for August 2021.
Site Audit data
A quick thanks to Oleksiy Golovko for gathering this data from Ahrefs’ Site Audit. He pulled data from 43.66M unique pages. We found only 5.21M (~11.9%) had at least one Core Web Vitals metric, and 93% of those (or ~4.85M total) had all three metrics.
We also noted all of the pages had LCP (99.79%) and CLS (99.91%) metrics. The metric, FID, was missing the most and only available on 93.08% of pages that had any Core Web Vitals metrics.
Fewer pages than overall origins (domains) are passing Core Web Vitals (only 21.2% of pages passing). I’m not sure how to account for this fully. I suspect it may be due to caching where secondary page loads tend to be faster.
For page-level data, LCP is similar to the origin data. FID is better and something that doesn’t seem to be a concern for most pages. CLS is worse in the page-level data than the origin data.
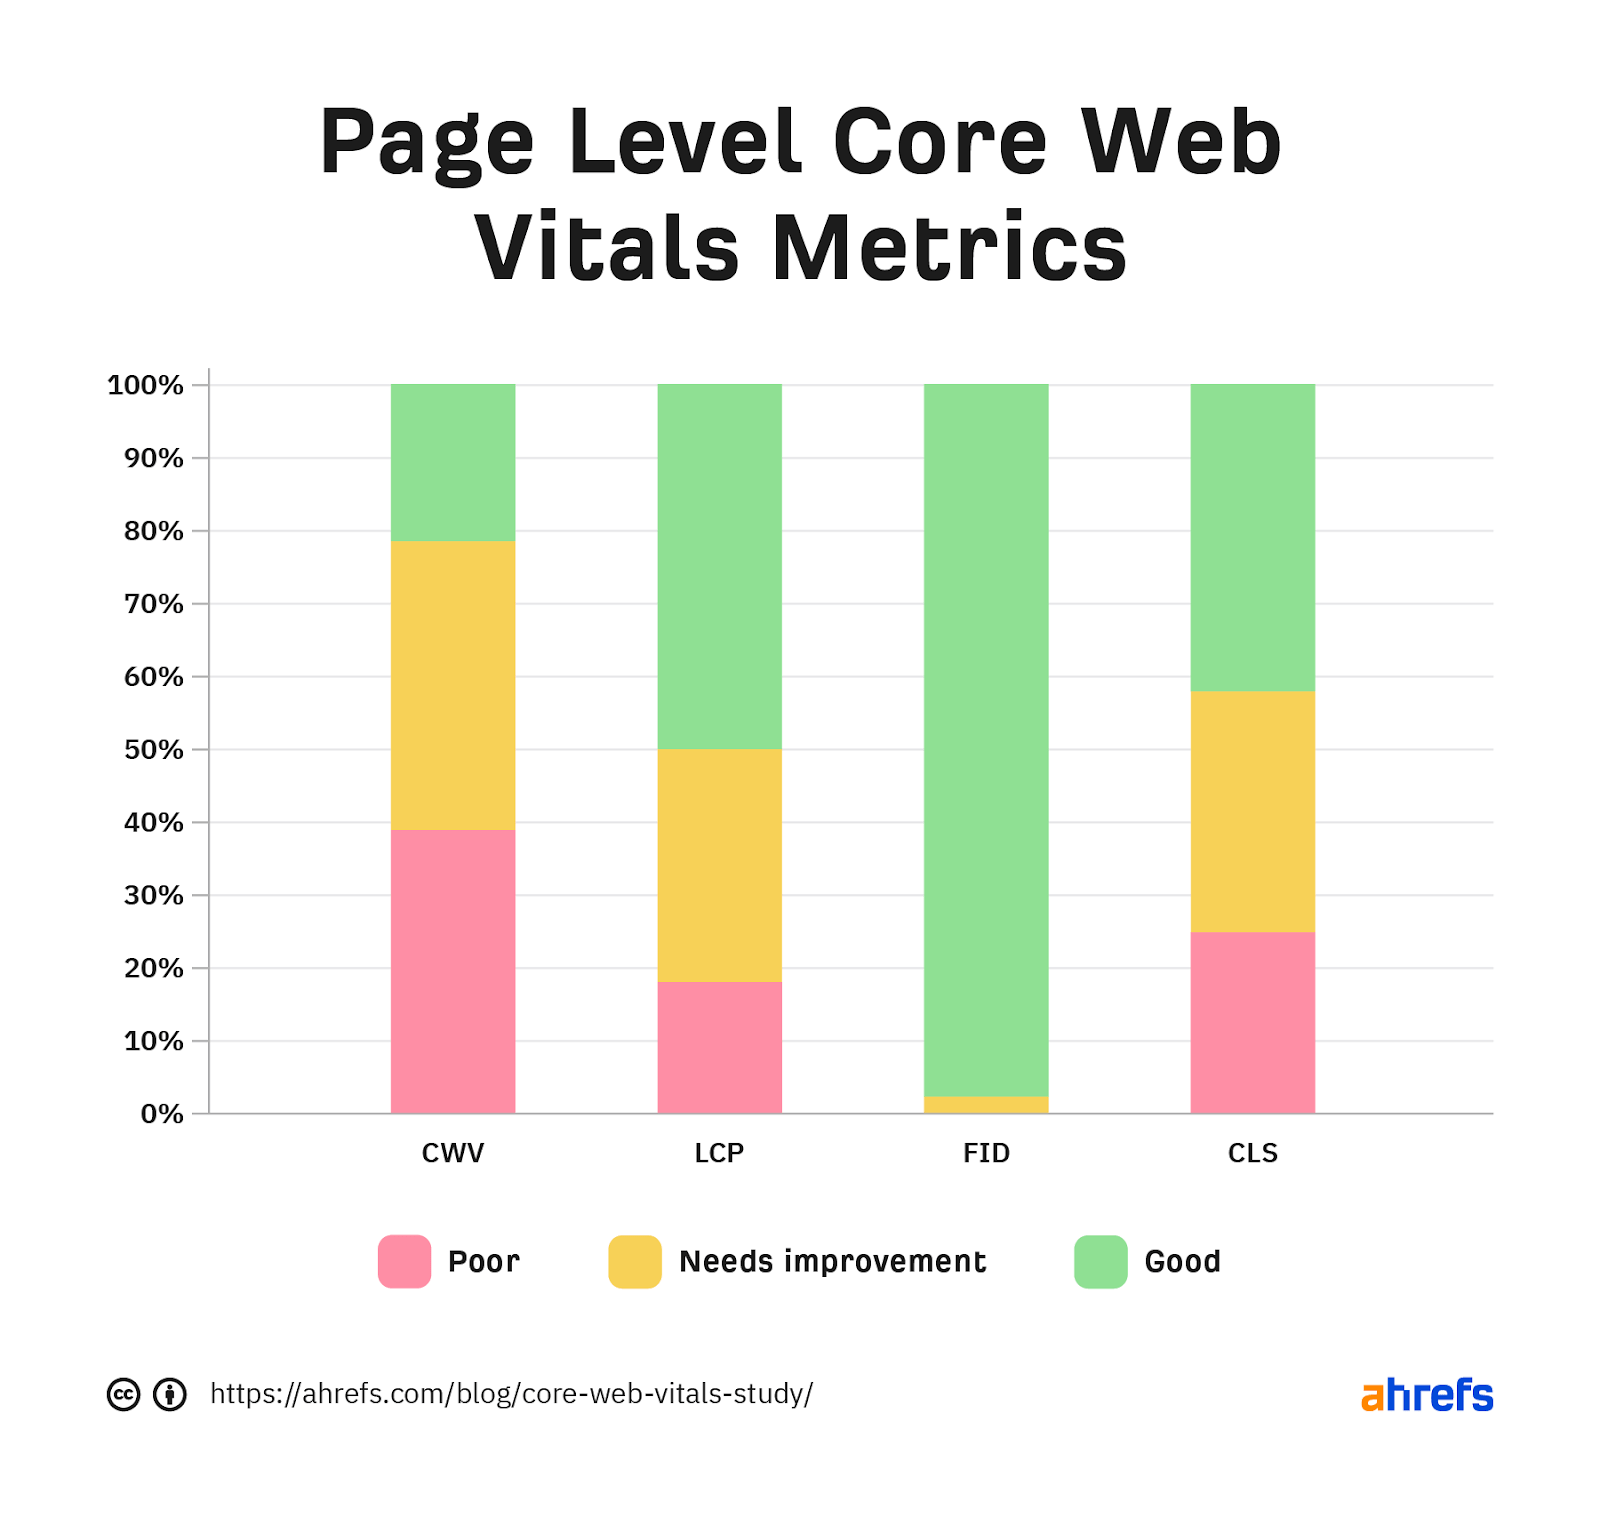
Breakdown of page-level Core Web Vitals, including LCP, FID, and CLS.
Final thoughts
I wanted to study the impact of Core Web Vitals on rankings. But due to the timing of the rollout and other updates that happened at the same time, I don’t think there’s a good method that is conclusive. There are other studies that show a correlation between speed improvements and rankings. But saying this isn’t that different from saying sites that are more likely to work on their SEO also rank better than those that don’t.
If you want to record Core Web Vitals data for your site while you make improvements, you can enable the option in the Site Audit settings. All users, including free users, have access to this via Ahrefs Webmaster Tools.
If you’re having trouble improving your metrics or want to learn more about how pages load, check out our page speed guide.
What data surprised you the most? What data will you like to see if we update this study? Let me know on Twitter.


